5633
Interregional associations between GABA+, Glx and BOLD contrast changes during acute pain perception in the human brain – A combined 1H fMRS and fMRI study1Medical Physics Group, Institute of Diagnostic and Interventional Radiology, Jena University Hospital - Friedrich Schiller University Jena, Jena, Germany, 2Psychiatric Brain & Body Research Group Jena, Department of Psychiatry and Psychotherapy, Jena University Hospital, Jena, Germany
Synopsis
Possible associations between BOLD and left insular GABA+/tCr and Glx/tCr levels were investigated by conducting whole brain fMRI measurements and 1H MEGA-PRESS MRS at 3 T in healthy subjects prior to and during acute pain stimulation. A significant negative correlation between insular resting state GABA+/tCr levels and BOLD response was obtained in the supplementary motor area with transition to the mid-cingulate cortex. Furthermore, insular ΔGlx revealed a significant positive association with BOLD signal in the left anterior and right posterior insula. These findings suggest interregional interrelations between metabolite levels and stimulus induced BOLD response in the pain processing network.
Purpose
Combined acquisition of 1H MR brain spectra and fMRI data allows to directly investigate associations between local metabolite resting state levels and stimulus induced BOLD signal changes and is focus of recent research to explore the neurochemical regulation of brain activity1. In the current work, combined functional MRS (fMRS) and fMRI measurements were conducted in healthy subjects to investigate associations between acute pain induced BOLD changes in the whole brain and the resting state GABA+/tCr and Glx/tCr levels as well as the stimulus induced changes ΔGABA+ and ΔGlx measured in the left insular cortex.Materials and Methods
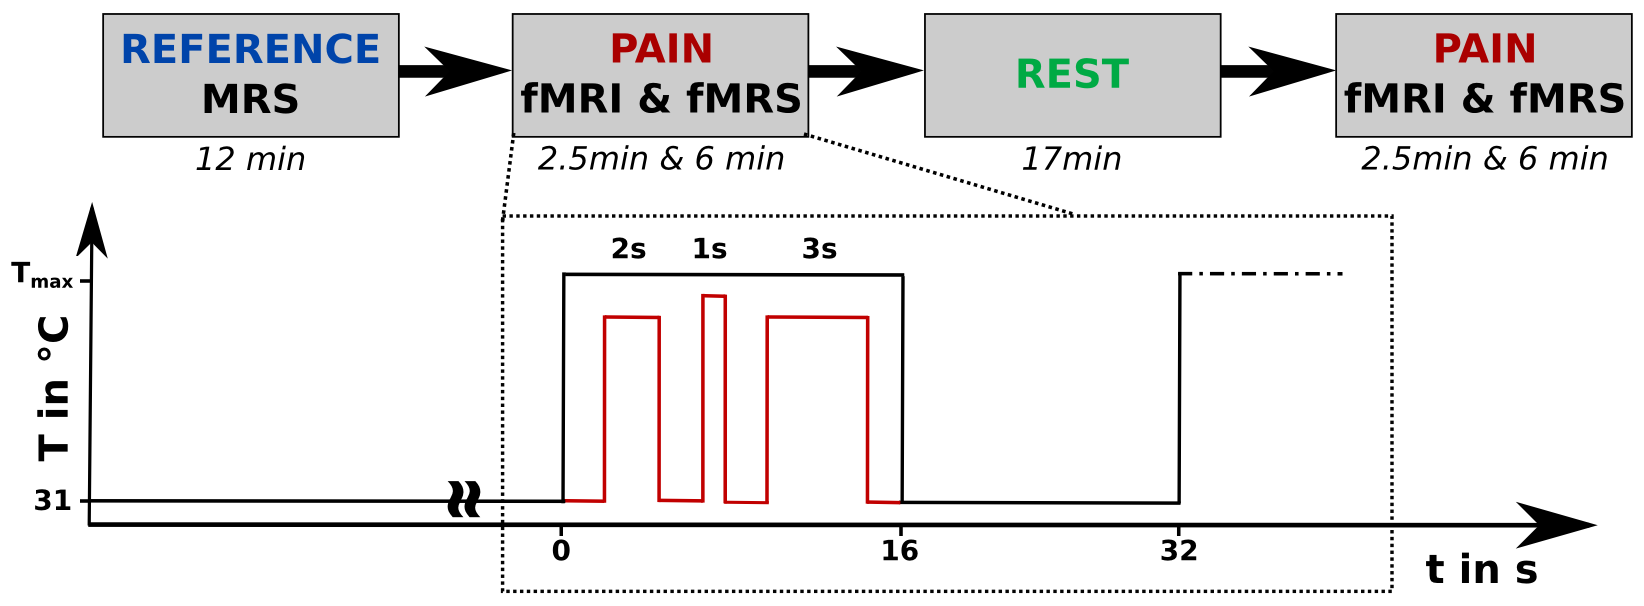
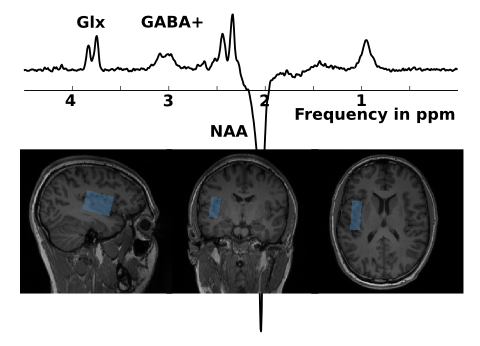
MR data were acquired on a 3 T whole-body MR scanner (Magnetom PRISMA fit, Siemens, Erlangen, Germany) of 25 healthy male volunteers (24.9 ± 3.0 y., right-handed) with a 64-channel phased array head matrix coil. T1-weighted 3D anatomical reference data (MP-RAGE, FOV 256 x 256 mm2) were collected for positioning of the MRS voxel in left insular cortex (Fig. 2). MRS data were acquired (1H MEGA-PRESS, TR/TE = 1800/68 ms, editing at 7.5 / 1.9 ppm, water suppression, 384 transients) before (REF) and during stimulation (PAIN). In addition, gradient-echo EPI fMRI measurements were conducted during PAIN (TR/TE = 1600/30 ms, in-plane resolution 2.1 mm, 3.2 mm thickness with a gap of 20 %, 180 volumes). Acquisition of fMRI and fMRS data was split into two blocks, separated by a 17 min resting period allowing recovery from the acute heat pain stimulation2 of the right hand (Ø 27 mm CHEPS thermode, Medoc PATHWAY, Ramat Yishay, Israel). In each PAIN condition, 15 resting intervals were interleaved with 15 stimulus intervals of 16 s duration each (see Fig. 1), consisting of alternating baseline (31 °C) and stimulation periods including three individually adjusted heat pulses (Fig. 1). MRS data were processed as described in3 and pooled to mean REF and PAIN spectra, which were quantified with the AMARES tool4 (jMRUI v5.2) to determine the metabolite GABA+/tCr, Glx/tCr ratios in REF as well as their pain induced changes ΔGABA+ and ΔGlx. EPI data were analyzed using SPM12 (http://www.fil.ion.ucl.ac.uk/spm/, motion and slice-time correction, spatial normalization to the MNI space, smoothing). A general linear model was applied to calculate whole brain parametric maps of relative BOLD signal changes (BOLD in %, stimulation vs. baseline contrast divided by corresponding constant term of regression5). Interrelations of insular GABA+/tCr, Glx/tCr, ΔGABA+ and ΔGlx and BOLD signal changes were investigated using a multiple regression analysis (punc < 0.005, cluster size according to the expected voxels per cluster). Finally, mean BOLD signal changes from significant clusters were correlated with insular metabolite levels by using the Spearman´s rank correlation.Results
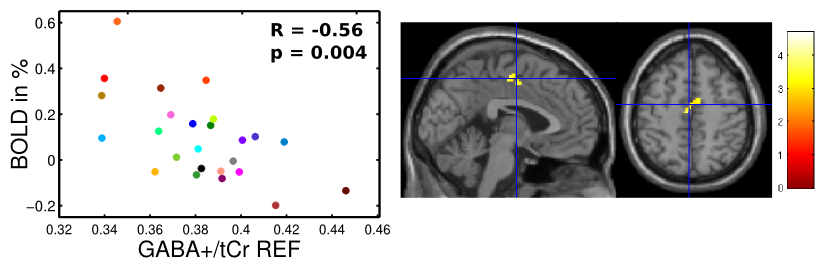
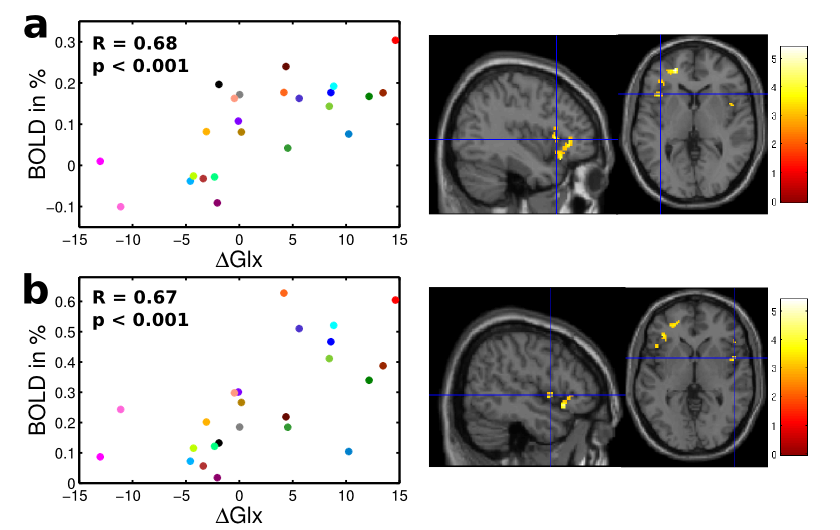
A cluster located in the supplementary motor area (SMA) with transition to the mid-cingulate cortex (MCC) was identified showing a significant negative association between insular resting state GABA+/tCr levels and acute pain evoked BOLD signal changes (Fig. 3). Within this cluster, subject specific mean BOLD signal changes were negatively correlated with corresponding resting state GABA+/tCr levels (R = -0.56, p = 0.004). Although neither the intra-individual GABA+/tCr nor the corresponding Glx/tCr levels showed any distinct pain induced changes among the subject group, the individual ΔGlx values revealed significant positive correlation with BOLD signal changes in the left anterior and right posterior insular cortices, depicted in R = 0.68 (p < 0.001) and R = 0.67 (p < 0.001), respectively (Fig. 4).Discussion and Conclusion
In our study, significant associations were identified between resting state GABA+ levels as well as pain evoked Glx changes in insular cortex and BOLD signal changes in brain regions that are known to be activated during pain perception6. Since GABA is the main inhibitory neurotransmitter with relatively low metabolic fraction, the detected interrelation may reflect the adjustment of neuronal activity by inhibitory neurochemical processes. Moreover, the positive association between ΔGlx and BOLD response supports the notion that increased functional energy demands are sustained by oxidative metabolism. Thus, our findings might be evidence for interregional interactions between neurotransmitter or also energy metabolism turnover and stimulus induced brain activations within the pain processing network, being in line with previous studies demonstrating interrelations of GABA in the resting motor network7 or for brain regions showing fear related BOLD responses8. Therefore, the combination of fMRS and fMRS is a powerful tool to improve knowledge about the complex system of neurochemical mechanisms regulating brain activity in brain networks.Acknowledgements
M.C. was supported by a graduate scholarship of the Martin Luther University of Halle-Wittenberg. A.G. acknowledges funding from the German Research Foundation (DFG, GU 1108/3-1).References
1. Duncan NW, Wiebking C, Munoz-Torres Z, Northoff G. How to investigate neuro-biochemical relationships on a regional level in humans? Methodological considerations for combining functional with biochemical imaging. J Neurosci Methods. 2013;221:183-188.
2. Cleve M, Gussew A, Reichenbach JR. BOLD-fMRI signal changes during prolonged heat pain stimulation. In: Proc. Intl. Soc. Mag. Reson. Med. 24 (2016). ; 2016:4-5.
3. Cleve M, Gussew A, Reichenbach JR. In vivo detection of acute pain-induced changes of GABA+ and Glx in the human brain by using functional 1H MEGA-PRESS MR spectroscopy. Neuroimage. 2015;105:67-75.
4. Stefan D, Cesare F Di, Andrasescu a, et al. Quantitation of magnetic resonance spectroscopy signals: the jMRUI software package. Meas Sci Technol. 2009;20(10):104035.
5. Bednarík P, Tkác I, Giove F, et al. Neurochemical and BOLD responses during neuronal activation measured in the human visual cortex at 7 Tesla. J Cereb Blood Flow Metab. 2015;35(4):601-610.
6. Apkarian AV, Bushnell MC, Treede R-D, Zubieta J-K. Human brain mechanisms of pain perception and regulation in health and disease. Eur J Pain. 2005;9(4):463-463.
7. Stagg CJ, Bachtiar V, Amadi U, et al. Local GABA concentration is related to network-level resting functional connectivity. Elife. 2014;3(3):1-9.
8. Lipp I, Evans CJ, Lewis C, Murphy K, Wise RG, Caseras X. The relationship between fearfulness, GABA+, and fear-related BOLD responses in the insula. PLoS One. 2015;10(3):1-18.
Figures