5631
Sodium short and long T2* components in the normal human brain: a multi-TE 23Na MRI study at 7TMark Bydder1, Armin Nagel2, Adil Maarouf1,3, Jeremy Verneuil1, Patrick Viout1, Maxime Guye1,3, Jean-Philippe Ranjeva1, and Wafaa Zaaraoui1
1Aix-Marseille Univ, CNRS, CRMBM, Marseille, France, 2University Hospital Erlangen, Institute of Radiology, Erlangen, Germany, 3Aix-Marseille Univ, APHM, Hopital de la Timone, CEMEREM, Marseille, France
Synopsis
The study aimed to provide values of the short and long T2* sodium components of the human brain at 7T using a multi-echoes 23Na MRI approach (n=24 TE). These results may help improving sodium quantification at 7T.
Introduction
Sodium plays a key role in the study of metabolism and can provide relevant information on cell integrity in particular in the human brain. Several studies have taken advantages of the recent developments in scanner technology (ultra high field magnets, fast and strong gradients) and sequences design (ultra short echo time) to apply sodium MRI in patients in order to assess non-invasively total sodium accumulations in neurological disorders and diseases [1]. To obtain reliable quantitative sodium concentrations, accurate measurements of the bi-exponential 23Na transverse relaxation times (T2*) are required. Some studies have reported the T2* short (0.5-5ms) and T2* long (15-30ms) sodium components of the human brain using only few echoes [1-2]. The objective of this study was to improve the assessment of T2* short and T2* long sodium components of the human brain at 7T using a dedicated multi-echo radial sequence.Methods
All experiments were performed on a Siemens 7T Magnetom using a dual tuned 23Na/1H QED birdcage coil. A multi-echo density adapted 3D projection reconstruction 23Na MRI sequence was designed (TR=120 ms, 10.000 spokes, 3.5mm3 isotropic resolution, 8 echoes, acquisition time = 20 min). This sequence was applied three times in order to obtain 24 TE ranging from 0.3 ms to 100 ms (0.3 – 0.8 – 2.3 – 6.3 – 7 – 9.7 – 12 – 13 – 15 – 17 – 19 – 21 – 23 – 25 – 28 – 31 – 35 – 40 – 45 – 54 – 66 – 80 – 89 – 100 ms). A high-resolution proton MRI 3D-MP2RAGE (TR=5000ms / TE=3ms / TI1=900ms / TI2=2750ms, 256 slices, 0.6mm3 isotropic resolution, acquisition time = 10 min) was obtained using a 32-element 1H head coil (Siemens). This protocol was applied in 14 healthy subjects (9M/5F, median age of 22 yo [range: 20-32]). For each echo time, sodium images were reconstructed using a gridding method [3] and after sodium images from all echoes times were realigned to sodium images from the first echo time (example showed in Figure 1). Proton images were segmented to white matter (WM) and grey matter (GM) compartment and the resulting maps of WM and GM were realigned and applied to the sodium images of the different echoes. A bi-exponential fitting was performed using Matlab in order to assess the short and long T2* component of the sodium signal decay according to the TE (Figure 2) for each subject.Results
As illustrated in Figure 3, the sodium signal decreased rapidly according to the TE. The distribution of the T2* short and T2* long sodium values among all GM and WM voxels are displayed in Figure 4. The mean T2* short sodium in the GM (5.02 ± 0.89 ms) was significantly higher than in WM (4.50 ± 0.65 ms). The mean T2* long sodium in the GM (33.89 ± 5.96 ms) was significantly lower than in WM (39.99 ± 5.24 ms). The ratio between the sodium signal from the short component (M0short) and the long component (M0long) was 60% (M0short) vs 40% (M0long) in WM while it was 45% (M0short) vs 55% (M0long) in GM.Discussion
This study using a dedicated multi-echo radial sequence allowed us to report values of the short and long components of the bi-exponential transverse decay of sodium in the human brain at 7T. Differences found between GM and WM are probably due to the different sub-structures involved. More subjects are needed to confirm these preliminary results in order to improve future sodium quantification studies at 7T.Acknowledgements
No acknowledgement found.References
[1] Shah NJ, Worthoff WA, Langen K-J. Imaging of sodium in the brain: a brief review. NMR Biomed. 2016; 29(2):162–174.
[2] Madelin G and Regatte R. Biomedical Applications of Sodium MRI In Vivo. Journal of Magnetic Resonance Imaging 38:511–529 (2013).
[3] Nagel AM, Laun FB, Weber M-A, Matthies C, Semmler W, Schad LR. Sodium MRI using a density-adapted 3D radial acquisition technique. Magn Reson Med. 2009;62:1565–1573.
Figures
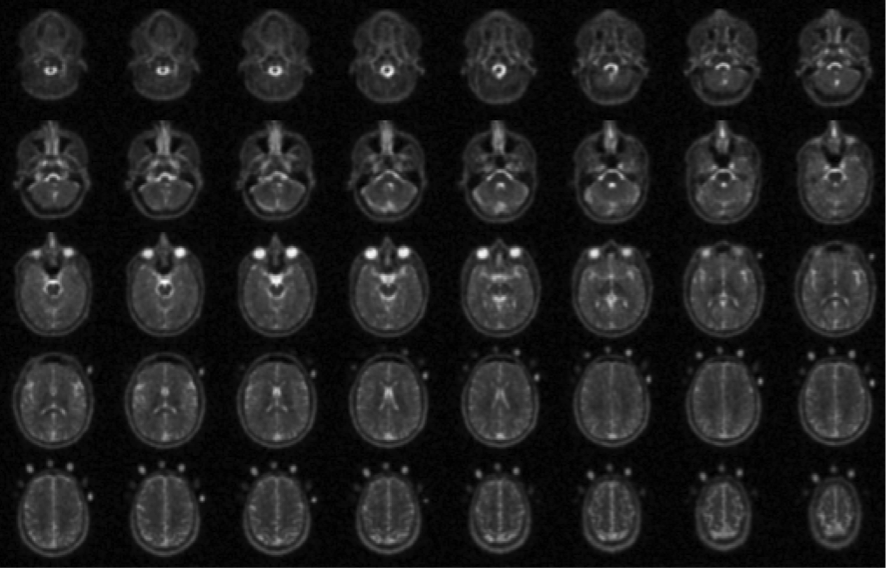
Figure 1: Example of brain sodium
images acquired at 7T with TE=0.3 ms
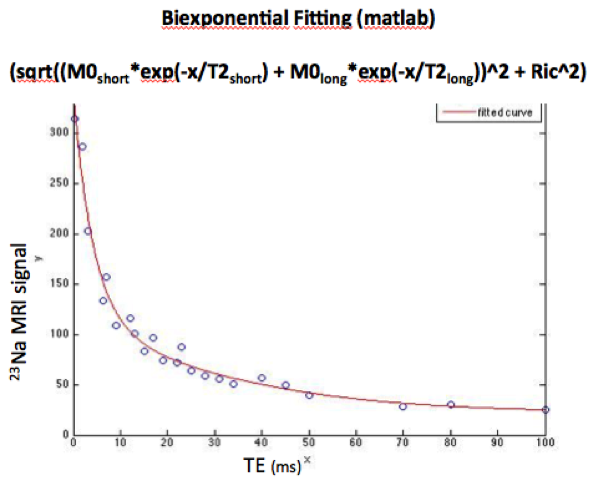
Figure 2: Biexponential
fitting of the sodium signal decay
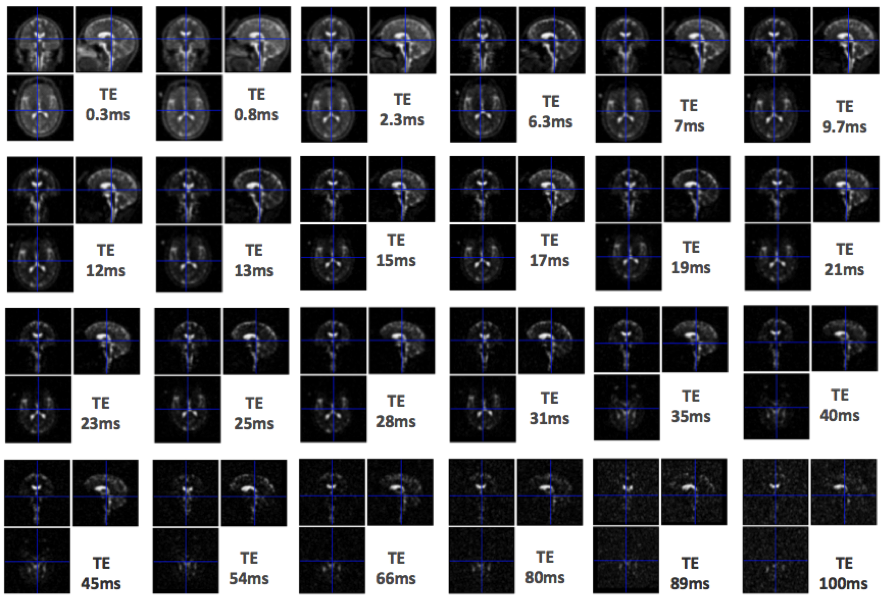
Figure 3: Display of the
sodium MRI acquired at 24 echo times (from 0.3 ms to 100 ms)
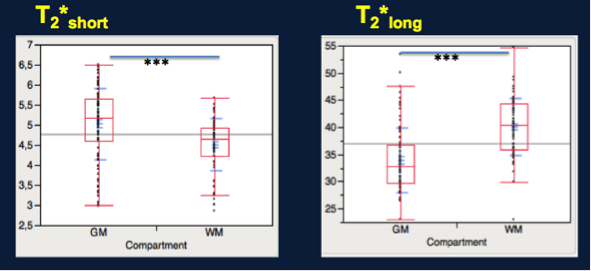
Figure 4: Distribution of the
T2* short and T2* long sodium values in GM and WM