5630
Investigation of Strophanthin Induced Na-/K-ATPase Blockage by Means of 23Na Multi Quantum Spectroscopy in a High Density Cell Culture on Chip1Computer Assisted Clinical Medicine/CBTM, Heidelberg University, Mannheim, Germany, 2CIMAR, National High Magnetic Field Laboratory/FSU, Tallahassee, FL, United States, 3Institute for Biological Interfaces-5, Karlsruhe Institute of Technology, Eggenstein-Leopoldshafen, Germany
Synopsis
Sodium multi quantum (MQ) spectroscopy was used to record single (SQ) and triple quantum (TQ) resonances from a 3D cell culture implanted in a MRI compatible bioreactor under the strophanthin induced inhibition of the sodium-potassium pump (Na-/K-ATPase) at 9.4T. The results show a clear alteration in the ratio TQ/SQ under strophanthin influence. Due to the high control of physiological parameters the bioreactor provides, this alteration can be directly linked to the inhibition of the Na-/K-ATPase.
Purpose
The Na-/K-ATPase plays a major active role in maintaining ion concentration gradients across the cell membrane. Ion-protein interaction is a leading source that sodium can generate a multi quantum (MQ) spectrum1. Such spectra can be used to study the activity of the Na-/K-ATPase in living tissue. In this study we investigated the strophanthin induced blockage of the Na-/K-ATPase in a MRI compatible bioreactor with a high density 3D cell culture on chip by means of MQ spectroscopy.Methods
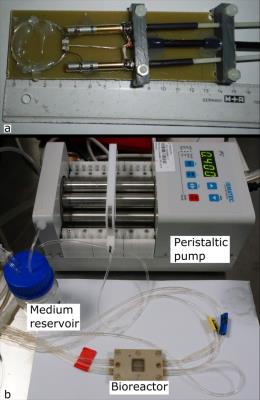
Experiments were carried out on a 9.4T small animal scanner (Biospec 94/20, Bruker, Ettlingen, Germany) using ParaVision 6.0 with a custom built single loop sodium surface coil (diameter 3cm, unloaded/loaded Q factors 398/386, see) placed on top of the bioreactor (Figure 1a). The bioreactor, connected to the perfusion pump and the medium reservoir, is shown in Figure 1b. Maintaining a temperature of 37°C inside the reactor was achieved by putting the reactor on the scanners heated animal bed and regular temperature measurements.
Passaging and processing the cells (Hepatoma Hep G2, ATCC, HB-8065, Manassas, VA, USA) for the bioreactor experiments was done according to references2-4.
A 6ml 20mM strophanthin bolus was injected into the system and perfusion was kept constant until the bolus covered the whole cell culture. After interrupting perfusion for 30min the bolus was washed out from the system.
MQ spectroscopy was performed using a 16 step phase cycle TQTPPI sequence composed of three hard pulses according to the scheme 90°(Φ)–τ–90°(Φ+Φ’)–δ–90°(0°)5,6. Phase Φ and evolution time τ were incremented simultaneously with the steps of ΔΦ = 45° and Δτ between 150 - 200µs while δ was kept constant at a minimal value, i.e. equal to the pulse length. Phase Φ’ was alterated between 90° and 270° after each step. Real parts of all TQTPPI spectra were phase corrected manually and non-linear fitted using MATLAB (R2015a, The MathWorks Inc., Natick, MA, USA). Numeric integration was used to determine the area of the triple quantum (TQ) and single quantum (SQ) MR peaks and the relative TQ intensities (TQ/SQ) were calculated.
Results
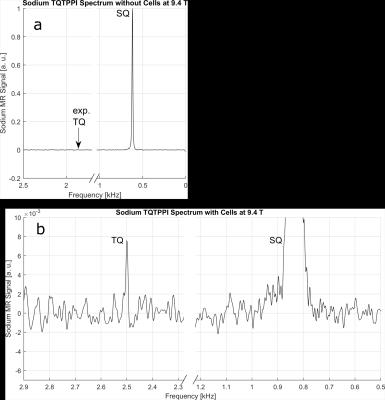
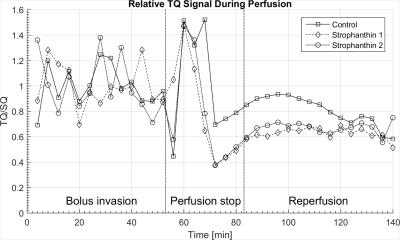
A complete sodium TQTPPI spectrum recorded without cells is shown in Figure 2a. The SQ resonance at 0.8kHz dominates the spectrum. In presence of living cells in the bioreactor, a sodium TQ MR signal can be easily observed (Figure 2b). Figure 3 represents the time courses for sodium TQ/SQ ratio according to the perfusion protocol. The plot is separated into three parts: bolus invasion, perfusion stop and reperfusion.
All data have been normalized to the mean value of the relative TQ intensity prior to the arrival of the bolus. Values for TQ/SQ show oscillations during bolus perfusion, which are probably induced by the pulsatile flow of the pump. In case of no strophanthin (solid line, rectangular markers) this leads to a value of 1.00±0.16. Experiments with strophanthin showed values of 1.00±0.17 (dashed line, diamond markers) and 1.00±0.22 (dash-dotted line, circular markers) during this period.
Stopping perfusion increased TQ/SQ immediately and it reached a maximum value of 1.52±0.08 (no strophanthin), 1.48±0.01 and 1.47±0.01 (both strophanthin). This peak value is followed by a drop of TQ/SQ during the reperfusion time. Later, sodium TQ signal strives towards higher values and seems not to be affected by reestablishing the perfusion. Oscillations such as seen during bolus invasion do not occur during reperfusion. During reperfusion the mean value TQ/SQ without strophanthin is equal to 0.81±0.11. With strophanthin the values for TQ/SQ are 0.63±0.04 and 0.67±0.05. Comparing the signal during the reperfusion period with the signal during bolus invasion leads to a relative signal reduction of 19.30%±0.14% without strophanthin. Reductions of 37.37%±0.22% and 33.18%±0.18% are much more pronounced during strophanthin influence. All values are also listed in Table 1.
Discussion & Conclusion
Our experiments show that sodium TQ signal can be detected from the living cells in the bioreactor. The amount of cells could be in the range 6×10⁶. The lack of oscillations in TQ/SQ, as seen during bolus invasion, may indicate that the cells did not yet reach equilibrium with their environment. An additional lactate dehydrogenase measurement confirmed that 90% of the cells survive the treatment with 20mM strophanthin. Differences between TQ signals during bolus invasion and reperfusion were reproducible and can be connected to the blockage of the Na‑/K‑ATPase induced by strophanthin interventions. The high control of physiological parameters for cells in the bioreactor provides unique opportunities to investigate a variety of cells and a variety of interventions.Acknowledgements
A portion of this work was performed at the National High Magnetic Field Laboratory, which is supported by National Science Foundation Cooperative Agreement No. DMR-1157490 and the State of FloridaReferences
1 Rooney WD and J.C. Springer, A Comprehensive Approach to the Analysis and Interpretation of the Resonances of Spins 3/2 from Living Systems. NMR Biomed, 1991;4:209-226.
2 Gottwald E, et al., Characterization of a Chip-Based Bioreactor for Three-Dimensional Cell Cultivation via Magnetic Resonance Imaging. Z Med Phys, 2013;23:102-110.
3 Gottwald E, et al., A Chip-Based Platform for the In Vitro Generation of Tissues in Three-Dimensional Organization. Lab Chip, 2007;7:777-785.
4 Altmann B, et al., The Three-Dimensional Cultivation of the Carcinoma Cell Line HepG2 in a Perfused Chip System Leads to a more Differentiated Phenotype of the Cells Compared to Monolayer Culture. Biomed Mater, 2008;3:034120.
5 Schepkin VD, et al. Comparison of in Vivo Potassium, Chloride and Sodium TQ Effects at 21.1 T. in Proc Intl Soc Mag Reson Med. 2016. Singapore, Singapore.
6 Schepkin VD, et al. Efficient Detection of Bound Potassium and Sodium using TQTPPI Pulse Sequence. in Proc Intl Soc Mag Reson Med. 2015. Toronto, Canada.
Figures


