5629
Improving Sodium Concentration Measurements using sub-sampled Non-Cartesian Trajectories and Non-Linear Iterative Reconstruction algorithm1NeuroSpin, CEA, Paris Saclay University, Paris, France, 2Center for Biomedical Imaging, Department of Radiology, New York University Langone Medical Center, New York, USA, 3Neurology Department, Aachen University Clinic, Germany
Synopsis
In this work we explored different aspects that could benefit to in vivo Sodium concentration measurements in order to reduce Acquisition Time to improve patient comfort and an reduce risk of motion artifacts. We studied two Non Cartesian image reconstruction methods and explored subsampling.
Introduction
Despite sodium being the second most concentrated NMR sensitive nuclei of the human body, 23Na MRI’s translation to clinical research is hampered by its lower NMR sensitivity than 1H leading to quite long acquisition times (TA), discomfort for the patient and an increased risk of motion artifacts.
In order to manage the accurate mapping of sodium total concentration (TSC) in the shortest amount of time, we have investigated different methods to reduce TA by fractioning or sub-sampling our FLORET[1] acquisitions.
Methods
One healthy volunteer was recruited and scanned after providing informed consent.
All acquisitions were performed on a clinical 3T scanner (PRISMA, Siemens Healthcare, Erlangen, Germany) using a dual-tune single channel 1H/23Na coil (Rapid Biomed, Rimpar, Germany).
Our quantification pipeline (designed by the acronym VaSCo) relies on the Variable Flip Angle Method[2] applied to 23Na MRI using steady state SPGR acquisitions with parameters TR/TE/FA1/FA2=20ms/0.1ms/25°/55°. For comparison, a Total Sodium Concentration (TSC) image was acquired with parameters TE/TR/FA=0.1/120ms/90°. Resolution of all images was 4 mm isotropic. As external references of concentration, four 50mL Falcon tubes (50 and 100mM with both 2% and 6% of agarose) were placed in the FOV.
Our protocol was composed of 3 three-minutes blocks for each FA in the VFA approach and 6 three-minutes blocks for the TSC scan.
To correct for transmitter imperfections, we acquired a B1+ map in 4 minutes using a Double Angle Method (DAM)[3] with FA=60°/120°and a 6mm isotropic resolution.
All 23Na MRI acquisitions were reconstructed with a 3D wavelet-regularized least square reconstruction using the Fast Iterative Shrinkage Thresholding Algorithm (FISTA)[4] or the NUFFT[5] algorithm (for comparison), both being implemented in Matlab (The Mathworks, Natick, USA). FISTA computes the global minimizer of the following convex but non-smooth criterion :
$$ argmin \left( \frac{1}{2}||Ax-y||_{2}^{2}+\lambda||x||_1\right)$$
We used an orthogonal wavelet basis $$$\Psi$$$ and the Nonequispaced Fourier Transform[6]. Fifty iterations were enough to achieve a satisfying energy minimization and a regularization value of 10-5 was selected empirically based on visual quality control
To explore the consequences of sub-sampling our FLORET acquisitions, acquired spokes were retrospectively removed at random from the fully sampled datasets and were reconstructed with FISTA.
Our VaSCo quantification pipeline, described elsewhere, consisted in saturation correction for the TSC acquisition and in B1+, B1- and T1 correction of VFA acquisitions to reach spin density. Both VFA and TSC concentration maps where linearly calibrated using our external references of concentration.
Results
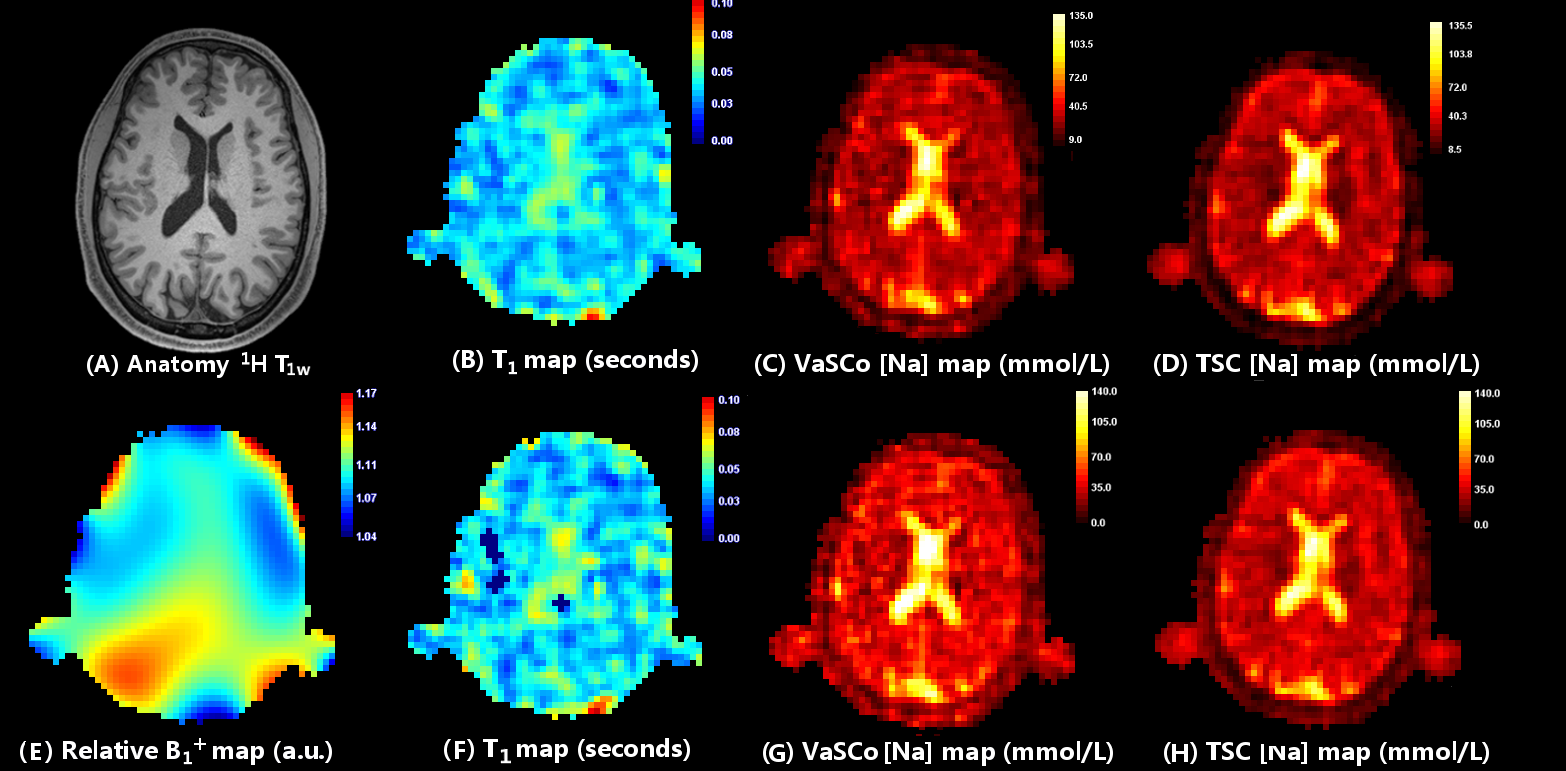
First, we checked that FISTA was providing accurate measures similar to the ones obtained using NUFFT. The two compartment model for Sodium concentration measurement was used yielding theoretical concentration values in the range of [36-39] mmol/L.
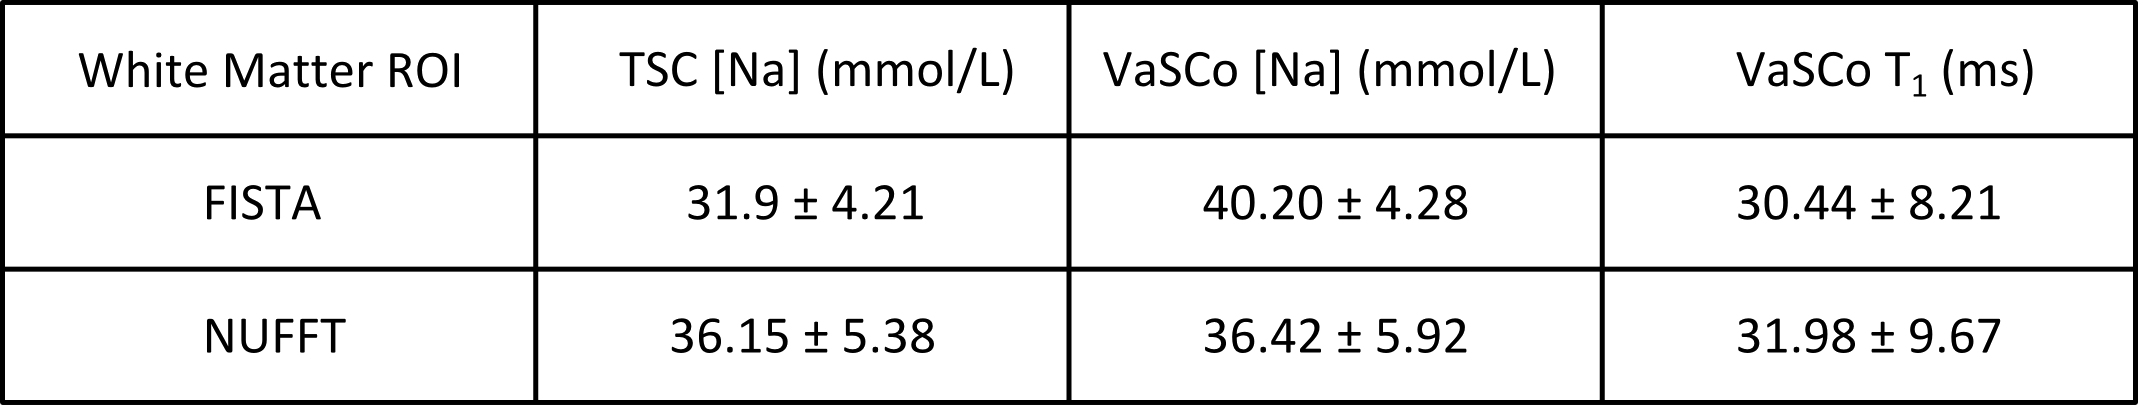
As illustrated in Figure 1 and Table 1 the VaSCo method benefits from FISTA reconstruction providing values closer to the theoretical range and a very stable T1 measurement. Measures were done in an homogeneous ROI of White Matter.
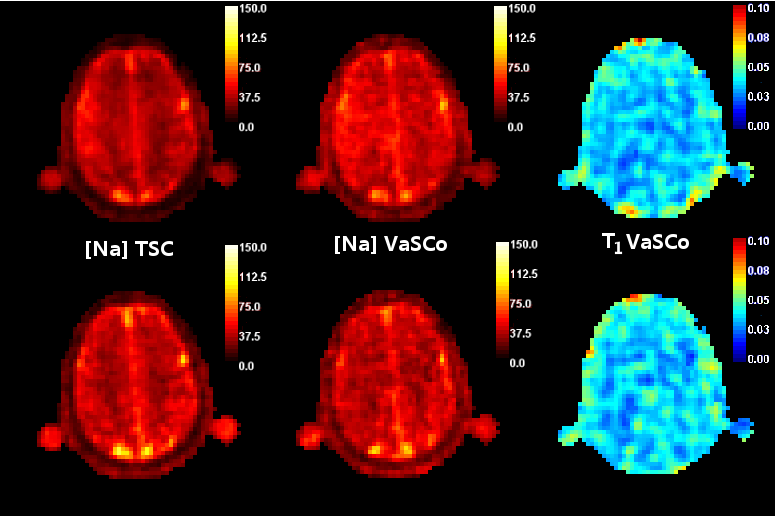
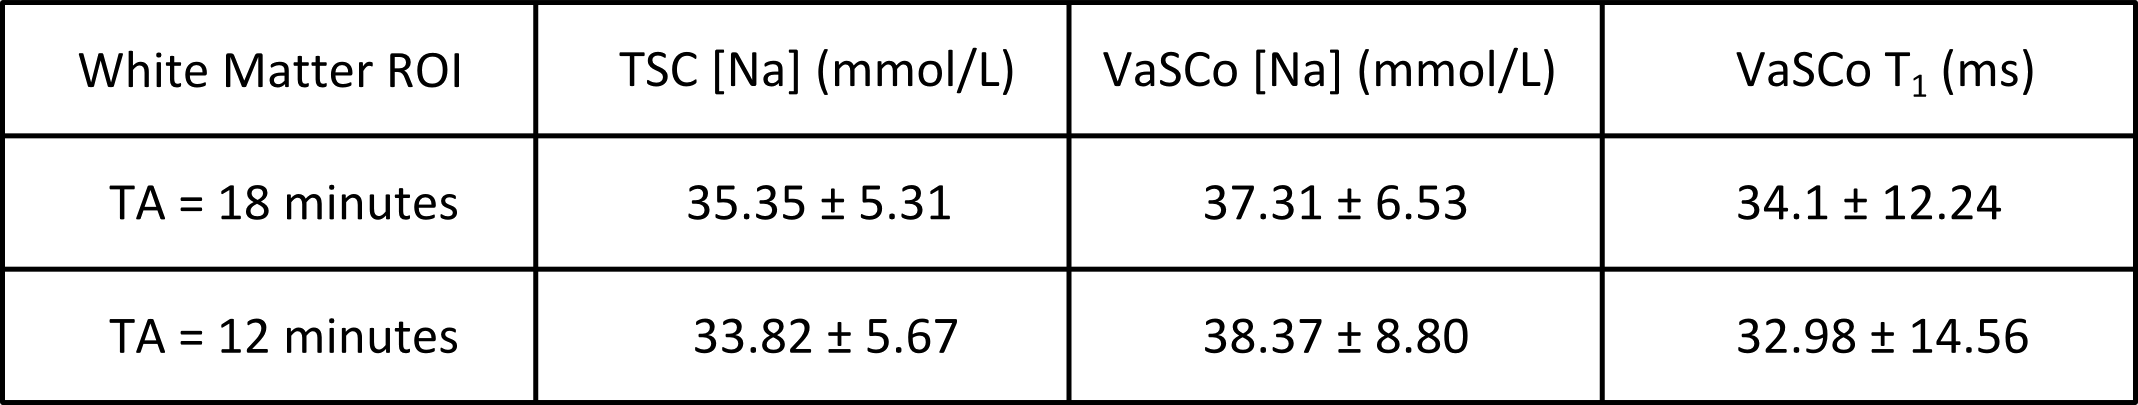
Then, the pipeline was used using 2/3 of the data (=33% TA reduction: 12 minutes instead of 18), i.e. 2 and 4 three-minute blocks for the VFA and TSC approaches. Figure 2 shows reconstructed results and Table 2 measured values, in an homogeneous WM ROI, which are in this case quite similar.
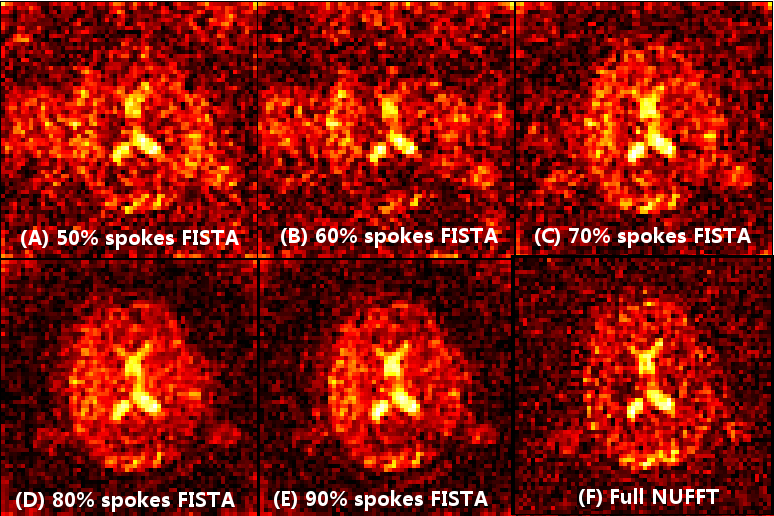
Figure 3 illustrates reconstructed images when randomly removing acquired spokes. As illustrated on images, when removing more than 30% of acquired projection we can clearly notice a strong loss of image structure. This is due to the low intrisic SNR of the acquisition which limits, here, the possible TA reduction to about 20%.
As expected, FISTA reconstruction brought an increase of SNR due to an internal denoising and smoothing behavior of the reconstruction algorithm which can benefit to our concentration quantification pipeline.
Conclusion
In this work we explored two aspects that could benefit to in vivo Sodium concentration measurements. First we showed that it was possible to maintain satisfying measured values when reducing TA of 33% thanks to the fractioned acquisition.
Second we showed that using a wavelet based nonlinear iterative reconstruction algorithm was possible while maintaining satisfying measured values, comparable with the one obtained using the NUFFT algorithm.
We explored retrospective subsampling to see if a time reduction was possible. In this case we had to deal with the challenging case of a very short Sodium acquisition of 3 minutes part of a multiple short acquisition scheme. But this result is possibly generalizable to longer Sodium acquisition presenting higher SNR and therefore robustness to subsampling allowing higher subsampling rates. This results is helping us to design an optimal multi block acquisition where subsampling can be explored.
Acknowledgements
No acknowledgement found.References
[1] Pipe et al. FLORET, MRM 66:1303–1311, 2011.
[2] Fram et al. Magn. Reson. Imaging, 5(3):201-8, 1987
[3] Stollberger, MRM 35246-251, 1996.
[4] Beck et al. FISTA, SIAM 2009
[5] Fessler et al. JMR 188(2), 191–195, 2007
[6] Keiner, J. et al. ACM Trans. Math. Software, 36, 2009
Figures