5628
Realistic simulation of 23Na brain data: Understanding the influence of acquisition parameters on the accuracy of 23Na concentration measurement1Medical Physics in Radiology, German Cancer Research Center (DKFZ), Heidelberg, Germany, 2Institute of Radiology, University Hospital Erlangen, Erlangen, Germany
Synopsis
Sodium (23Na) is connected to tissue physiology and can be spatially resolved by MRI. Low in-vivo concentrations and short relaxation times render a quantitative determination challenging. We present a simulation method which allows synthesizing realistic 23Na MRI raw data. Thereby, most effects in typical quantification experiments on the basis of an external concentration reference can be studied. To establish a reference accuracy level, we investigate the influence of T2* decay, undersampling, TE, and TR on 23Na quantification. The presented simulations can be used for the testing and evaluation of quantitative reconstruction methods as well as to test significance in clinical studies.
Introduction
Sodium (23Na) is fundamentally connected to the tissue physiology.1,2,3 MRI allows determining spatially resolved maps of the distribution. However, low NMR sensitivity due to low in-vivo concentrations and extremely short relaxation times render a quantitative determination challenging.
We present a simulation method that allows synthesizing realistic 23Na MRI raw data on the basis of published tissue parameters. Thereby, most effects in typical quantification experiments on the basis of an external concentration reference can be studied. To establish a reference level of accuracy, we investigate the influence of T2* decay, undersampling, TE, and TR on the quantification.
Methods
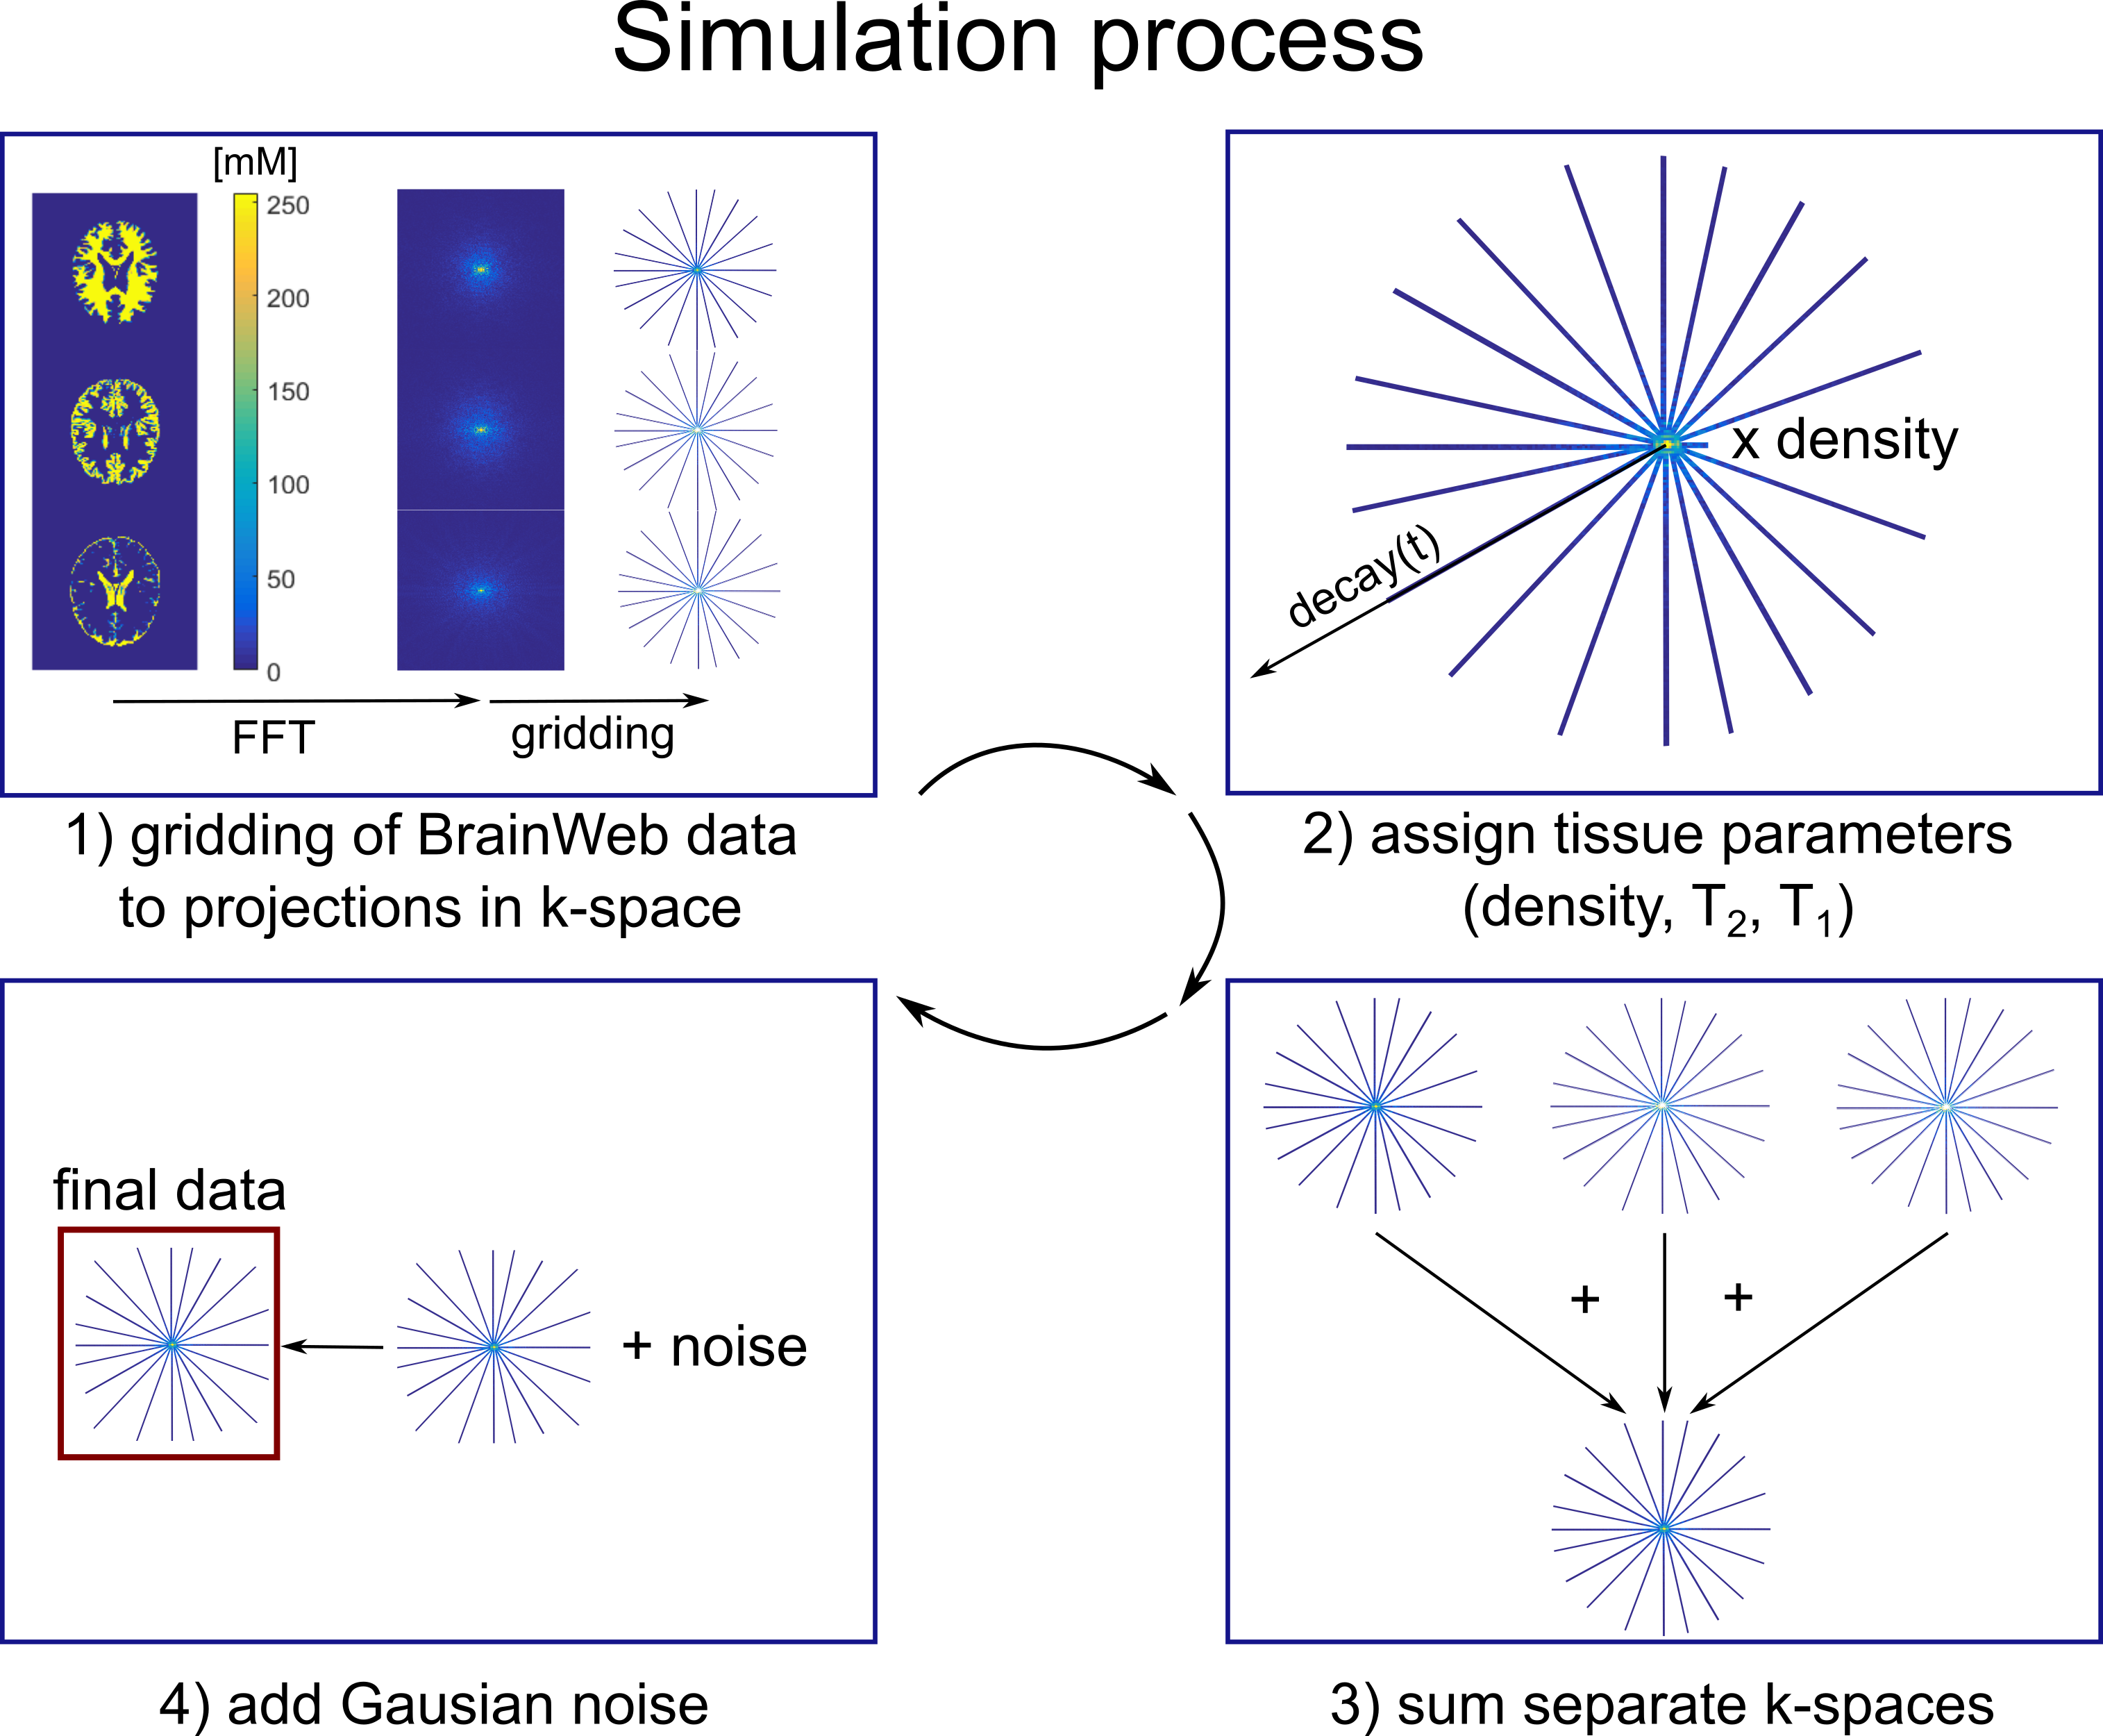
Realistic 23Na MRI brain data were simulated employing the BrainWeb data4 for gray and white matter (GM/WM), cerebrospinal fluid (CSF), and additionally muscle and skin (1$$$\,$$$mm isotropic resolution). Synthetic raw data were generated by the following steps (Figure 1): 1) k-space data for each tissue is generated separately by non-uniform Fast Fourier Transform (nuFFT)5 to the desired acquisition trajectory, 2) tissue specific parameters (spin density, T2*, T1) are assigned by scaling the data amplitude and adding a time-dependent factor to every k-space point depending on relaxation and readout scheme, 3) the separate k-spaces are summed, 4) Gaussian noise is added to achieve a realistic SNR. The noise is scaled by the readout duration (TRO) based on measurement amplitude.
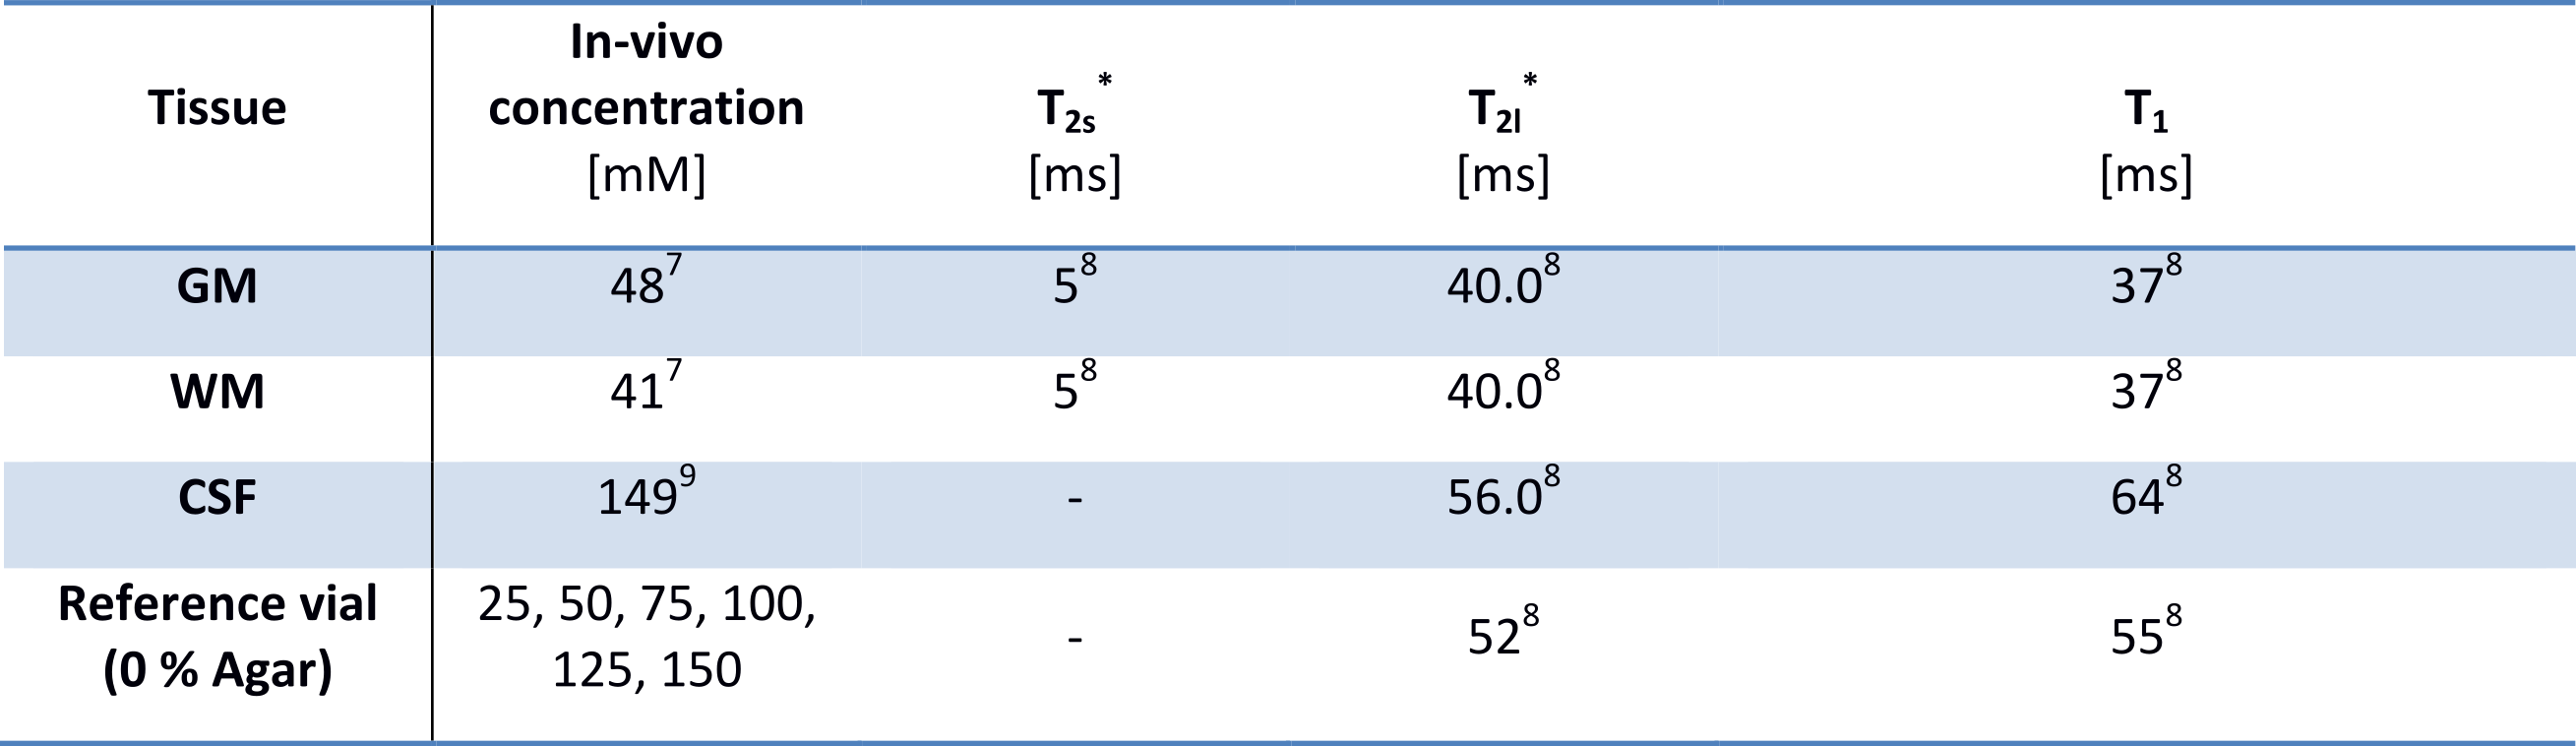
A typical quantification experiment for 23Na was simulated: Reconstructed images were normalized by linear regression of the amplitude of 6 external reference phantoms (simulated as aforementioned). Then, GM, WM, and CSF were segmented by interpolation to the matrix size of the original BrainWeb data. We applied a radial readout scheme6 and used published tissue parameters (Table 1).7,8,9
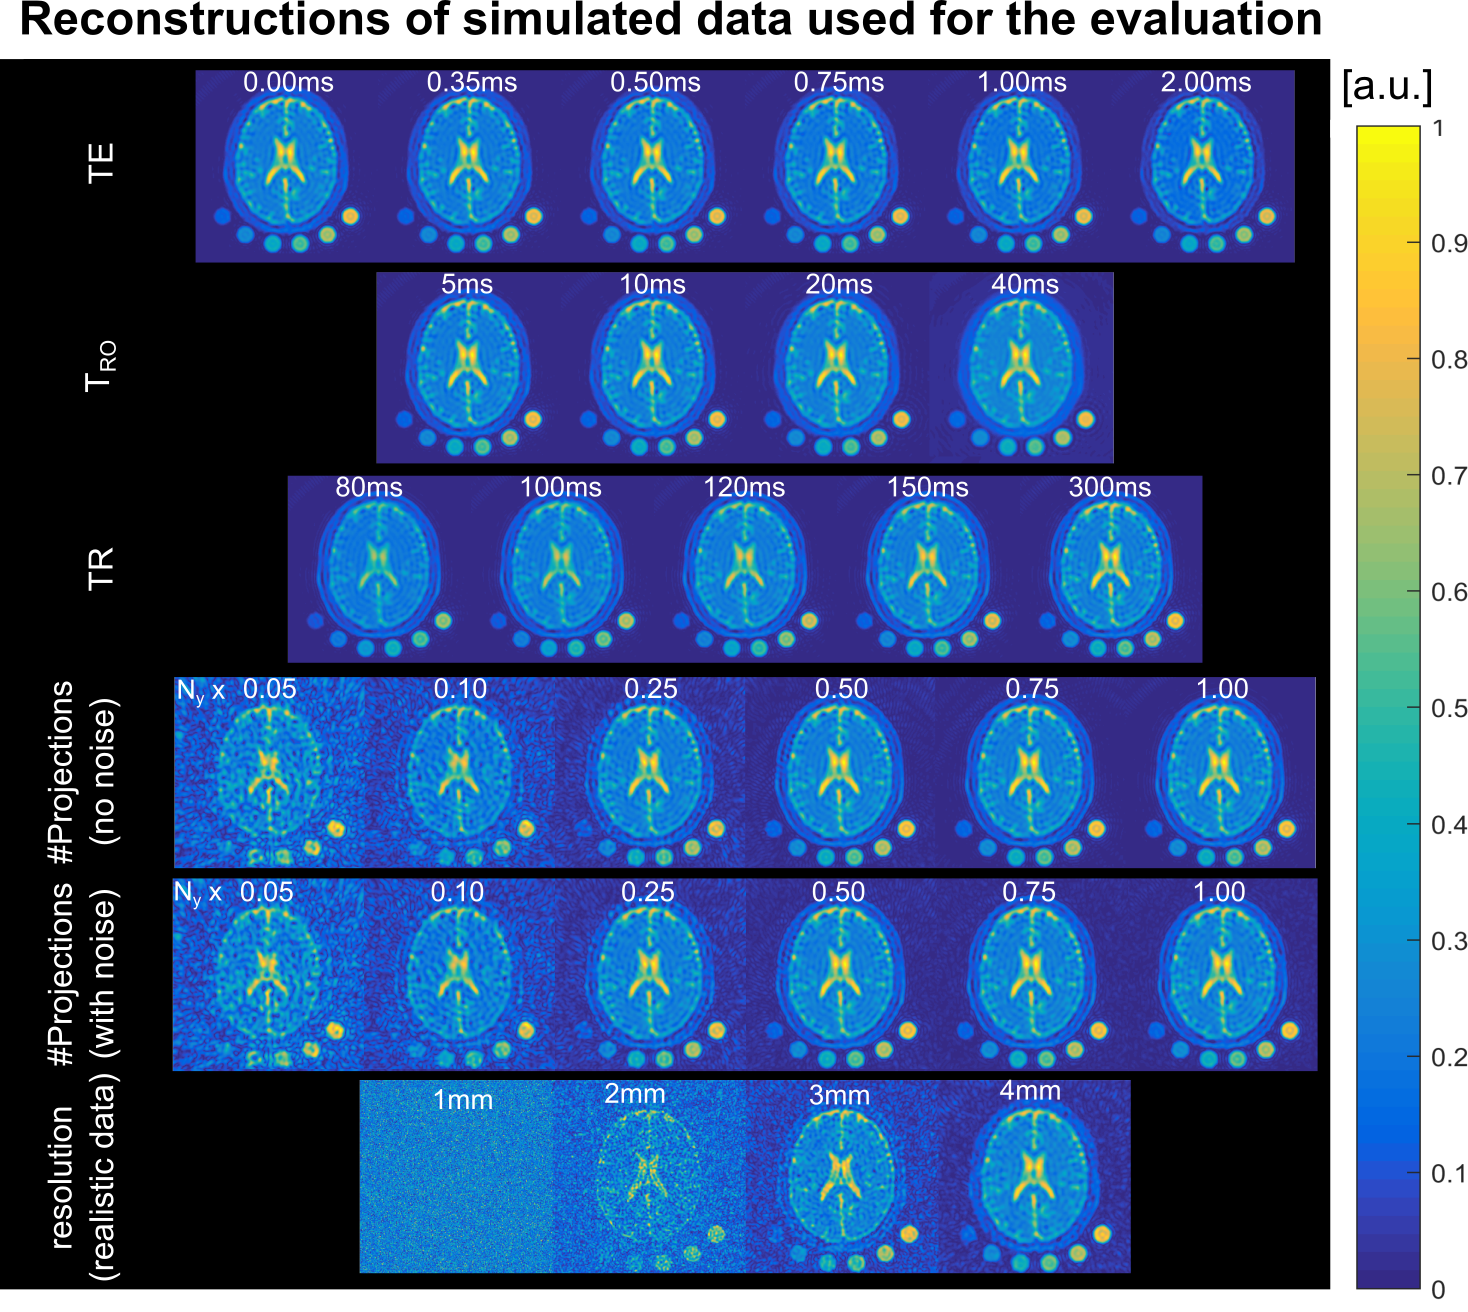
The following acquisition and reconstruction parameters were varied to quantify the change in concentration estimate: TE$$$\,$$$=$$$\,$$$0.00/0.35/0.50/0.75/1.00/2.00$$$\,$$$ms, TRO$$$\,$$$=$$$\,$$$5/10/20/40$$$\,$$$ms, TR$$$\,$$$=$$$\,$$$80/100/120/150/300$$$\,$$$ms, a realistic setting (TE/TR$$$\,$$$=$$$\,$$$0.35/120$$$\,$$$ms) with resolutions of 1/2/3/4$$$\,$$$mm, averaging with/without noise and averaging for fractions of the required Nyquist projections (Ny) of 0.05/0.10/0.25/0.50/0.75/1.00 (Ny$$$\,$$$=$$$\,$$$12,868, 4$$$\,$$$mm resolution). Each data set was reconstructed with and without Hamming filtering, which is often applied to increase SNR and to reduce Gibbs ringing artifacts.10,11
Results
The duration of the full simulation process depends on the size of the readout trajectory. For the presented data, the simulation took approximately 1-2$$$\,$$$min.
Unfiltered reconstructions of all presented data are displayed in Figure$$$\,$$$2. Ringing artifacts occur which are suppressed by application of the Hamming filter.
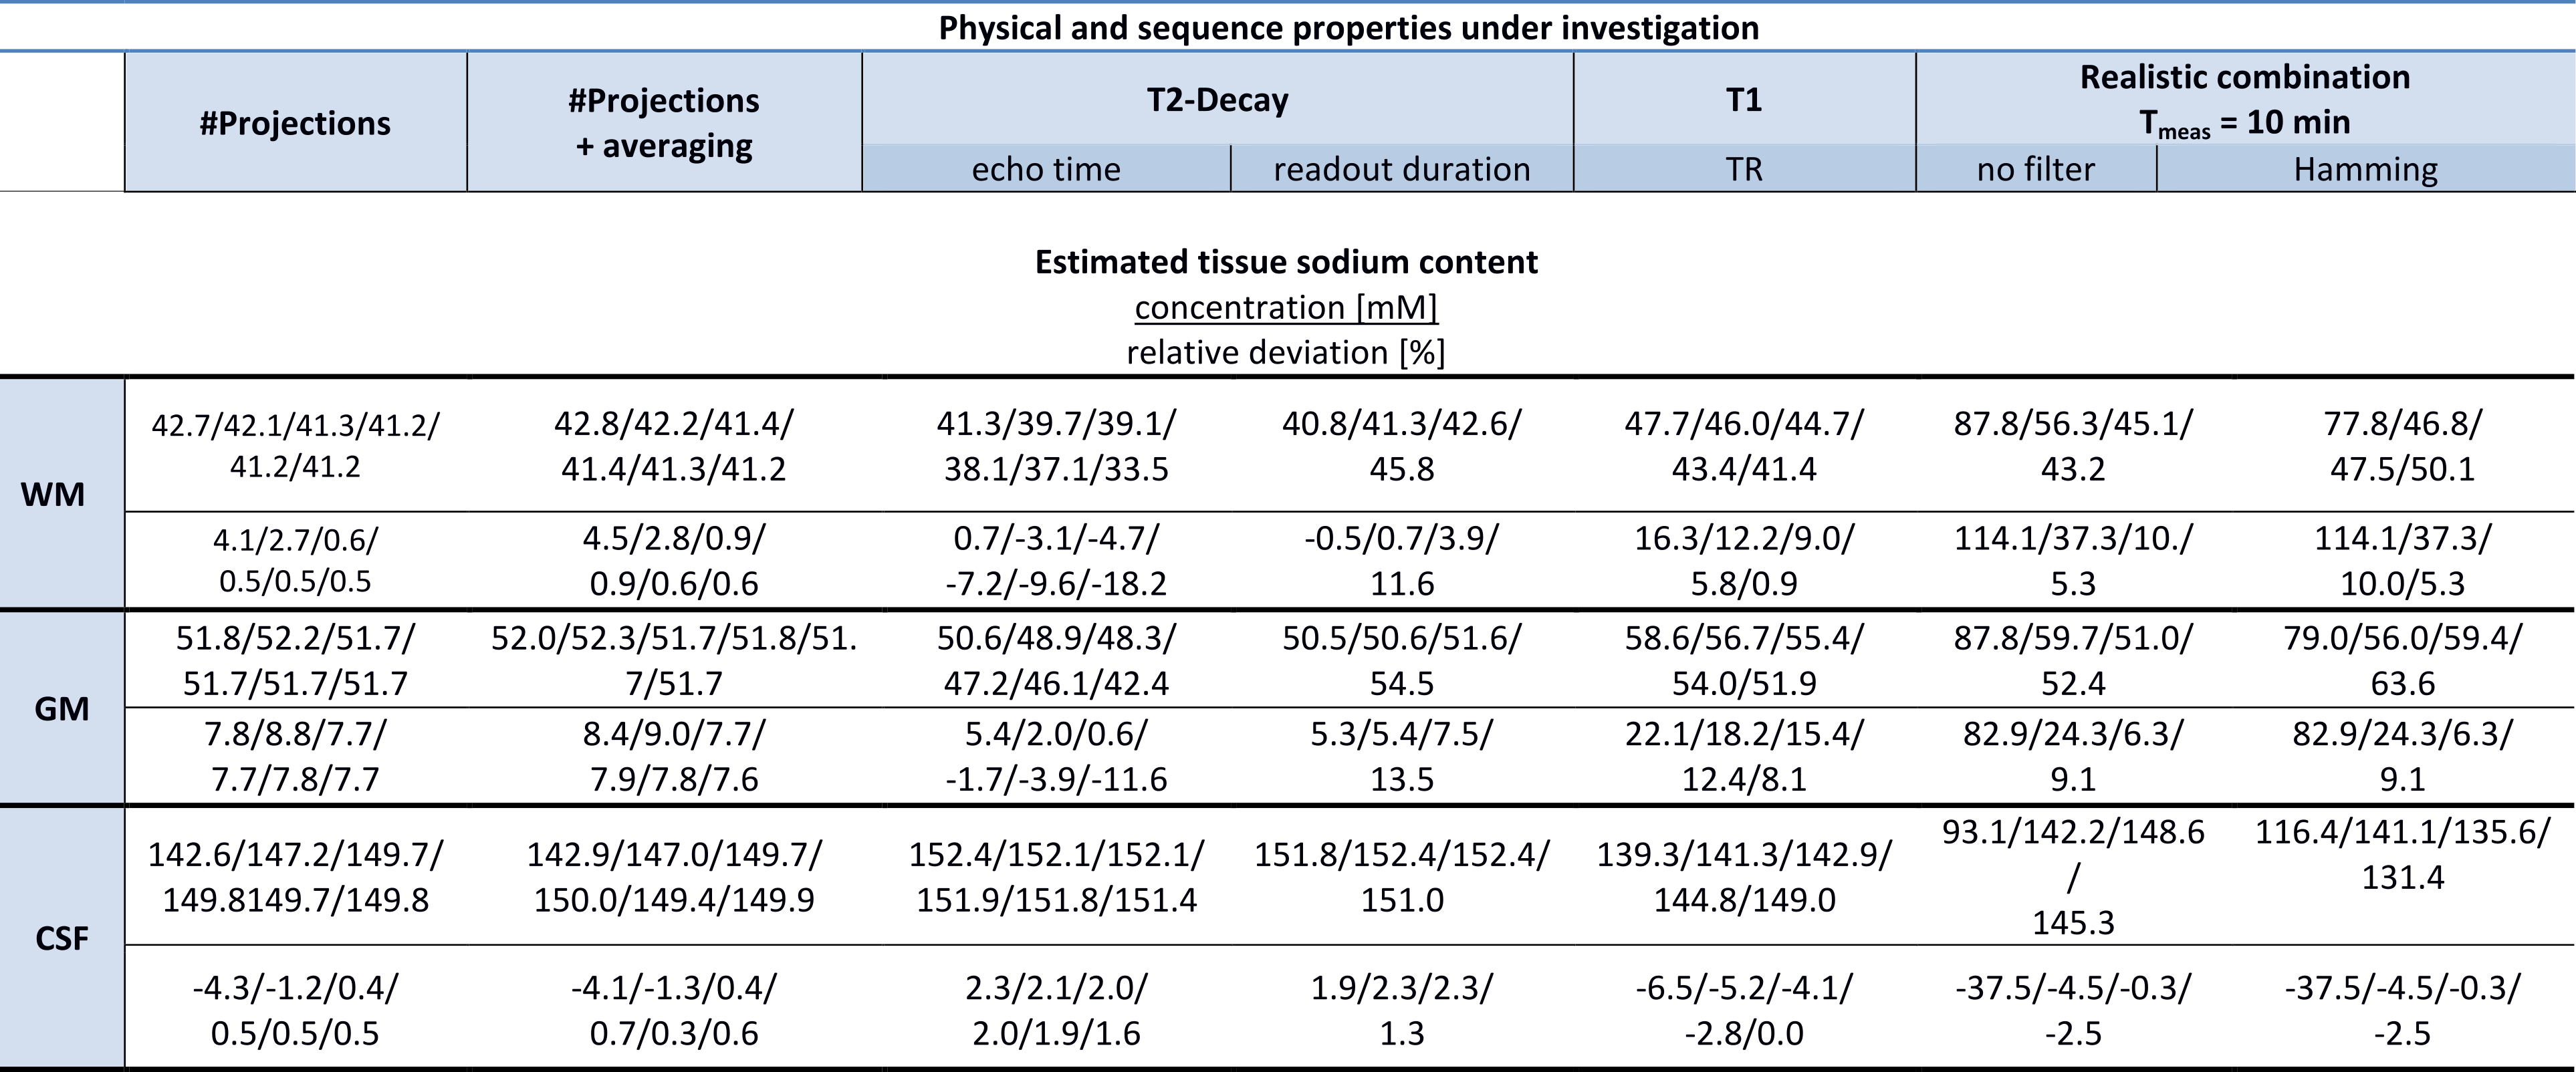
The accuracy of concentration quantification was determined by the relative deviation from true concentration (Figure$$$\,$$$3, Table$$$\,$$$2). GM is systematically overestimated (≈5$$$\,$$$%). Application of a Hamming filter results in overestimation of WM and GM and underestimation of CSF. For longer readout times the parenchyma is systematically overestimated, whereas the CSF does not show a pronounced dependence. A TR$$$\,$$$=$$$\,$$$120$$$\,$$$ms results in an overestimate of about 12$$$\,$$$% (for slow a relaxing reference) for parenchyma. Undersampling factors of up to 2-4 do not influence the quantification.
Discussion and Summary
Elevated GM concentration can be explained by partial volume effects from the neighboring CSF, which exhibits approximately 3-fold higher 23Na content. Therefore, reported concentration estimates for GM might be overestimated. We conclude that an undersampling factor of 2-4 is still acceptable in case of sufficient SNR. A nominal resolution of 3$$$\,$$$mm was determined to be a reasonable choice for this setup (7T). Variation of the readout time suggests a value of 10$$$\,$$$ms to be an acceptable tradeoff between SNR and T2*-induced signal blurring.
The presented simulations do not include true modeling of spin dynamics. Therefore, effects of refocusing or generally more complicated signal dynamics are not taken into account. For the application of 23Na, this is still an acceptable simplification since usually complicated excitation schemes are not employed for quantification experiments. After reconstruction, slight oscillations connected to the original 1H data are detectable. However, these are sufficiently smaller than the actual 23Na resolution.
The presented simulation tool allows for realistic modelling of 23Na MRI data with the possibility of a straightforward extension to other X-nuclei. It includes the most relevant tissue properties (spin density, T2*, T1). Noise can be added and scaled automatically depending on the sequence settings. Influences on quantitative parameter estimation can thereby be studied separately. The presented simulations can be further used to produce data for the testing and evaluation of quantitative reconstruction methods as well as to test for significance in clinical studies.
Acknowledgements
This work was funded in part by the Helmholtz Alliance ICEMED – Imaging and Curing Environmental Metabolic Diseases, through the Initiative and Networking Fund of the Helmholtz Association.References
1 Konstandin S and Schad L. 30 years of sodium/X-nuclei magnetic resonance imaging. Magnetic Resonance Materials in Physics, Biology and Medicine, Springer Berlin Heidelberg. 2014; 27: 1-4
2 Madelin G and Regatte RR. Biomedical applications of sodium MRI in vivo. Journal of Magnetic Resonance Imaging. 2013; 38: 511-529
3 Schepkin VD, Elumalai M, Kitchen JA, et al. In vivo chlorine and sodium MRI of rat brain at 21.1 T. Magnetic Resonance Materials in Physics, Biology and Medicine, Springer Berlin Heidelberg. 2014; 27: 63-70
4 Cocosco CA, Kollokian V., Kwan RK-S, et al. BrainWeb: Online Interface to a 3D MRI Simulated Brain Database. NeuroImage. 1997; 5(4): 425
5 Fessler JA, and Sutton BP. Nonuniform fast Fourier transforms using min-max interpolation. IEEE Transactions on Signal Processing. 2003; 51: 560-574
6 Nagel AM, Laun FB, Weber M-A, et al. Sodium MRI Using a Density-Adapted 3D Radial Acquisition Technique. Magnetic Resonance in Medicine. 2009; 62: 1565-1573
7 Niesporek SC, Hoffmann SH, Berger MC, et al. Partial volume correction for in vivo 23Na-MRI data of the human brain. NeuroImage. 2015; 112: 353-363
8 Nagel AM, Lehmann-Horn F, Weber M-A, et al. In Vivo 35Cl MR Imaging in Humans: A Feasibility Study. Radiology. 2014; 271: 585-595
9 Kurtz, Pape, Silbernagl. Physiologie. Thieme. 2014
10 Stobbe RW and Beaulieu C. Advantage of sampling density weighted apodization over postacquisition filtering apodization for sodium MRI of the human brain. Magnetic Resonance in Medicine. 2008; 60(4): 981–986
11 Konstandin S, Nagel AM. Performance of sampling density-weighted and postfiltered density-adapted projection reconstruction in sodium magnetic resonance imaging. Magnetic Resonance in Medicine. 2013; 69: 495-502
Figures