5626
Monitoring of cell proliferation by 19F-MRS via quantitation of 3'-deoxy-3'-fluorothymidine (FLT) and its monophosphate metabolite (FLT-MP) in invivo1Division of RI-Convergence Research, Korea Institute Radiological and Medical Sciences, Seoul, Korea, Republic of, 2Department of Nuclear Medicine, Korea Institute Radiological and Medical Sciences, Seoul, Korea, Republic of
Synopsis
Distinguishing between FLT(fluorothymidine) and FLT-MP(flruorothymidine - monophosphate) by imaging methods is important for evaluating the tumor cell proliferation rate. The aim of this study is to develop and validate a suitable 19F MR Spectroscopy for measuring TK1 activity via quantitation of FLT and FLT-MP in vivo. We observed the good correlations between SNR and FLT concentration (r2= 0.94). In phantom study, the locations of FLT and FLT-MP was -175.99, -175.24 ppm, respectively. In vivo study, FLT spectrum in mouse tumor was observed in 25 min after injection, whereas FLT-MP spectrum occurred in 90 min after injection. This result shows that 19F MR Spectroscopy is suitable for monitoring of FLT-MP generation in in vivo.
Introduction
The tumor cell proliferation is considered to be a useful prognostic indicator of tumor aggressiveness and response to therapy. Tumor cell lines that shows a high proliferation rate generally make high rates of DNA synthesis. It is possible to evaluate the progression level of the tumor cells, on the basis of the theory that the proliferation rate of tumor cells would increase during tumor progression. Thymidine analogue radiopharmaceuticals like [18F]fluorothymidine ([18F]FLT) has been shown to assess the level of tumor proliferation using Positron emission tomography (PET). Monophosphate metabolite of FLT(FLT-MP) is produced by the cytosolic enzyme thymidine kinase 1 (TK1) in the cell.1 The degree of FLT uptake and FLT-MP formation in specific tissues can reflect the level of cellular proliferation and be used as a biomarker to clarify the proliferative status of tumors. But it is hard to distinguish between [18F]FLT and [18F]FLT-MP metabolites by current imaging methods. The aim of this study is to develop and validate a suitable 19F MR Spectroscopy for measuring TK1 activity via quantitation of FLT and FLT-MP in vivo.Material and Methods
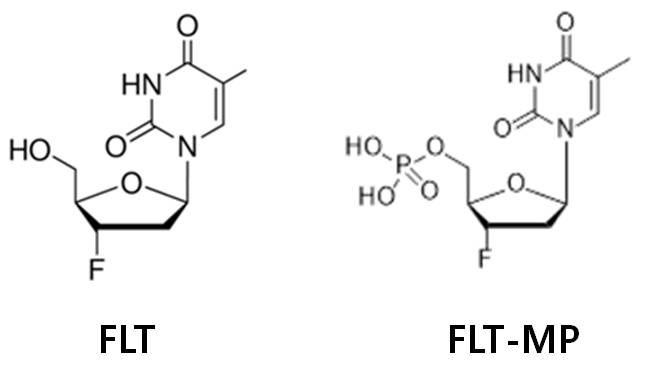
Phantoms & Animal: 3'-deoxy-3'-fluorothymidine (FLT) and 3'-deoxy-3'-fluorothymidine-5'-monophosphate disodium salt (FLT-MP) (Fig. 1) were purchased from FutureChem (Research Center FutureChem Co., Ltd, Seoul, Korea). A standard curve was generated by imaging phantoms that consisted of 100, 200 and 300 mM TFA dissolved in d-methanol. A female nude mouse (body weight: 25 g) bearing Walker 256 tumors were used. 1H MRI images and 19F MR spectroscopy were obtained after intravenous bolus injection of FLT (200 mM, 100 mL).
MRI: Imaging of the phantom and animal were performed using a 9.4T animal MRI system (Agilent, USA) with 19F/1H dual-tuned surface coil. 1H imaging parameters: Fast spin echo sequence, TR = 2500 ms, TE = 25 ms, matrix size: 256 × 256, FOV 5 × 5 cm, 2 mm thick, 0 mm gap. 19F imaging parameters: Gradient echo sequence, TR = 200 ms, TE = 4.0 ms, matrix size: 64 × 64, Images from 5 slices, FOV 5 × 5 cm, 2 mm thick, 0 mm gap. 19F MRS parameters: Point-resolved spectroscopy (PRESS), TR = 3000 ms, TE = 15 ms, 5 × 5 × 5 mm voxel, 512 averages, scan time = 25 min.
Results and Discussion
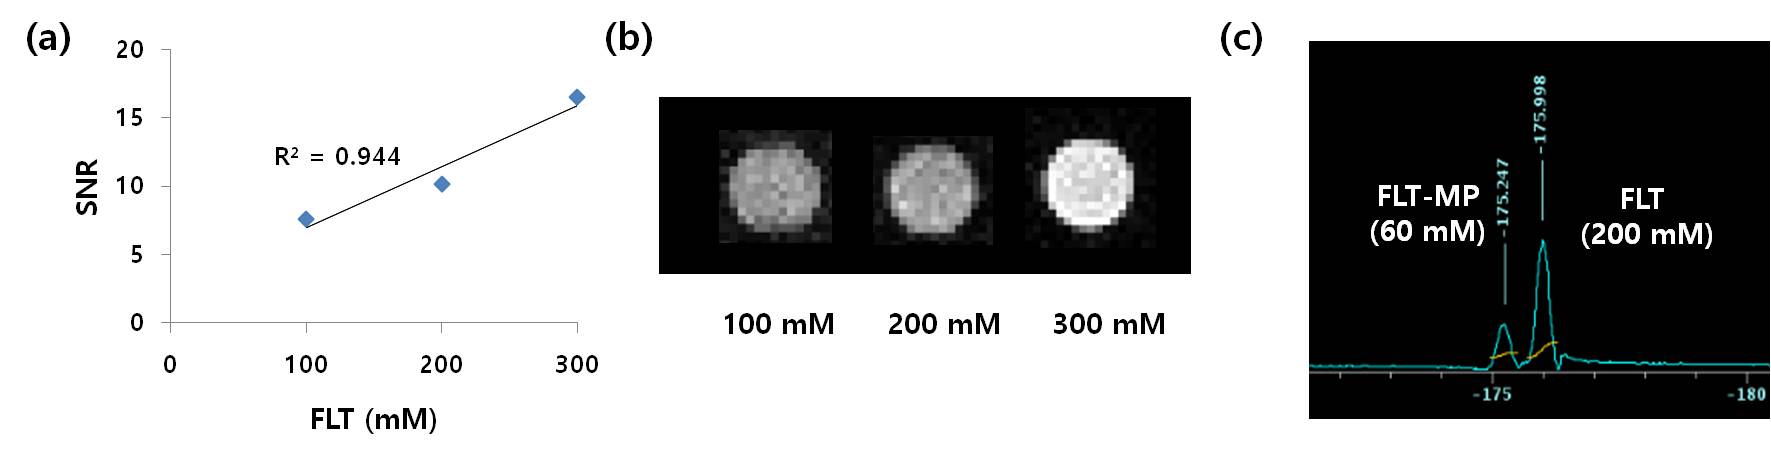
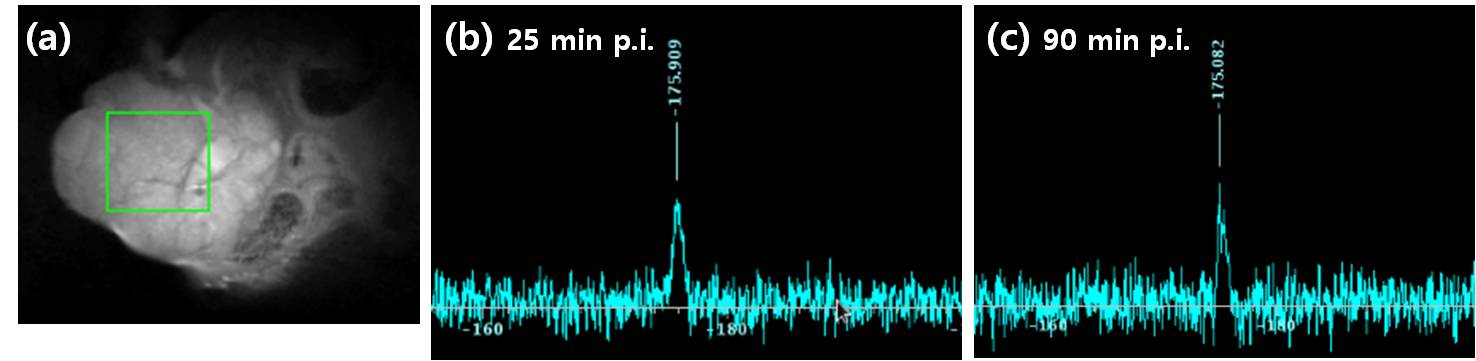
We observed liner relative signal intensity (R2 = 0.944) for 100, 200, and 300 mM FLT (Fig. 2). The locations of FLT (-175.99 ppm) and FLT-MP (-175.24 ppm) on the basis of TFA (-76.55 ppm) were observed in phantom study (Fig. 2c). In vivo signals, the production of the FLT-MP from FLT was obtained mainly in the tumor region (Fig. 3a). The 19F MR spectrums of 25 min and 90 min post injection (p.i.) with FLT were shown in Fig. 3b and 3c. The spectrum of 25 min p.i. was observed at -175.99 ppm which was corresponded with FLT, and the spectrum of 90 min p.i. was observed at -175.08 ppm which was corresponded with FLT-MP based on phantom study. This result demonstrates that 19F MR Spectroscopy is suitable for the purpose of in vivo monitoring of FLT-MP generation. This study may support the use of 19F MRI to clinically quantify and monitor the cellular proliferation of cancer and to assess the effectiveness of response to therapy.Acknowledgements
No acknowledgement found.References
1. Wei C, Timothy C, Nirav K, Nagichettiar S, Marvin B, Linda L, Paul M, Johannes C, Michael E. P, Daniel H.S. S, Imaging Proliferation in Brain Tumors with 18F-FLT PET: Comparison with 18F-FDG. J Nucl Med. 2005;46(6):945-952Figures