5625
Study of MR characteristics of anti-psychotic drugs using fluorine (19F) MR spectroscopy at 9.4 T1Hoglund Brain Imaging Center, University of Kansas Medical Center, Kansas City, KS, United States, 2Department of Neurology, University of Kansas Medical Center, Kansas City, KS, United States, 3Department of Molecular & Integrative Physiology, University of Kansas Medical Center, Kansas City, KS, United States, 4Division of Clinical Pharmacology, Toxicology, and Therapeutic Innovation, Children's Mercy Hospital, Kansas City, MO, United States, 5Department of Pediatrics, Children's Mercy Hospital, Kansas City, MO, United States
Synopsis
19F MRS allows assessment of fluorine containing anti-psychotic drugs in the brain. However, the reliable quantification remains challenging due to low drug concentrations and MR characteristics of the drugs are not well understood. This study aimed to characterize MR properties of four anti-psychotic drugs: pimozide, paliperidone, risperidone, and racemic fluoxetine, in phantoms at 9.4 T. Our results demonstrated that pimozide, paliperidone and risperidone showed over 50 ppm differences in chemical shifts and over 200 ms differences in T1 and T2 relaxation times compared with racemic fluoxetine. These different MR characteristics may have important implications for the 19F MRS technique development.
PURPOSE
19F MRS allows quantitative assessment of fluorine containing compounds, e.g., anti-psychotic drugs, in the living brain. The direct measurements of drug concentrations in the brain may provide important information about drug metabolism and in vivo effects on the target site, which could be closely associated with behavioral and psychiatric conditions. 1-9 However, reliable detection and quantification of the compounds using 19F MRS remains challenging due to low concentrations of these drugs in the brain and the low signal-to-noise ratio (SNR). In addition, MR characteristics of the major anti-psychotic drugs, such as T1 and T2 relaxations, have not been well described although the information is crucial for the development of 19F MRS techniques. For example, a few previous studies demonstrated MR measurements of drugs carrying a trifluoromethyl group only, such as fluphenazine, fluvoxamine, and fluoxetine. 1-9 The purpose of this study was to characterize MR properties (chemical shifts, T1 and T2 relaxations) of four most commonly prescribed anti-psychotic drugs, including pimozide, paliperidone, risperidone, and racemic fluoxetine, in phantoms using localized 19F MRS at 9.4 T.METHODS
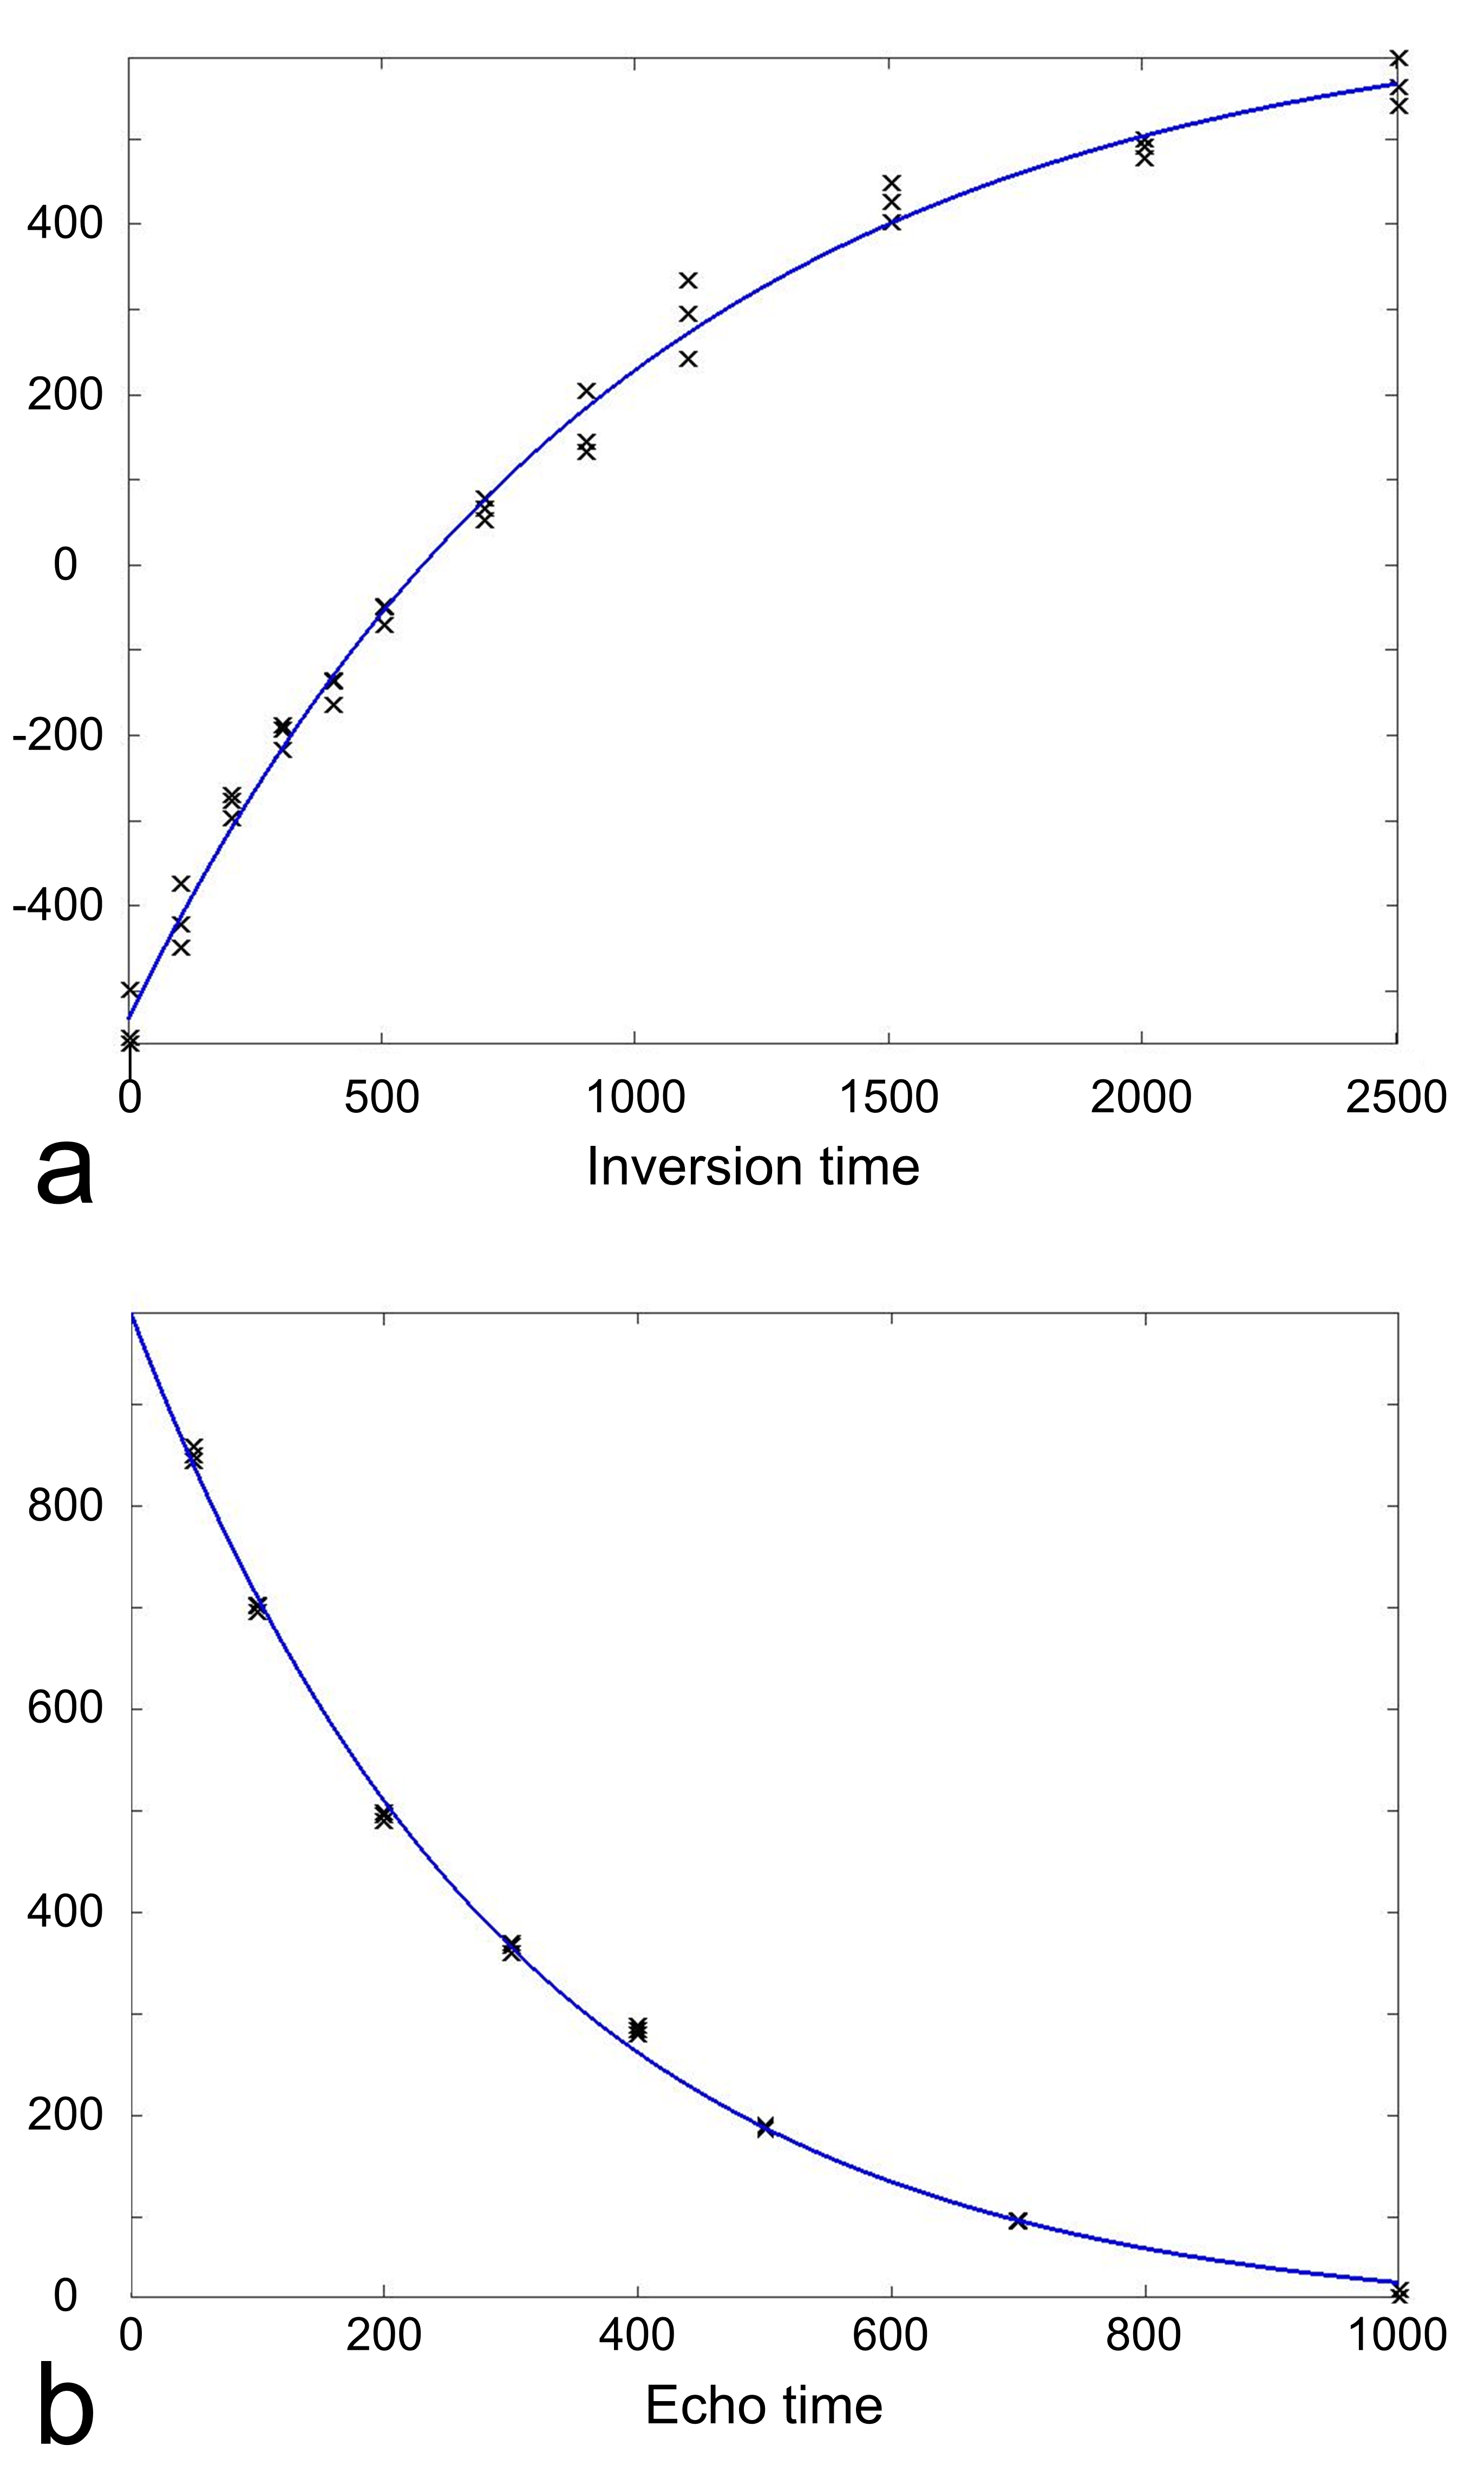
Four phantoms containing pimozide, paliperidone, risperidone, and racemic fluoxetine (1 mM each) dissolved in dimethylsulfoxide (DMSO) were used for 19F MRS measurements at 376.5 MHz on a 9.4 T Varian (Agilent) scanner. The transmitter power was calibrated using a phantom containing 100 mM sodium fluoride. Shimming was performed on 1H MRS, and the shim values were applied to 19F MRS. The chemical shifts of these drugs were measured using a STEAM sequence with echo time (TE) = 6 ms, volume of interest (VOI) of 10×8×8 mm3, number of data point = 5000, and bandwidth (BW) = 5000 Hz. T1 relaxation times were measured using an inversion recovery sequence with the inversion times = 5, 105, 205, 305, 405, 505, 705, 905, 1105, 1505, 2005, and 2505 ms. T2 relaxation times were measured using a STEAM sequence with TE = 50, 100, 200, 300, 400, 500, 700, and 1000 ms, VOI = 10×8×8 mm3, number of data point = 2000, and BW = 2000 Hz. The spectral data were zero-padded into 15000 points and multiplied by a 62 Hz exponential filter. The signal was defined as the area under the spectral peak. The signals were fitted with exponential functions to measure T1 and T2 relaxation times (Fig. 1). T1 and T2 relaxation time measurements were repeated three times.RESULTS and DISCUSSION
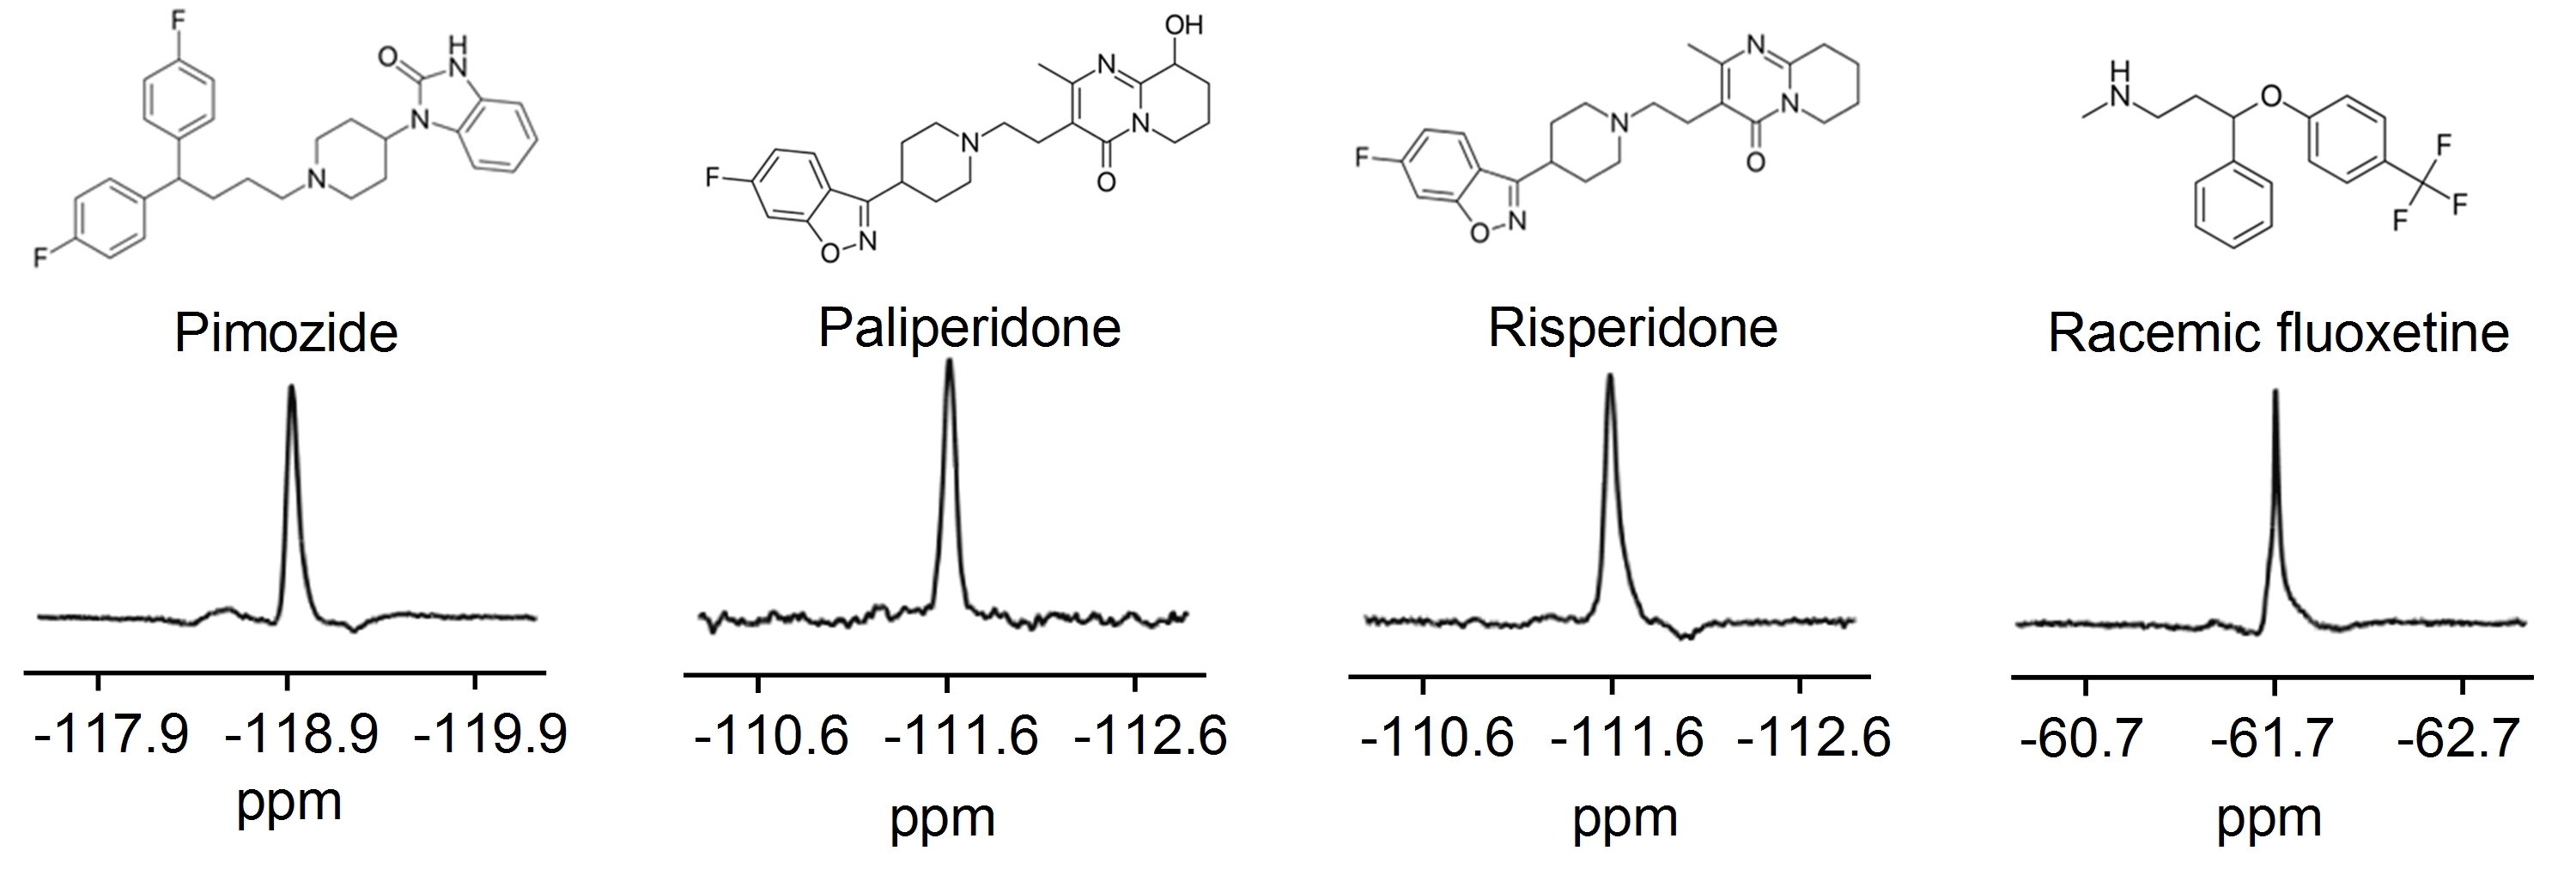
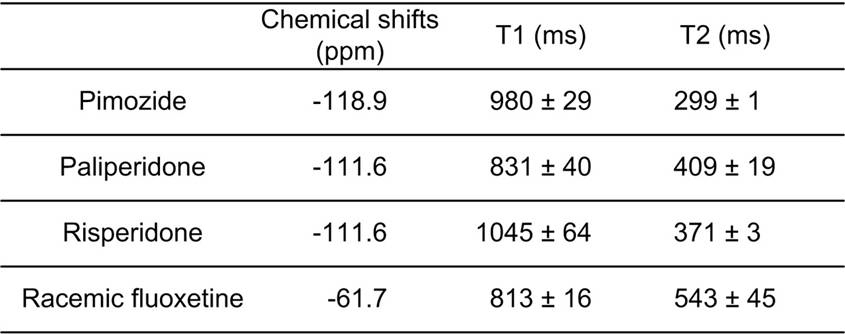
The chemical shift of pimozide was 7 ppm lower than the chemical shifts of paliperidone and risperidone, and was 57 ppm lower than that of racemic fluoxetine, which carries a trifluoromethyl group (Fig. 2 and Table 1). Among all the compounds, racemic fluoxetine showed the shortest T1 and the longest T2 relaxation times (Table 1). Conversely, pimozide showed the shortest T2 and a long T1 relaxation times. As paliperidone is the active metabolite of risperidone, both have similar chemical structures and identical chemical shifts. However, paliperidone showed a shorter T1 and a longer T2 relaxation times than risperidone.
Using 19F MRS, our results demonstrated that pimozide, paliperidone and risperidone showed over 50 ppm differences in chemical shifts and over 200 ms differences in T1 and T2 relaxation times compared with the most studied drug, racemic fluoxetine. The differences in MR characteristics may have important implications for extending 19F MRS techniques to detect concentrations of pimozide, paliperidone, and risperidone in the brain. For example, the longer T1 and shorter T2 relaxation times of these three drugs may imply a relatively lower SNR of the 19F MRS signals compared with those of racemic fluoxetine with the same concentrations of fluorine. The measured T1 relaxation times of fluoxetine in the phantom was 813 ms, which was longer than those in the human brain (~150-400 ms). 7 The shorter T1 relaxations in humans may be related to bound and unbound states of parent compounds and metabolites of the drugs. 7,10 Because chemical shifts between parent compounds and metabolites can be indistinguishable in in vivo studies, 6 future phantom studies may include measurements of metabolites of each drug in order to better understand the relaxation mechanisms in the brain.
Acknowledgements
The Hoglund Brain Imaging Center is supported by the NIH (S10RR029577) and the Hoglund Family Foundation.References
[1]. Bartels et al., Psychiatry Res. (18), 197-201, 1986. [2]. Bartels et al., J Neural Transm Gen Sect. (99), 1-6, 1995. [3]. Bolo et al., Neuropsychopharmacology (23), 428-38, 2000. [4]. Henry et al., Am J Psychiatry (157), 1506-8, 2000. [5]. Henry et al., Neuropsychopharmacology (30), 1076-83, 2005. [6]. Karson et al., Psychiatry Res. (45), 95-104, 1992. [7]. Komoroski et al., MRM (31), 204-11, 1994. [8]. Renshaw et al., Am J Psychiatry (149), 1592-4, 1992. [9]. Strauss et al., Am J Psychiatry (154), 516-22, 1997. [10]. Strauss et al., Biol Psychiatry (49), 798-802, 2001.Figures