5620
NMR and MRS studies of the neurotoxic oligomer of α-Synuclein toward investigating its in vivo structure1Department of Structural BioImaging, Faculty of Life Sciences, Kumamoto University, Kumamoto, Japan
Synopsis
α-Synuclein (α-Syn) is an abundant protein in neurons, and changes to a neurotoxic α-helical oligomer in vitro. The goal of our study is to investigate the structure of the α-Syn oligomer in vivo, by delivering 13C-labeled α-Syn into mouse brains and performing a 13C CEST experiment. We report the MRS detection of the 13C signals of the α-Syn monomer in an agarose gel phantom, mimicking a physiological environment. We also report that the in vitro oligomerization rate of α-Syn varies, depending on buffer conditions. We envisage that the CEST effect will be detected by adjusting the oligomerization kinetics of α-Syn.
Introduction
α-Synuclein (α-Syn) is a 140-amino acid protein, and the major component of the Lewy bodies found in the brains of patients with Parkinson’s disease and Dementia with Lewy bodies. α-Syn changes from a monomer to a soluble oligomer. An in vitro study reported that an α-Syn oligomer adopts an α-helical structure and exhibits neurotoxicity [1]. However, the structure of the α-Syn oligomer occurring in vivo is unclear. An in-cell NMR study demonstrated that α-Syn delivered into neuronal cells exists as a disordered monomer [2]. The goal of our study is to investigate the in vivo structure of the α-Syn oligomer, by introducing 13C-labeled α-Syn into the brains of mice and detecting the 13C signals of the α-Syn oligomer by a 13C CEST (Chemical exchange saturation transfer) experiment [3] with a 13C cryogenic probe [4]. To perform the CEST experiment, the in vivo detection of the 13C signals from the α-Syn monomer is required. The intracellular concentration of α-Syn in neurons is 5 to 50 μM [5, 6]. To generate a phantom that mimics a physiological environment, an agarose gel can be used [7]. The efficiency of the CEST phenomenon from the oligomer to the monomer depends on the exchange rate between them. Previous reports on the in vitro oligomerization of α-Syn in Gly-NaOH, sodium phosphate, and Tris-HCl buffers described differences in the resulting final products [1, 8, 9], suggesting their different oligomerization kinetics.Purpose
We aimed to detect the 13C signals of α-Syn by an MRS experiment, using an agarose phantom that mimics a tissue environment. We also attempted the in vitro oligomerization of α-Syn in different buffer conditions, to examine whether the monomer-to-oligomer exchange of α-Syn can be controlled by changing the solvent conditions.Methods and Materials
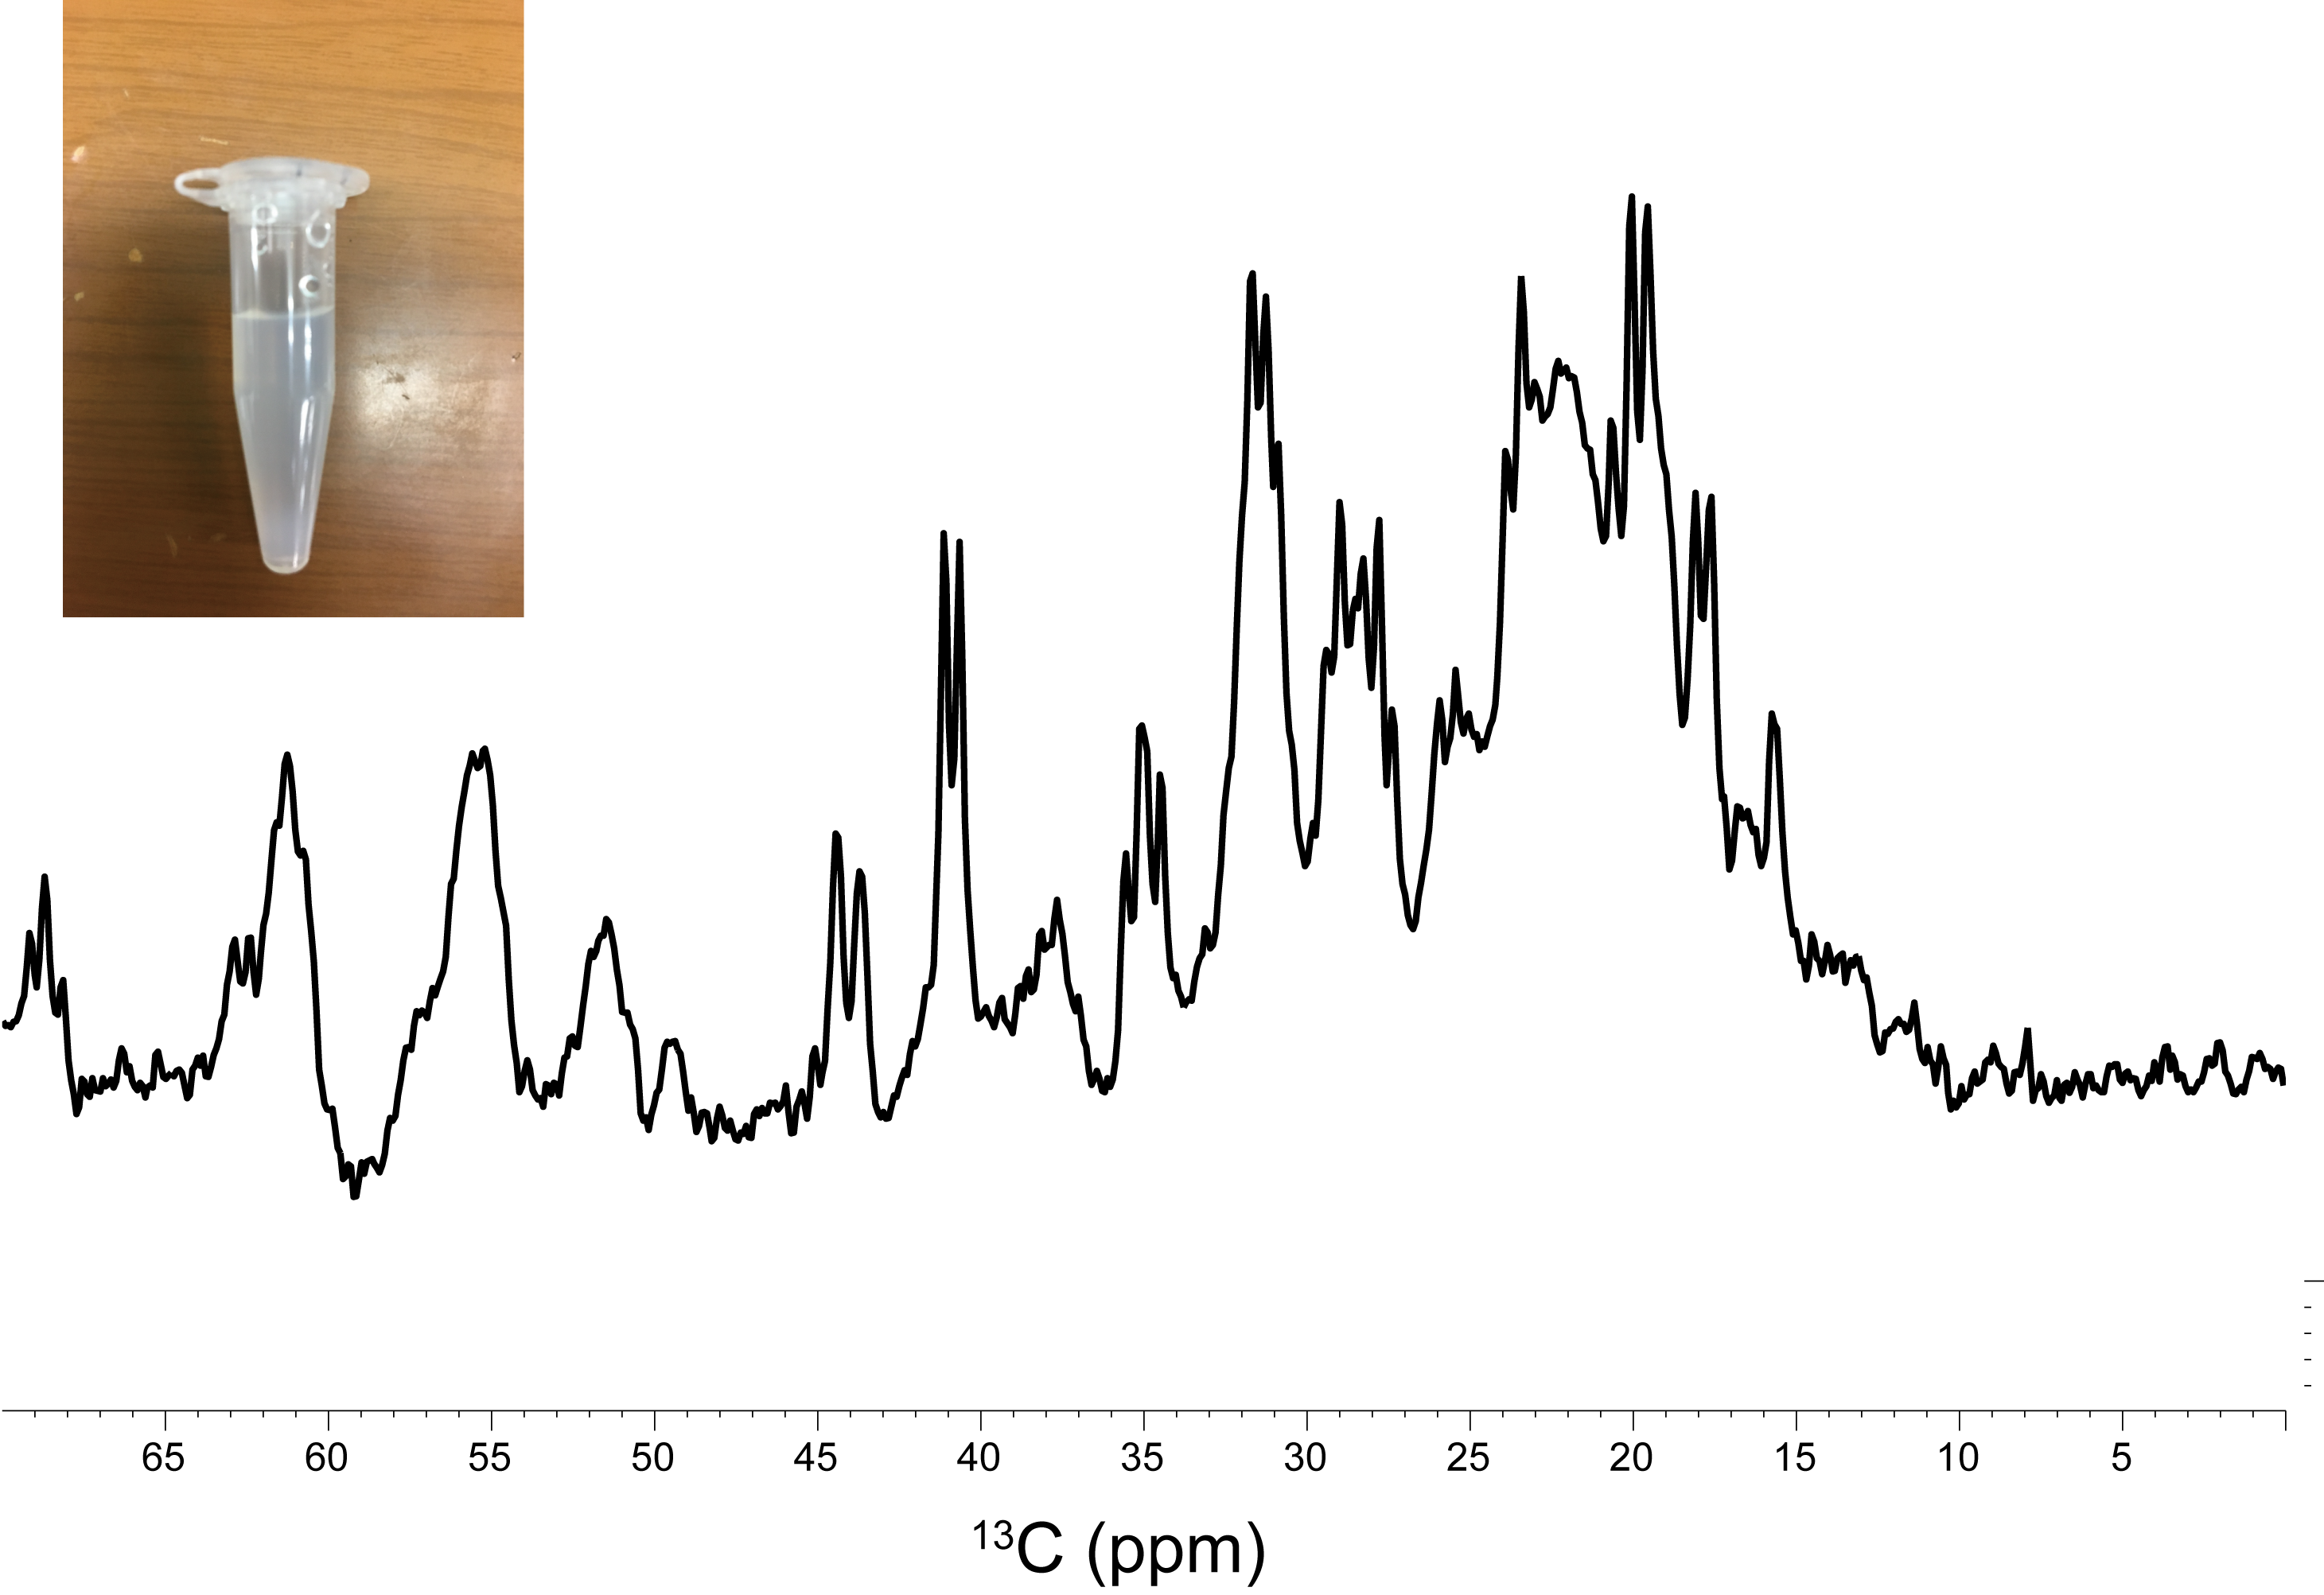
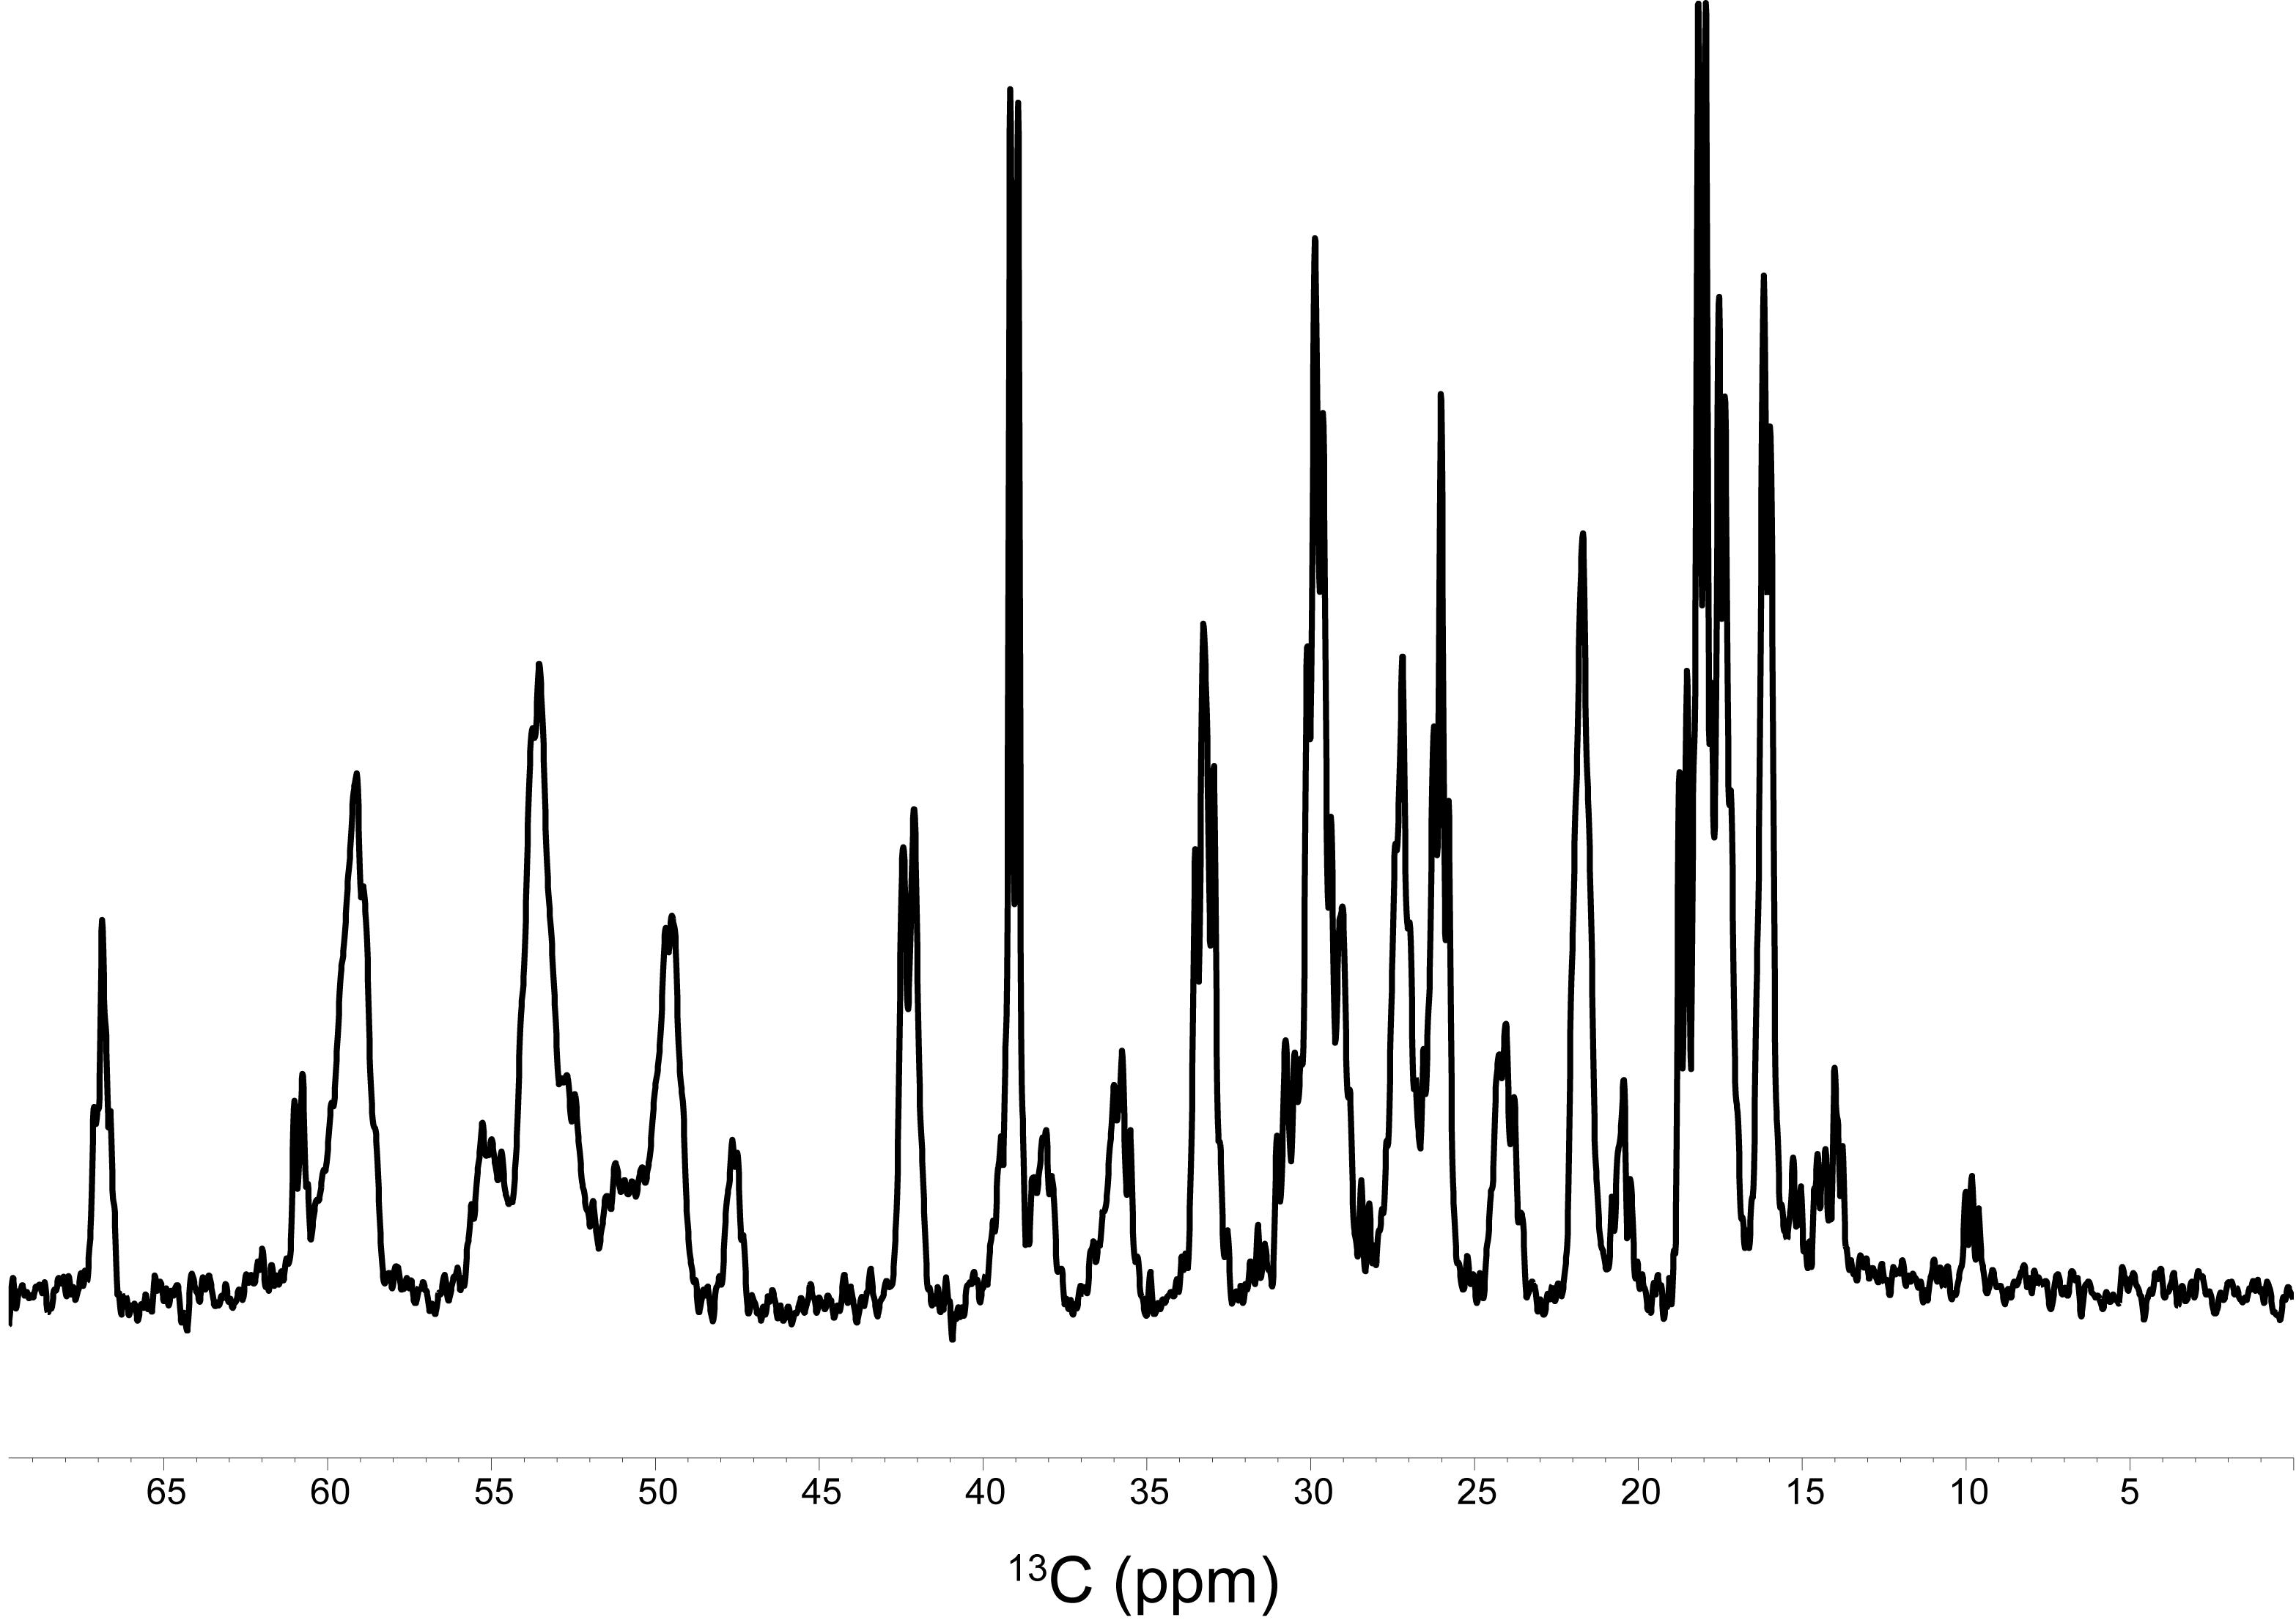
Uniformly 15N- and 13C/15N-labeled α-Syn samples were produced by an E. coli expression system. The agarose gel phantom was prepared by adding 10 mg agarose powder to 1.0 ml of 50 μM uniformly 13C/15N-labeled α-Syn solution, in 50 mM sodium phosphate buffer (pH 7.4) containing 0.02% sodium azide, dissolving it by heating to 100ºC, and then cooling and solidifying it in a 1.5 ml tube. The 13C MRS spectrum was acquired for the agarose phantom, using a 7.0T MRI scanner (Bruker BioSpec 70/20) equipped with a mouse brain 13C cryogenic probe (Bruker BioSpin) [4]. The 13C MRS measurements were performed without voxel selection (acquisition time: 163 msec, number of averages: 4,096, TR: 1 sec). The in vitro oligomerization of α-Syn was performed using 0.3 mM U-15N-labeled α-Syn dissolved in three different buffers: (i) 20 mM Gly-NaOH (pH 7.4), (ii) 50 mM sodium phosphate (pH 7.4), and (iii) 50 mM Tris-HCl, 150 mM KCl (pH 7.5). The three α-Syn solutions were incubated at 37°C, with shaking at 50 rpm. 1H-15N HSQC spectra were recorded on the three samples at 0, 48 and 129 hr of incubation, using a 14.1T NMR machine (Bruker BioSpin).Results
The 13C signals of α-Syn were successfully detected by MRS after 1 hr of accumulation, using the agarose phantom (Fig. 1). For a comparison, the 13C NMR spectrum was recorded on the uniformly 13C/15N labeled sample, which exhibited an almost identical spectral pattern to that of the MRS experiment (Fig. 2). The rates of the oligomerization were significantly different in the in vitro oligomerization experiments. At 48 hr of incubation, almost all signals of α-Syn were broadened beyond detection in the Tris-HCl buffer, and those in the sodium phosphate buffer were broadened to some extent. At 129 hr of incubation, the signals of the C-terminal ~30 residues were detectable in the Gly-NaOH buffer, and a smaller number of signals were detected in the sodium phosphate buffer (Fig. 3). The distinct spectral changes upon the incubations suggested that their oligomer-to-monomer kinetics were different.Discussion
The intracellular half-life of α-Syn was reported to be ~50 hr [2]. As the 13C signals of α-Syn were detectable in the 1 hr experiment, the time-course of the α-Syn oligomerization can be monitored. The 13C signals derived from the α-Syn monomer serve as the target of observation in the 13C CEST experiment. These 13C signals can readily be assigned by a conventional solution NMR assignment method. However, many of the 13C signals of the protein overlap each other on the 13C 1D spectrum. To detect only the signals of interest, the use of a residue- and site-specific 13C labeling method is promising. As a future prospect, 13C-labeled α-Syn will be delivered into nerve cells, which will then be implanted into mouse brains for in vivo 13C MRS experiments.Acknowledgements
This work was supported in part by the Grant-in-Aid for Challenging Exploratory Research (JP16K15110) (to H.T.) from the Japan Society for the Promotion of Science.References
[1]Dhiman, G. et al., Sci. Rep. 5: 9228 (2015), [2]Theillet, F.X. et al., Nature 530: 45-50 (2016), [3]Vallurupalli, P. et al., J. Am. Chem. Soc. 134: 8148-61 (2012), [4]Sack, M. et al., NMR Biomed. 27: 709-15 (2014), [5]Iwai, A. et al., Neuron 14:467-75 (1995), [6]Wilhelm, B.G. et al., Science 344:1023-8 (2014), [7]Mitchell, M.D. et al., Magn. Reson. Imaging 4: 263-6 (1986), [8]Luc, B. et al., Nature commun. 4: 2575 (2013), [9]Kathryn, D.K. et al., Protein Expr. Purif. 48: 112-7 (2013)
Figures