5619
The effect of malonate, succinate, oxaloacetate and 2-deoxy-D-glucose on boar sperm metabolism using 13C MRS1Academic Unit of Radiology, University of Sheffield, Sheffield, United Kingdom, 2Academic Unit of Reproductive & Developmental Medicine, University of Sheffield, Sheffield, United Kingdom
Synopsis
One in five young men has poor semen quality, including low motility. Studying energy metabolism may provide better understanding of sperm motility. We acquired 13C Magnetic Resonance spectra of sperm incubated with 13C-glucose with different concentrations of inhibitors: malonate, oxaloacetate, succinate, and 2-deoxy-D-glucose. This study examined the effect of these inhibitors on sperm lactate production and vitality, with a secondary aim to observe Krebs cycle intermediates in the MR spectrum. Glucose signal significantly decreased with increasing oxaloacetate concentration. Malonate and oxaloacetate and 2DG significantly decreased in lactate production. These inhibitors did not lead to observable 13C labelled Krebs cycle intermediates.
Introduction
One in five young men has poor semen quality1, including low motility. An understanding of energy metabolism may play an important role in understanding male infertility. In order to understand sperm metabolism, we acquired 13C Magnetic Resonance (MR) spectra of sperm incubated with 13C labelled glucose with different concentrations of metabolic inhibitors. The inhibitors chosen were: malonate and oxaloacetate inhibitors for succinate dehydrogenase2; succinate, an inhibitor of α-ketoglutarate (αKG)3 and 2-deoxy-D-glucose(2DG) a competitive inhibitor with glucose4. This study examined the effect of these inhibitors on sperm lactate production and vitality, with a secondary aim to observe Krebs cycle intermediates in the MR spectrum.Methods
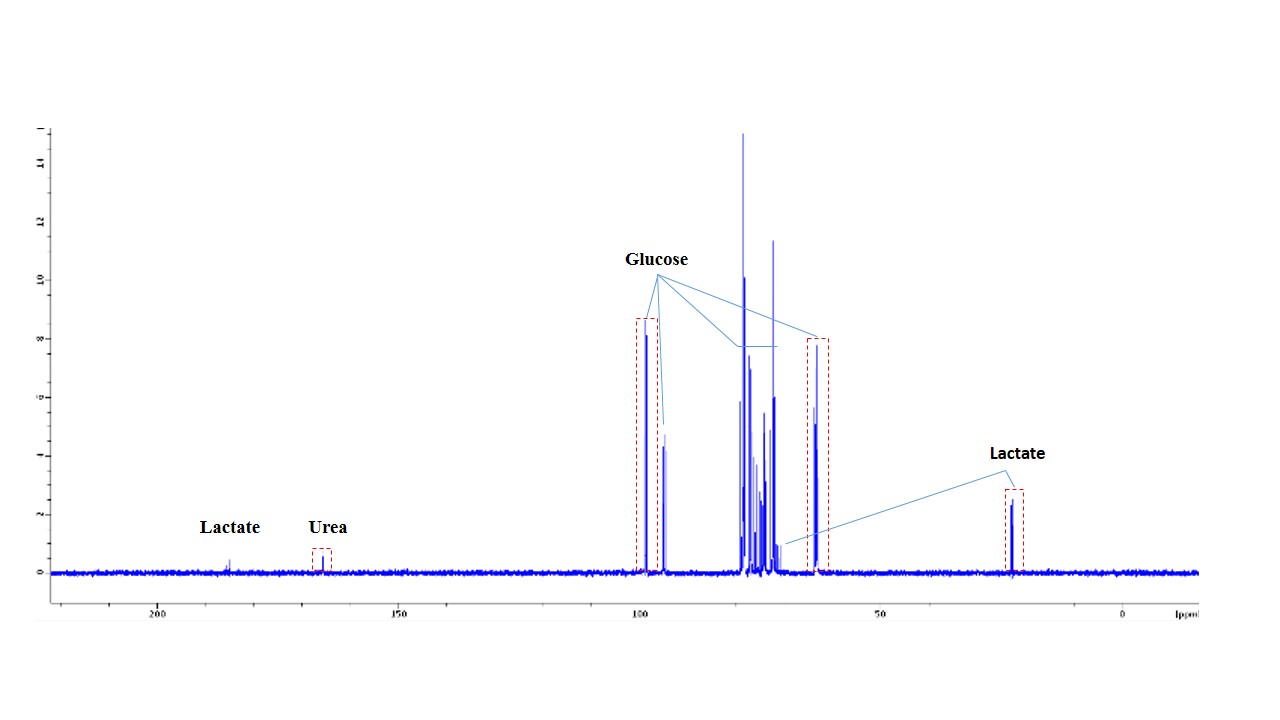
Boar sperm (n=3 ejaculates) were washed using a 30/70% Percoll density centrifugation method5. 60µl of 100mM 13Cu-glucose, 12µl penicillin/streptomycin was added to 100µl of sperm. Inhibitors were added with final concentrations of 3-500mM, with PBS added to maintain a constant volume (570µl). Control samples, without inhibitor, were also prepared. Samples were incubated in a water bath at 37oC for 18 hours and subsequently frozen at -80oC (without preservative). For MRS experiments, 570µl of thawed sample was added to a 5mm MR tube with 10µl of 200mM 13C urea (frequency/concentration reference), 10µl D2O and scanned using a 9.4T MR spectrometer with a 5mm BBO probe at 21°C. 13C spectra were acquired using a 13C{1H} inverse-gated pulse sequence (SW=239ppm, NS=4096, AQ=0.5s, TR=2s, flip angle=90°). Spectra were phase and baseline corrected using Bruker Topspin v2.1 software. Integral ranges for lactate, urea and glucose peaks were defined based on a control spectrum and applied to all spectra (Figure 1). Absolute lactate integrals only were normalized by sperm concentration. Sperm count, vitality and motility assays were carried out according to WHO guidelines6. Data analysis was performed using MATLAB and GraphPad PRISM 7. All glucose and lactate integrals were relative to their respective integrals in the control spectrum for each sample. Linear regression with Pearson correlation were applied to integrals versus log10(inhibitor concentration). One-way ANOVA was used for comparison of mean values of the counts and motilities. The significance value for all tests were p <0.05. Values quoted are mean±SD.Results
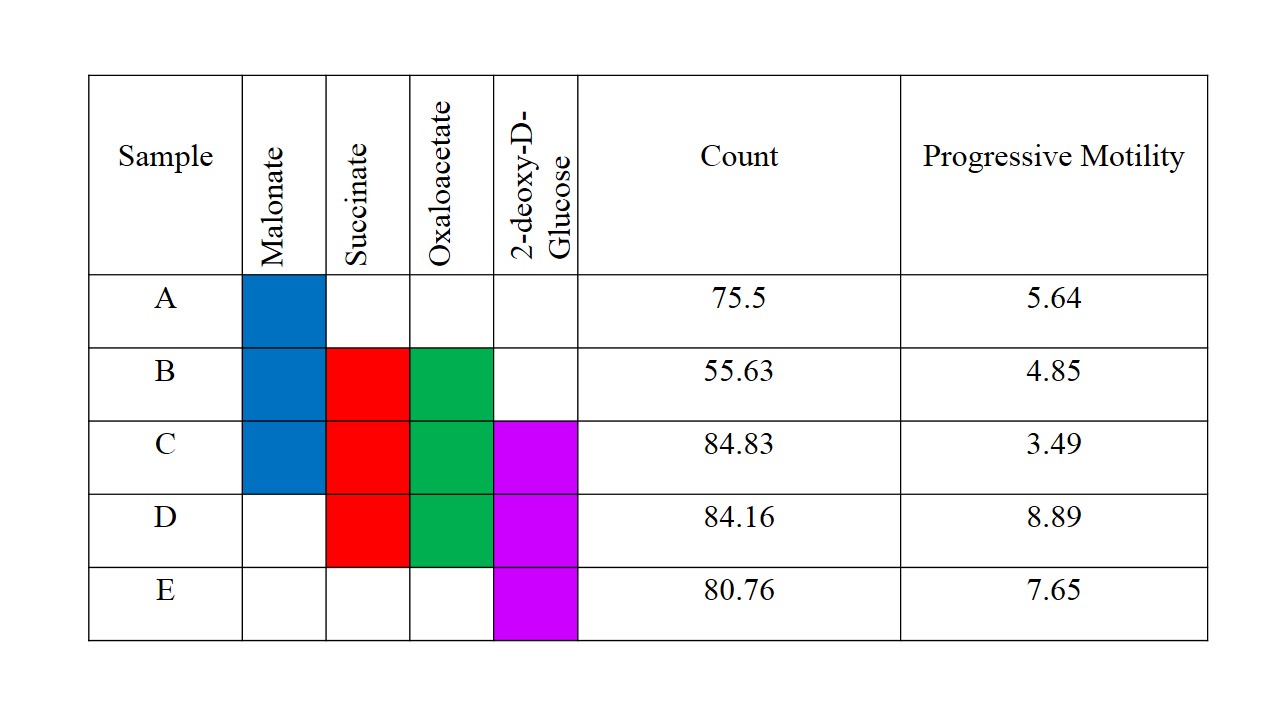
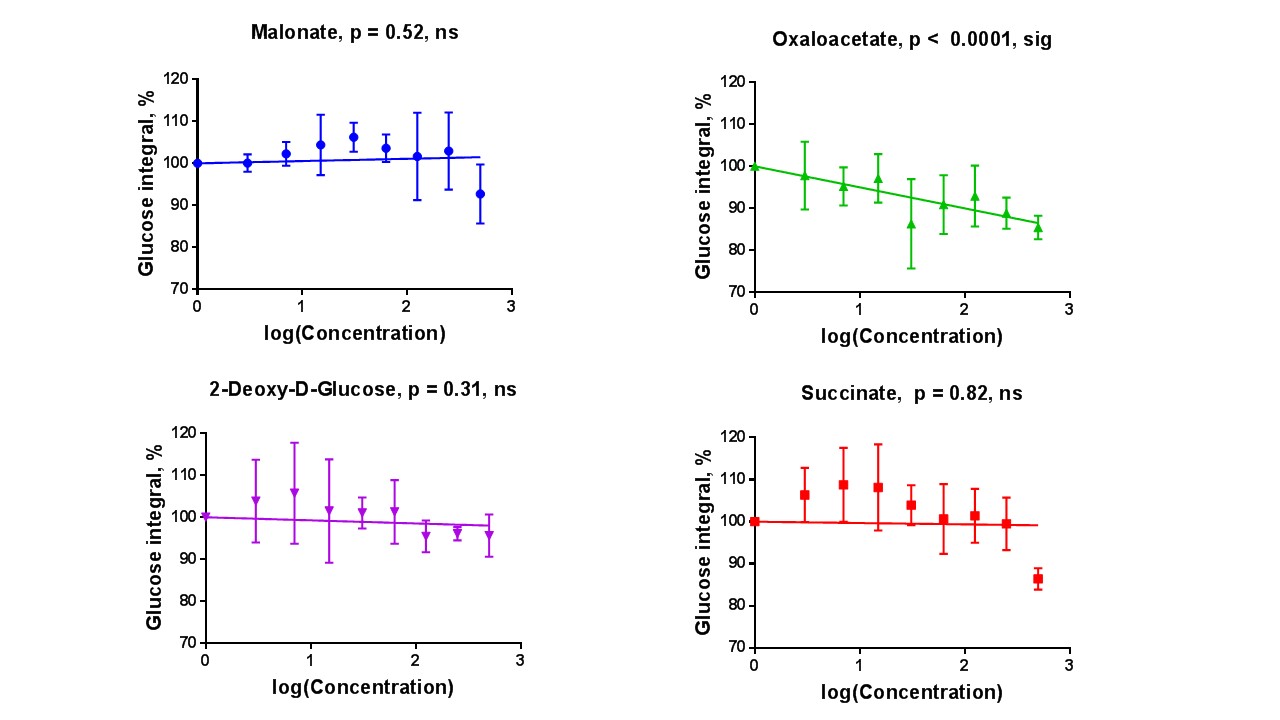
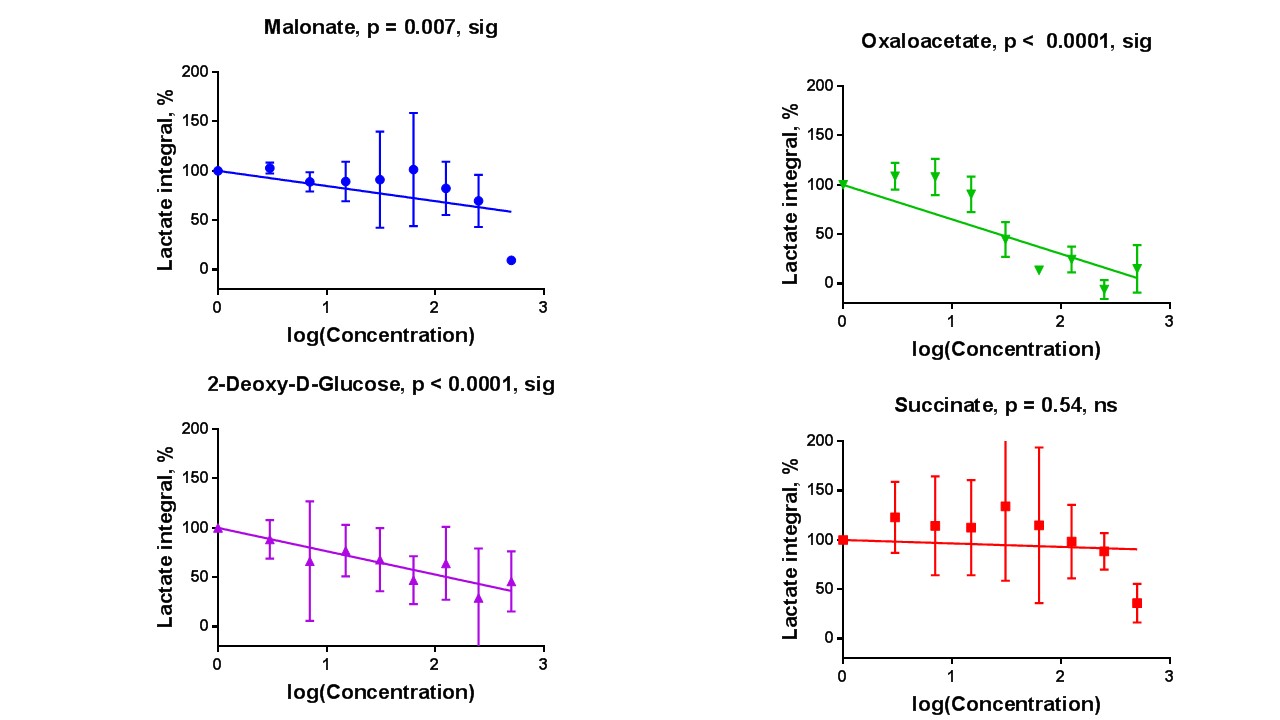
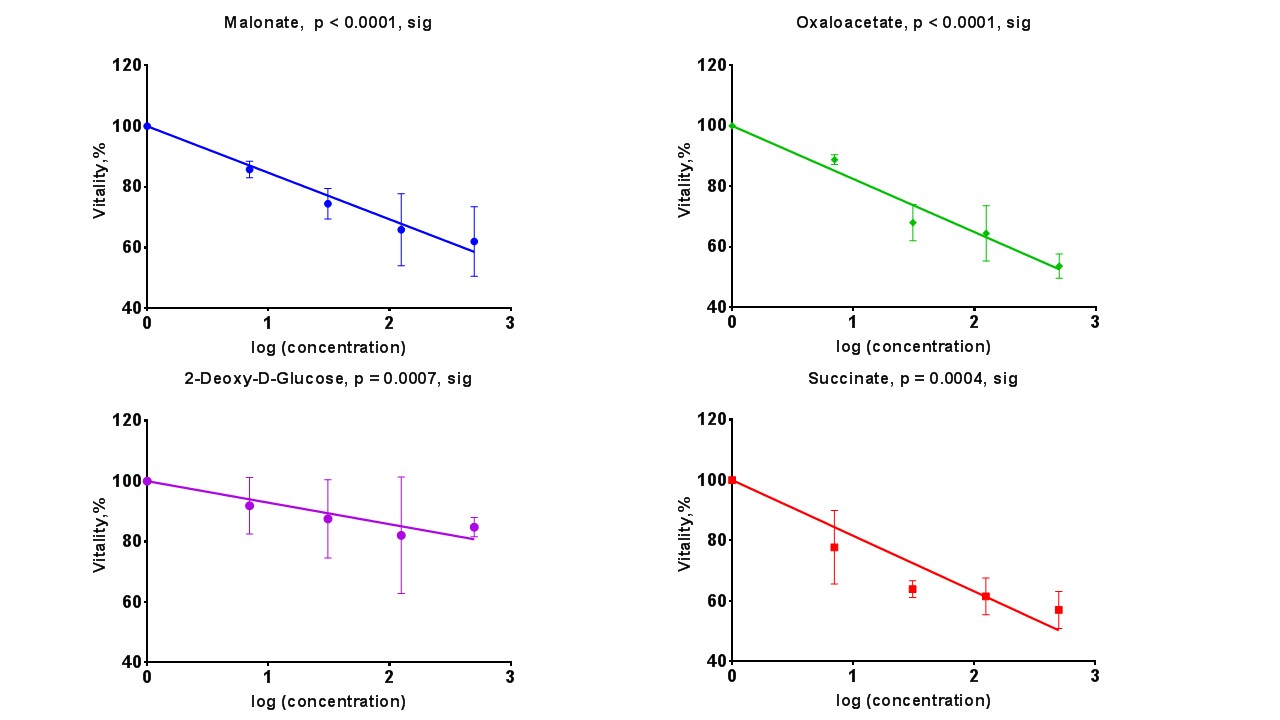
Sperm concentrations used for MRS experiments were 55.6-84.8x10⁶/ml with progressive motility between 3.5% and 8.9%(Table 1). Though the motility was low, there was no significant difference between sample counts and motilities (ANOVA) for the MRS experiments. There was no significant correlation for glucose integral versus inhibitor concentration for succinate, malonate and 2-deoxy-D-glucose (Figure 2). However, glucose significantly decreased with increasing oxaloacetate concentration. Increasing concentration of malonate caused the lactate integral and percentage vitality to decreased at a similar rate (lactate=15.3±0.6; vitality=15.4±4.3), suggesting that malonate had a toxic effect on sperm (Figure 3). Oxaloacetate had a similar effect on sperm vitality (slope=-17.6±0.9) as malonate (and succinate). However, oxaloacetate had the greatest rate of decrease in lactate signal (slope=-34.9±4.5), suggesting that, in addition to toxicity, there was an inhibitory effect. Sperm incubated with increasing 2DG concentration caused a decreased rate in lactate production that was in between that of malonate and oxaloacetate (2DG=-23±2). 2DG had the least toxicity effect on sperm vitality (slope=-7.1±0.7). Increasing concentration of succinate reduced sperm vitality comparable to malonate and oxaloacetate (slope=-18.4±1.6) (Figure 4). However, lactate integrals remained almost constant with increasing succinate concentration (slope=-3.6±5.5).Discussion
At the concentrations used, both malonate and oxaloacetate showed similar levels of toxicity to sperm that would result in decreased lactate production. However, oxaloacetate, caused the greatest rate of decline in lactate production with increasing inhibitor concentration. This suggests that oxaloacetate, a known inhibitor of succinate dehydrogenase in the Krebs cycle, interfered with the availability of cofactors which were responsible for the observed change in lactate rather than oxaloacetate acting directly on the glycolytic pathways, as 2DG does. The observed result for succinate was surprising as it would be expected that the lactate integral would decrease at a similar rate to the vitality. Whether succinate feeds directly into the Krebs cycle to promote lactate production requires further investigation7. The usage of these inhibitors (malonate, succinate and oxaloacetate) to block steps within the Krebs cycle did not lead to an accumulation of 13C labelled intermediates at the blocked enzymes. Glucose signal significantly decreased with increasing oxaloacetate concentration but did not lead to increased lactate. It would be expected the total 13C signal for remain constant at all concentration. It is possible that 13C-glucose was converted into labelled substrate below the level of detection. Further study, including DNP and mass spectrometry, would help to confirm these findings.Acknowledgements
1-Medical Research Council(MRC)
2-Ministry of Higher Education Malaysia
References
1. Kamel RM. Management of the infertile couple?: an evidence- based protocol. Reprod Biol Endocrinol. 2010;8(1):21.
2. Pardee A, Potter V. Inhibition of succinic dehydrogenase by oxalacetate. J Biol Chem. 1948.
3. Selak MA, Armour SM, MacKenzie ED, et al. Succinate links TCA cycle dysfunction to oncogenesis by inhibiting HIF-alpha prolyl hydroxylase. Cancer Cell. 2005;7(1):77-85.
4. Lahnsteiner F, Berger B, Weismann T. Sperm metabolism of the teleost fishes Chalcalburnus chalcoides and Oncorhynchus mykiss and its relation to motility and viability. J Exp Zool. 1999;284(4):454-465.
5. Lessley BA, Garner DL. Isolation of motile spermatozoa by density gradient centrifugation in Percoll®. Gamete Res. 1983;7(1):49-61.
6. World Health Organization (WHO). WHO laboratory manual for the Examination and processing of human semen. 2010;Fifth Edit:286.
Figures