5618
Comparison of direct 13C and indirect 1H-[13C] MR detection methods for the study of dynamic metabolic turnover in the human brain1MRRC, Yale University, New Haven, CT, United States
Synopsis
A wide range a direct 13C and indirect 1H-[13C] MR detection methods exist to probe dynamic metabolic pathways in the human brain. Choosing an optimal detection method is difficult as sequence-specific features regarding spectral resolution, power requirements and sensitivity complicate a straightforward comparison. Here we combine density matrix simulations with experimentally determined values for intrinsic 1H and 13C sensitivity, T1 and T2 relaxation and transmit efficiency to allow selection of an optimal 13C MR detection method for a given application and magnetic field.
Purpose
Carbon-13 (13C) MR spectroscopy (MRS) in combination with intravenous 13C-labeled substrate infusion is a powerful technique to dynamically study metabolic pathways non-invasively in vivo. A wide variety of direct 13C 1-5 and indirect 1H-[13C] 6-9 MR methods exist, each with unique characteristics on signal-to-noise ratio (SNR), spectral resolution and power requirements. Unfortunately, objective selection of an optimal detection scheme is complicated as each method has been described with specific RF coils, at different magnetic fields and with different spatial localization options. Here we present a uniform framework using density matrix simulations in combination with experimental values for intrinsic 1H and 13C sensitivities, spectral line widths and relaxation to achieve an objective evaluation of direct 13C and indirect 1H-[13C] MR detection methods at multiple magnetic fields.
Methods
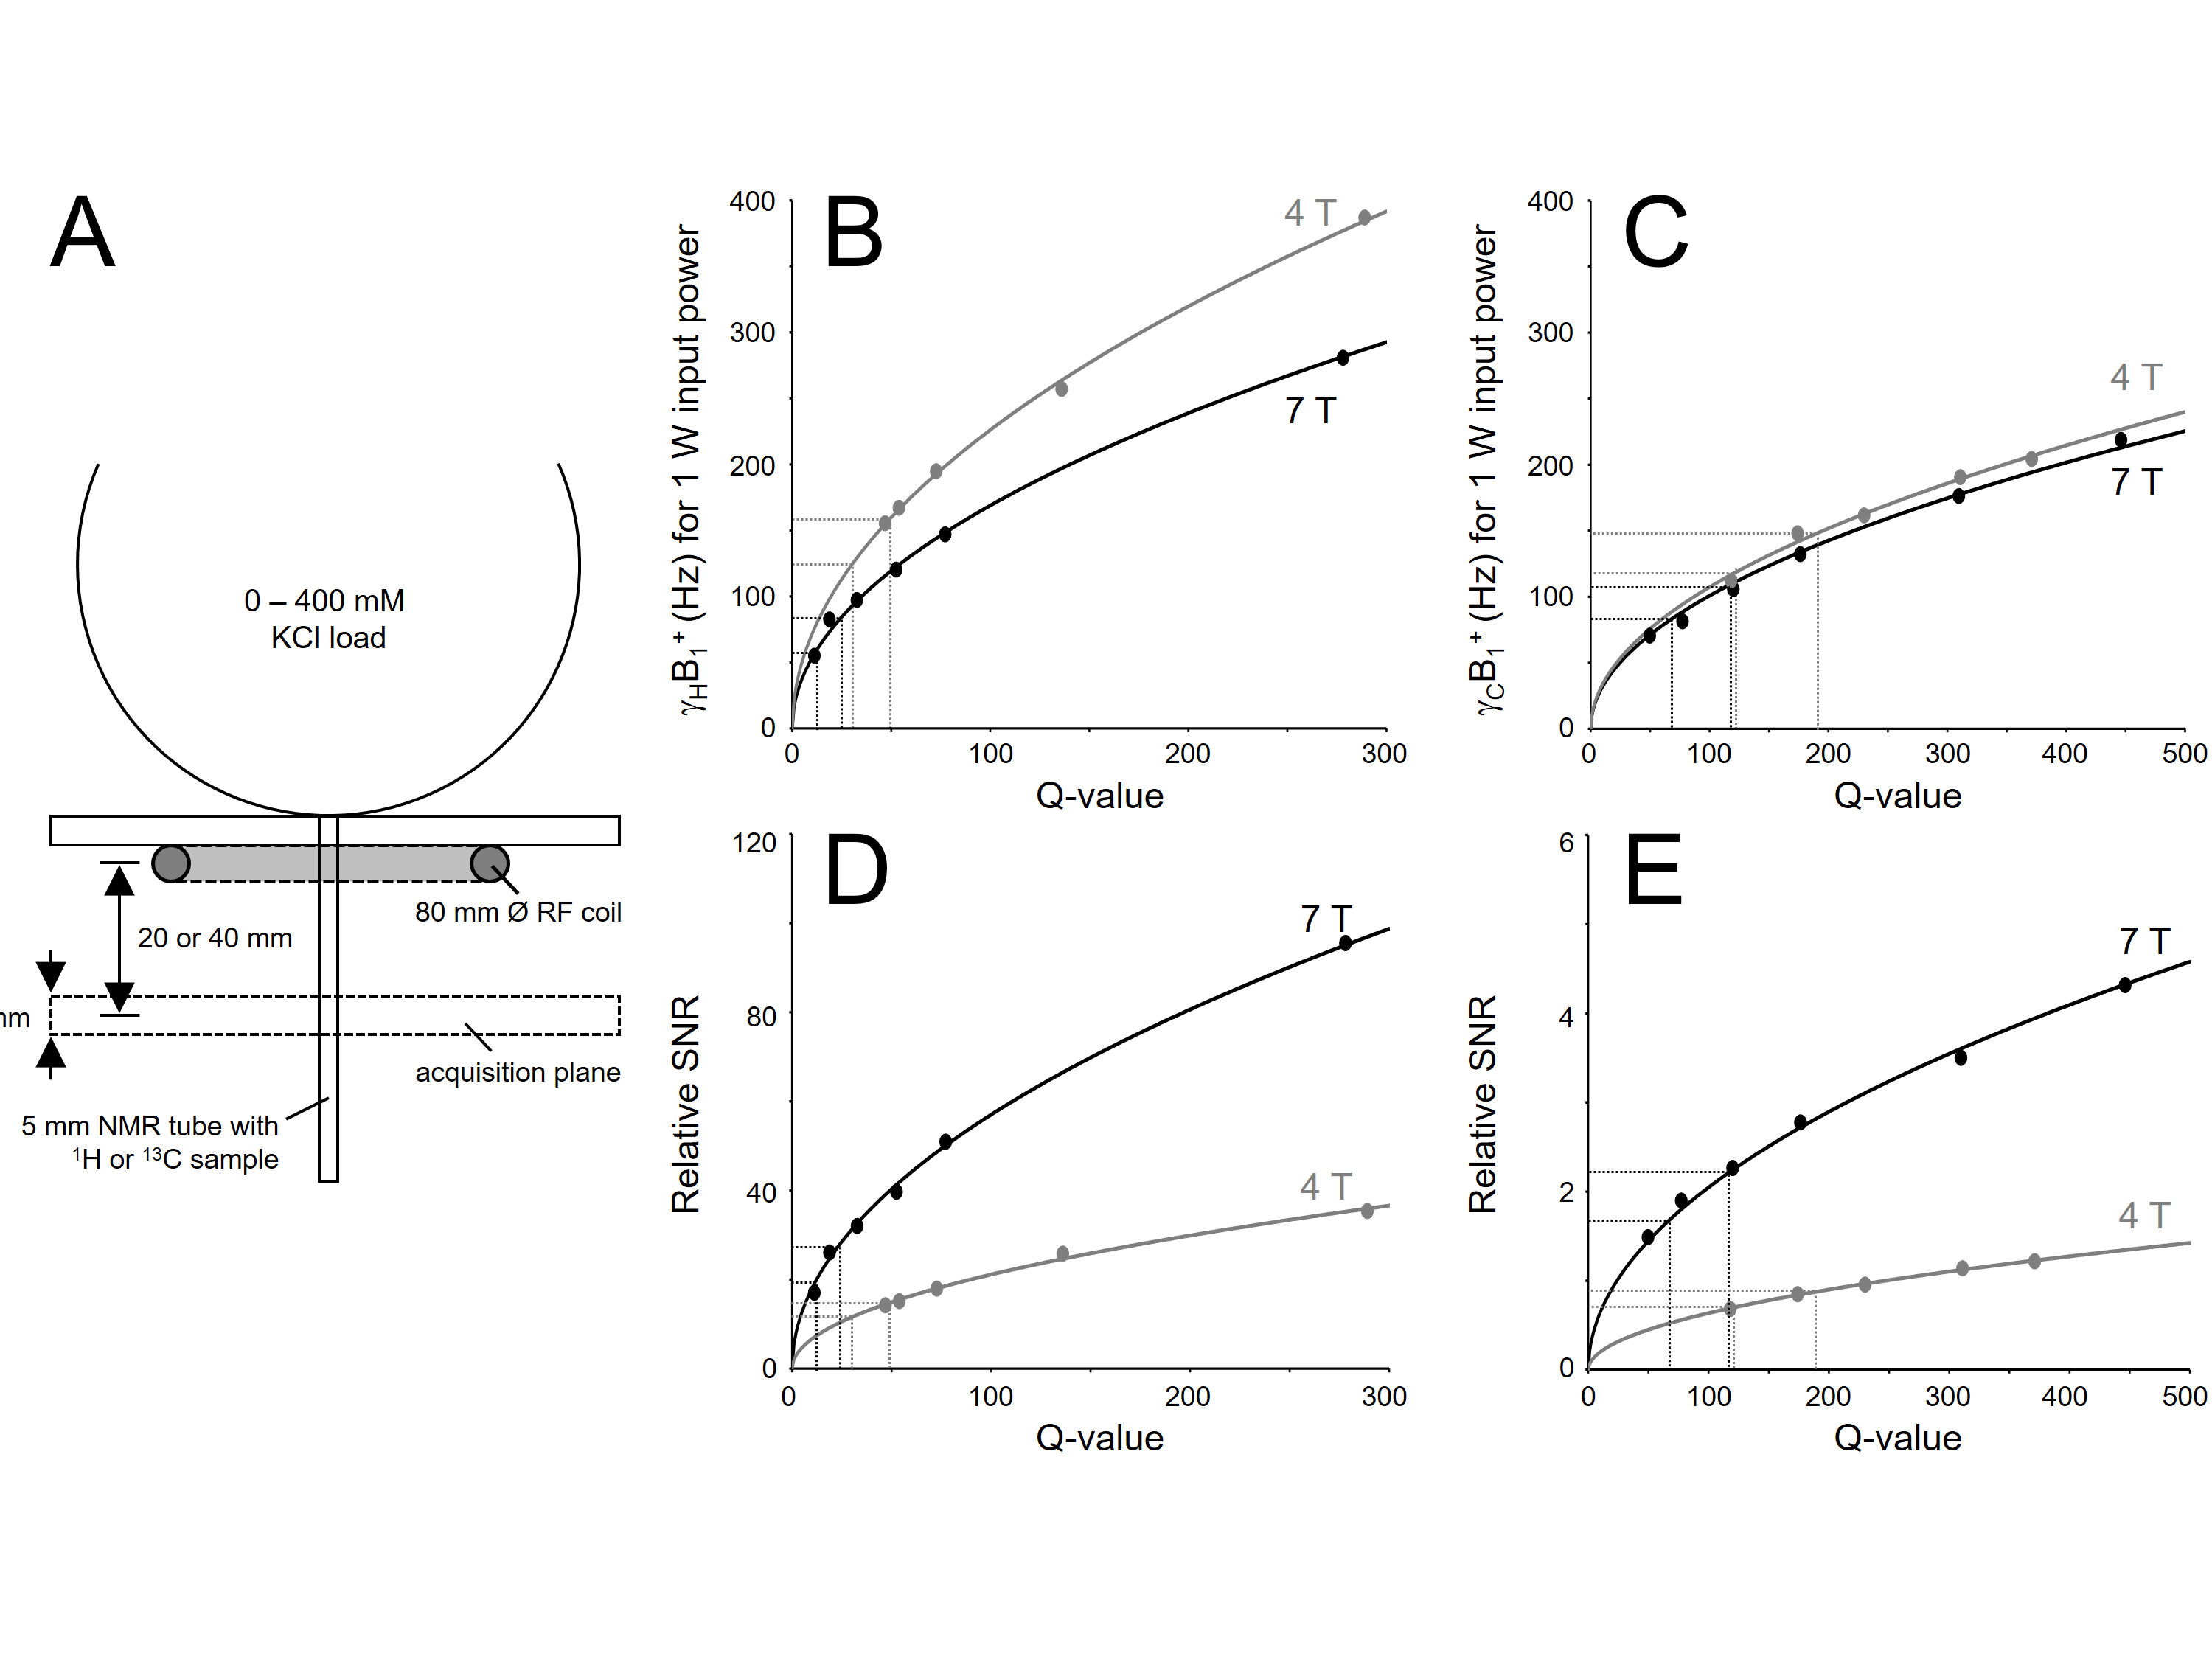
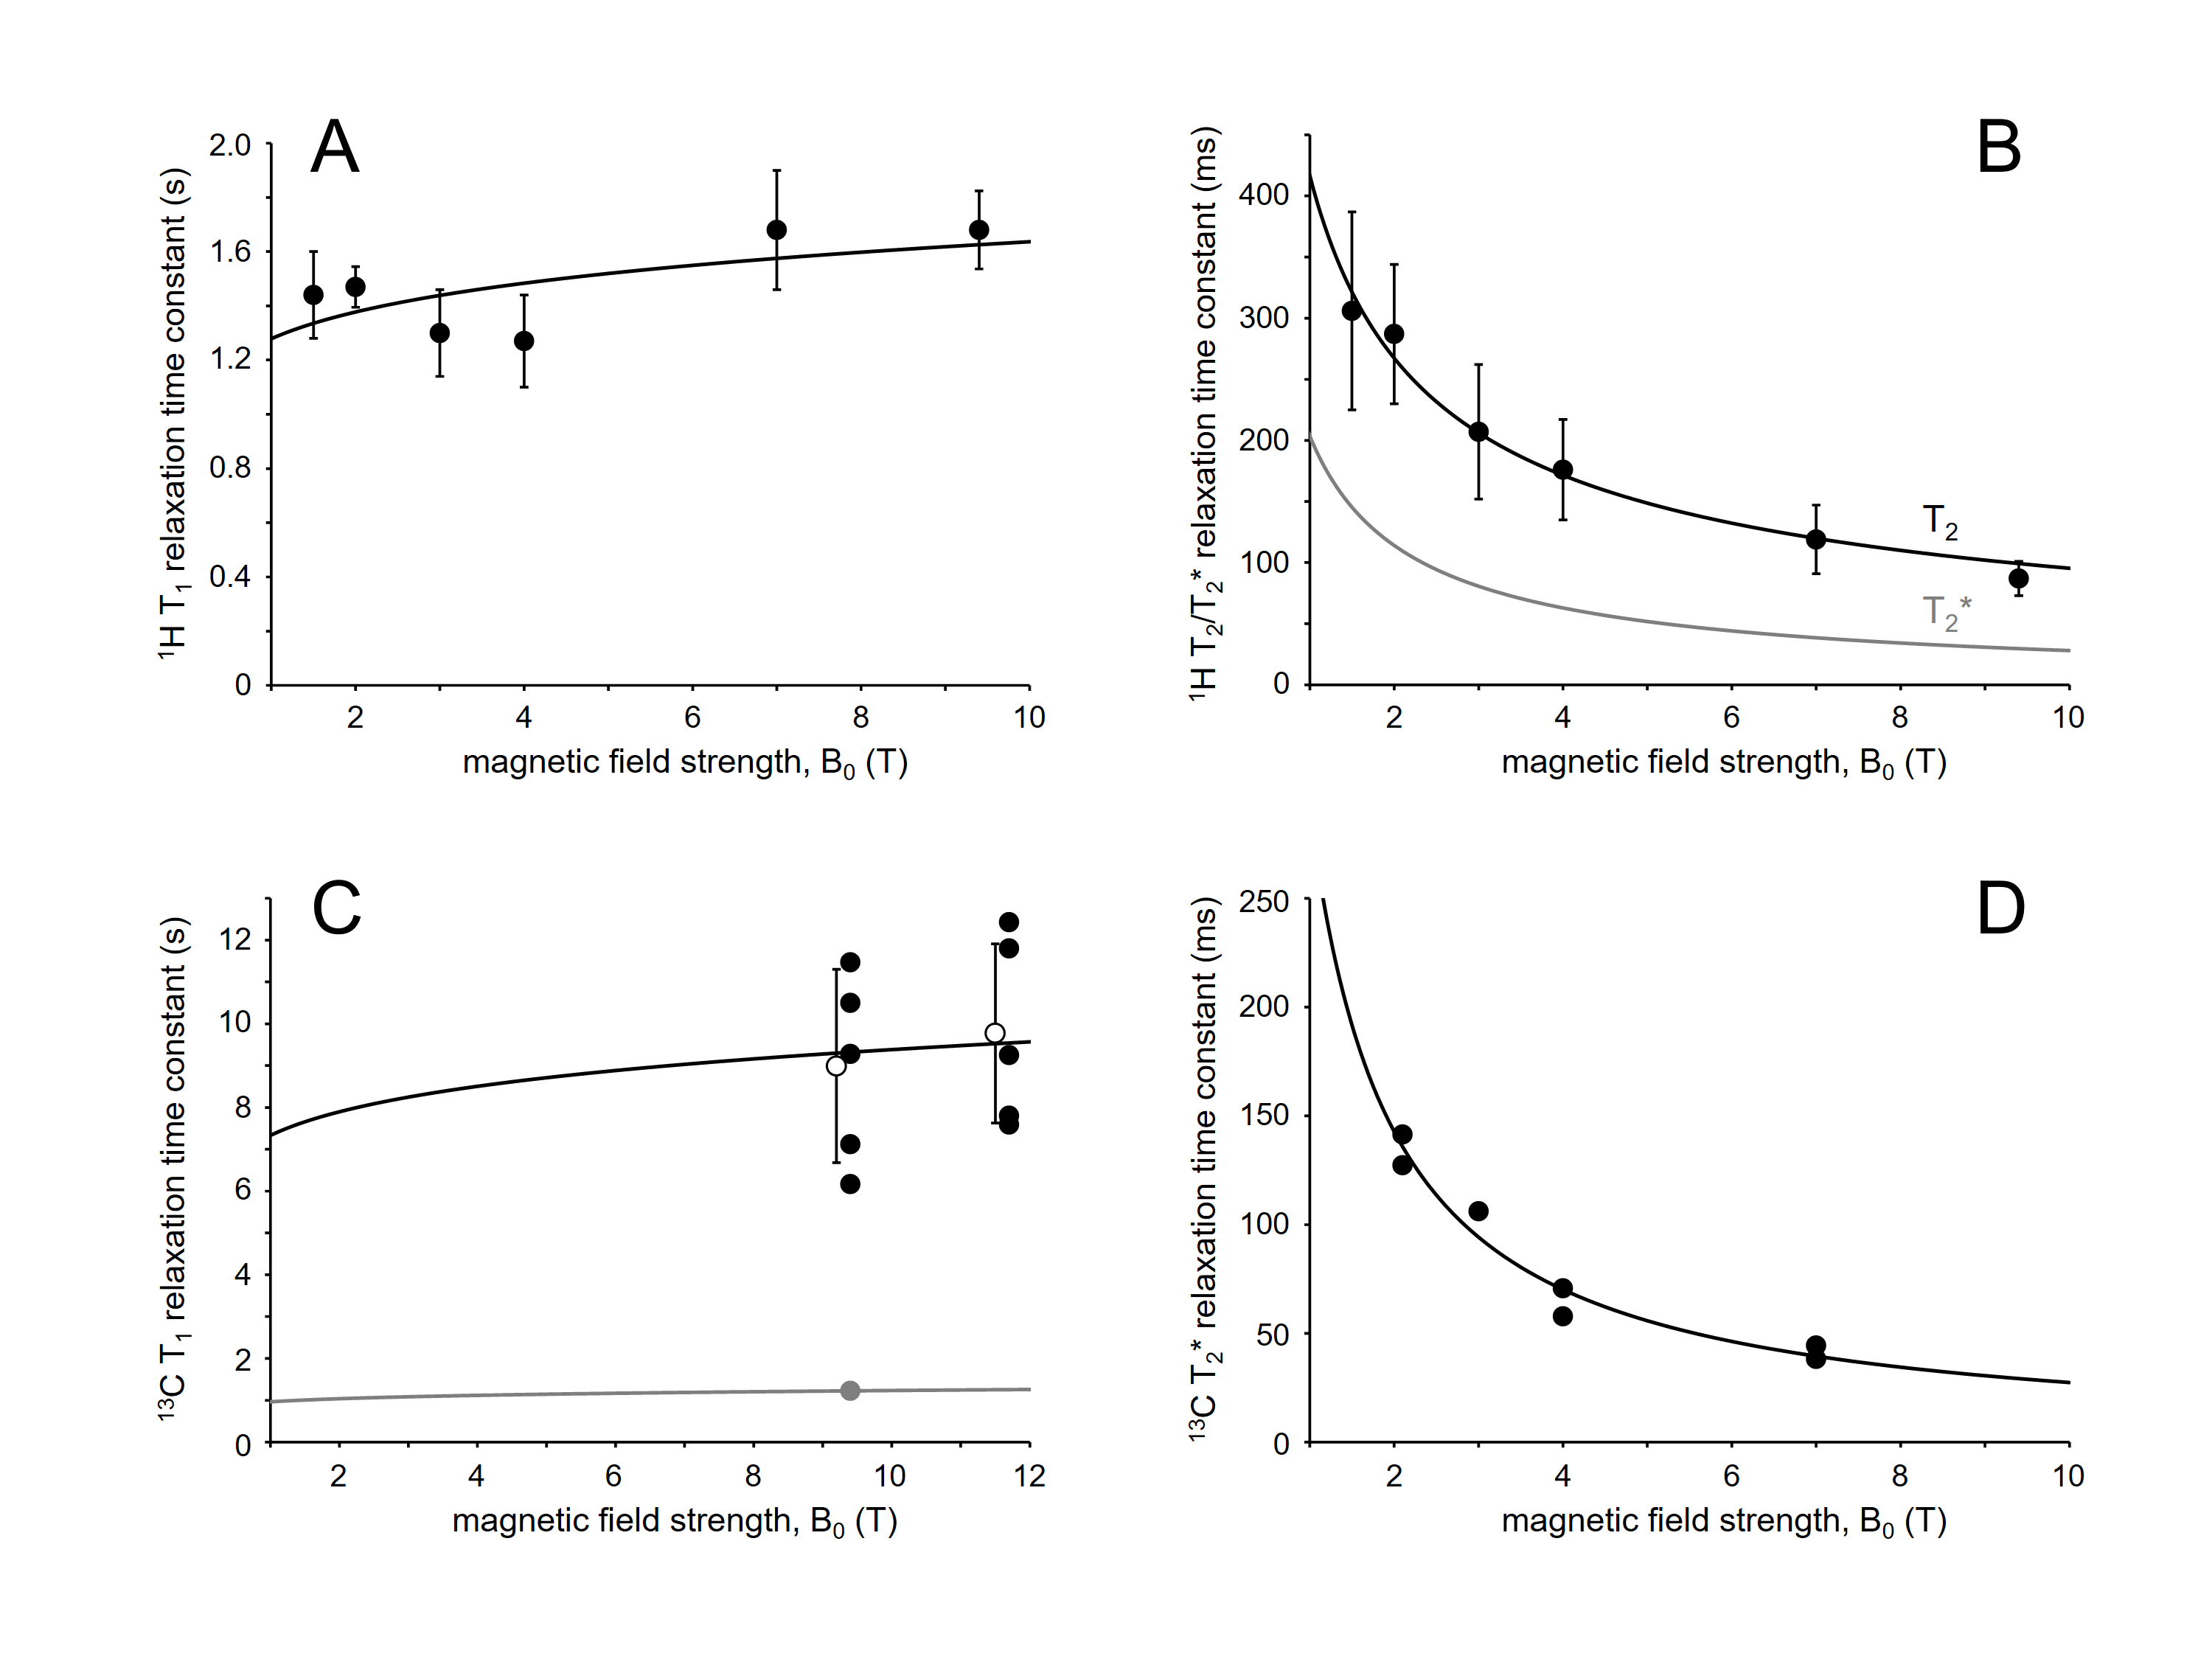
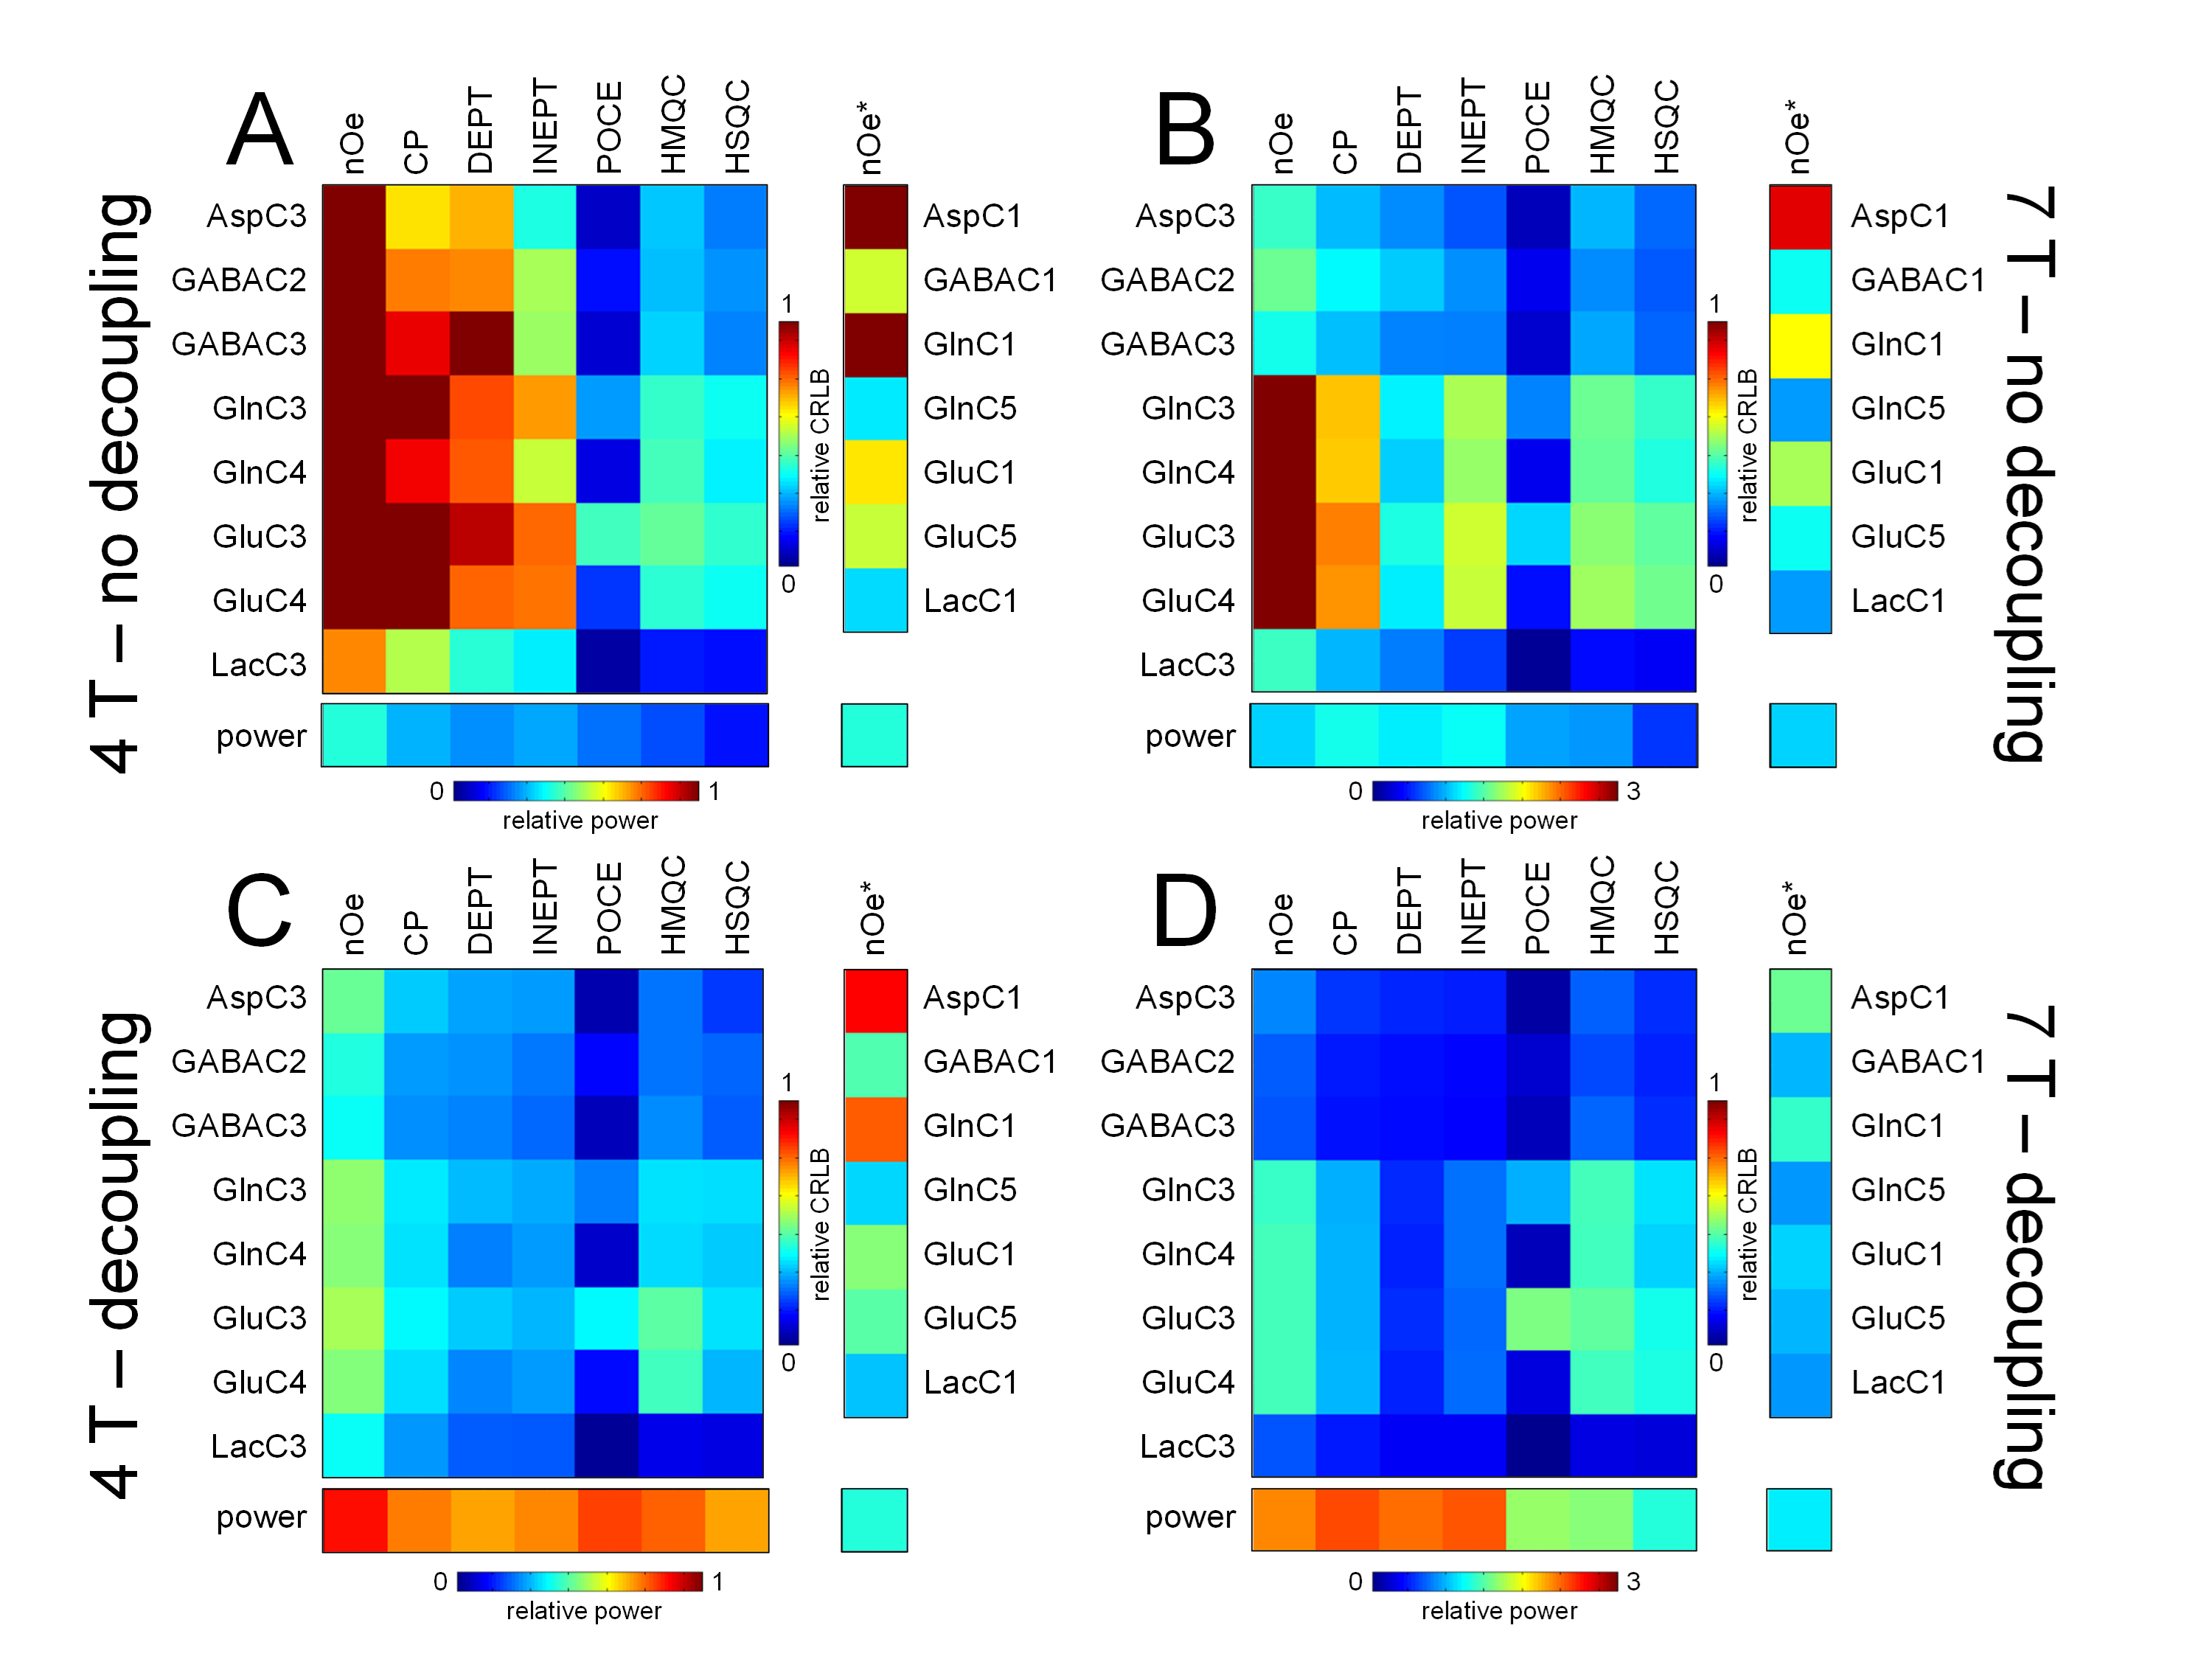
The intrinsic, sequence-independent sensitivity difference between 1H and 13C detection, as well as the difference in transmit efficiency, was established with 80 mm diameter, single-turn surface coils tuned to proton (170.49 MHz at 4 T and 298.08 MHz at 7 T) and carbon-13 (42.87 MHz at 4 T and 74.97 MHz at 7 T). SNR and transmit efficiency were established in a plane 20 or 40 mm below the coil, whereas 2 L bottles containing 0 – 400 mM KCl solution were placed on top of the coil to create a range of coil loading Q values (Fig. 1A). The T1 and T2 field dependence for 1H MRS was obtained from abundant literature values. T1 and T2* relaxation parameters for 13C MRS are much scarcer and literature values were supplemented with measurements on rat brain in situ following a 2 hour intravenous infusion of [1-13C]-glucose. All MR methods were executed with 3D spatial localization using RF pulses within the sequence where possible, or otherwise by adding ISIS or multiple OVS modules. Peak RF amplitude was limited to 1.25 kHz on both 1H and 13C channels, whereas RF pulses used for spatial localization were selected to give a 20% maximum chemical shift displacement for any nucleus at any magnetic field. Each sequence was simulated using the density matrix formalism, after which the Cramer-Rao lower bounds (CRLBs) were calculated using realistic, field-specific T1 and T2* relaxation. RF power deposition calculations were based on the field-specific transmit efficiencies shown in Figs. 1B and C. Broadband decoupling was applied for a duration of two times T2* at a peak amplitude of 500 Hz for most sequences.Results
The 1H and 13C transmit efficiencies at 4 T and 7 T are shown in Fig. 1B and C, whereas the 1H and 13C sensitivities at 4 T and 7 T are shown in Figs. 1D and E. For a human head coil load (dotted lines), the transmit efficiencies are 151.7 Hz/1W and 73.6 Hz/1W for 1H at 4 T and 7 T and 134.0 Hz/1W and 97.2 Hz/1W for 13C at 4 T and 7 T. The relative sensitivities for 13C (4 T): 13C (7 T): 1H (4 T): 1H (7 T) are 1.0 : 2.5 : 17.8 : 31.2. A summary of the field-dependent 1H and 13C T1 and T2 relaxation is shown in Fig. 2. Fig. 3 shows the CRLBs for various MR methods and 13C-labeled metabolites. The CRLBs are generally highest at 4 T without decoupling (Fig. 3A) and demonstrate a modest improvement going to 7 T (Fig. 3B, no decoupling). The CRLBs improve greatly with decoupling (Fig. 3C and D), but comes at the price of a 2-3-fold increase in RF power. Note that the RF power requirements at 7 T are generally 2-3-fold higher than at 4 T. Despite the limited spectral dispersion, the indirect POCE method gives the highest accuracy for most resonances.Discussion
Here we have presented a framework that allows for objective evaluation of direct 13C and indirect 1H-[13C] MR detection methods. It gives unique insights into the various contributions to the final accuracy of a given metabolite. For example, even though 7 T gives a significant boost in 1H SNR (31.2/17.8 = 1.75 x) this is not directly translated to similarly improved CRLBs due to the significantly shorter T2* relaxation at 7 T. In addition to selecting an optimal detection method for a given applications, the presented framework also allows for MR sequence optimization prior to experimentation.Acknowledgements
No acknowledgement found.References
1. Bluml S, Moreno-Torres A, Ross BD. [1-13C]glucose MRS in chronic hepatic encephalopathy in man. Magn Reson Med 2001;45:981-993.
2. Li S, Yang J, Shen J. Novel strategy for cerebral 13C MRS using very low RF power for proton decoupling. Magn Reson Med 2007;57:265-271.
3. Klomp DW, Renema WK, van der Graaf M, de Galan BE, Kentgens AP, Heerschap A. Sensitivity-enhanced 13C MR spectroscopy of the human brain at 3 Tesla. Magn Reson Med 2006;55:271-278.
4. Shen J, Petersen KF, Behar KL, Brown P, Nixon TW, Mason GF, Petroff OA, Shulman GI, Shulman RG, Rothman DL. Determination of the rate of the glutamate/glutamine cycle in the human brain by in vivo 13C NMR. Proc Natl Acad Sci U S A 1999;96:8235-8240.
5. Gruetter R, Seaquist ER, Kim S, Ugurbil K. Localized in vivo 13C-NMR of glutamate metabolism in the human brain: initial results at 4 tesla. Dev Neurosci 1998;20(4-5):380-388.
6. Rothman DL, Novotny EJ, Shulman GI, Howseman AM, Petroff OA, Mason G, Nixon T, Hanstock CC, Prichard JW, Shulman RG. 1H-[13C] NMR measurements of [4-13C]glutamate turnover in human brain. Proc Natl Acad Sci U S A 1992;89:9603-9606.
7. van Zijl PC, Chesnick AS, DesPres D, Moonen CT, Ruiz-Cabello J, van Gelderen P. In vivo proton spectroscopy and spectroscopic imaging of [1-13C]-glucose and its metabolic products. Magn Reson Med 1993;30:544-551.
8. Watanabe H, Ishihara Y, Okamoto K, Oshio K, Kanamatsu T, Tsukada Y. 3D localized 1H-13C heteronuclear single-quantum coherence correlation spectroscopy in vivo. Magn Reson Med 2000;43:200-210.
9. de Graaf RA, De Feyter HM, Rothman DL. High-sensitivity, broadband-decoupled 13C MR spectroscopy in humans at 7T using two-dimensional heteronuclear single-quantum coherence. Magn Reson Med 2015;74:903-914.
Figures