5617
Quantitative analysis of hyperpolarized [1-13C]pyruvate metabolic kinetics using Bayesian Inference algorithms1Electrical Engineering, University of Surrey, Guildford, United Kingdom, 2Radiology, University of Cambridge, 3Centre for Medical Imaging, University College London
Synopsis
Metabolic processes monitored by MRS precede the micro-structural changes visualised by MRI. It is well-recognised that cancer cells reprogram their metabolic pathways to meet their energy demands for abnormal proliferation. Pyruvate is produced through the breakdown of glucose in glycolysis, and is essential for providing cellular energy. Histological studies have shown increased exchange of pyruvate to lactate in prostate cancer, demonstrating a positive correlation with more aggressive disease. In regions of up-regulation of glucose metabolism, [1-13C]pyruvate is more readily converted to [1-13C]lactate, providing added value for diagnostic imaging. This work aims to robustly quantify the exchange rates between pyruvate and lactate using Bayesian Inference algorithms.
Purpose
Hyperpolarized [1-13C]pyruvate MRS can provide additional diagnostic value to the structural changes visualised by MRI. Pyruvate is produced through the breakdown of glucose in glycolysis, and is essential for providing cellular energy. In regions of up-regulation of glucose metabolism, [1-13C]pyruvate is more readily converted to [1-13C]lactate, providing added value for diagnostic imaging [1,2]. The exchange-rates between metabolites and their relaxations times are described from the well-established Bloch-McConnell differential equations. This work proposes a Bayesian Inference algorithm to accurately quantify metabolic parameters. Bayesian Inference algorithms reduce over-fitting and are more resilient to noise compared to commonly used nonlinear least-squares fitting.
Methods
The suggested Bayesian inference algorithm minimises the posterior probability distribution function p(mk,IF,σP,σL|yP,yL) as a function of the metabolic parameters mk= {kPL, kLP, T1P,T1L}, the modelled pyruvate input function (IF) parameters {arrival time, duration of pyruvate injection, rate of injection} and the noises σP,σL of the acquired pyruvate, lactate signals given the pyruvate, lactate time courses yP, and yL. The proposed Bayesian inference algorithm employs Langevin dynamics Markov Chain Monte Carlo (MCMC) sampling to accelerate convergence while avoiding local maxima.
$$\hat{mk}, \hat{IF},\hat{\sigma_{P}},\hat{\sigma_{L}}= argmax_{mk,IF,\sigma_{P},\sigma_{L}}p(mk,IF,\sigma_{P},\sigma_{L}|y_{P},y_{L})$$
Where kPL, kLP are the forward and backward exchange-rates between pyruvate and lactate respectively, T1P,T1L are the relaxation times of pyruvate and lactate. $$$p(mk,IF,\sigma_{P},\sigma_{L}|y_{P},y_{L})$$$ is given by
$$ p(mk,IF,\sigma_{P},\sigma_{L}|y_{P},y_{L})=\frac{p(mk)\cdotp p(\sigma_{P},\sigma_{L})\cdotp p(y_{P},y_{L}|mk,IF,\sigma_{P},\sigma_{L})}{\int_{mk^{*},\sigma^{*}}^{} p(mk^{*})\cdotp p(\sigma_P^*,\sigma_L^*)\cdotp p(y_{P},y_{L}|mk^{*},IF,\sigma_P^*,\sigma_L^*)}$$
Where $$$p(mk), p(\sigma_{P},\sigma_{L})$$$ are the prior probability distribution functions. Gaussian priors are assumed for the metabolic parameters mk, where it is assumed they are positive and within a certain range. An uninformative Inverse Gamma prior was used for the unknown noises σP,σL of the pyruvate and lactate time courses. $$$p(y_{P},y_{L}|mk,IF,\sigma_{P},\sigma_{L})$$$ is the Gaussian likelihood function. The integral cannot be calculated analytically,consequently is estimated with the Metropolis–Hastings algorithm,which is a MCMC method.
Langevin dynamics produces samples through gradient updates plus injected Gaussian noise σmk
$$\hat{mk}= mk+\frac{\sigma_{mk}}{2} \triangledown_{mk}log p(y_{P},y_{L}|mk,IF,\sigma_{P},\sigma_{L})+\sigma_{mk}$$
The gradient accelerates the convergence and the injected noise (σmk) assures we will not hit local maximum. The hyperpolarized [1-13C]pyruvate MRS is modelled based on the Bloch-McConnell differential equations. Given that this is a physical phantom study we do not need to account vascular system complexities, hence modelling the IF as a box-car function is adequate.The proposed Bayesian inference algorithm is validated on a renewable dynamic metabolic phantom that describes the conversion of [1-13C]pyruvate in a reproducible manner, where the rate of conversion can be controlled and tuned using different concentrations of the lactate dehydrogenase enzyme (LDH). The data of this phantom have been previously published by Daniels et al. [3]. Briefly, pyruvate and lactate of thirty-three 15 ml phantoms containing 0 (n=2), 20U (n=5), 40 (n=6), 60 (n=6), 80 (n=6), 100 (n=5) and 120 U (n=3) of LDH enzyme were imaged (axial spiral-CSI) in sets of three.
The 33 phantoms with LDH concentrations 0, 20, 40, 60, 80, 100, 120 U were acquired with 4 seconds temporal resolution. Pyruvate and lactate time courses for each phantom were calculated from the pixel of interest with the highest overall lactate signal.
For the nonlinear least-squares fitting, the Bayesian extension likelihood function proposed at [4] was minimized using the Levenberg-Marquardt (L-M) algorithm. To avoid the dependence on the initial concentrations of pyruvate and lactate, a Monte Carlo method was used [3] to randomly vary these inputs over 1000 runs for each model fit. The proposed Bayesian inference algorithm is validated in terms of (i) goodness-of-fit based on the Kolmogorov-Smirnov test (KS-test) and (ii) Pearson correlation (r) between metabolic parameters and the LDH concentrations.
Results
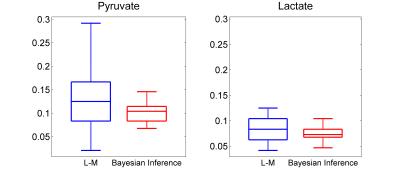
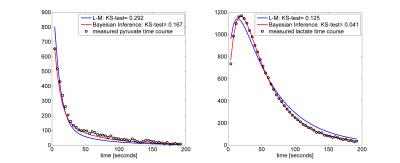
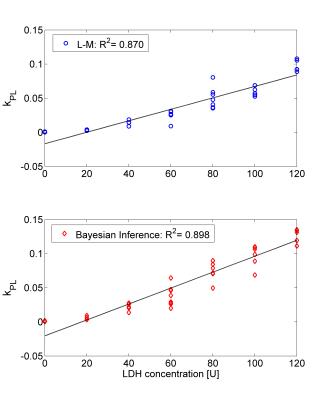
The Bayesian inference accurately and more robustly fitted the pyruvate and lactate time courses compared to the L-M algorithm. Figure 1 shows a box-plot of the KS-test across the time courses of pyruvate and lactate fitted with the L-M and the proposed Bayesian inference algorithm. Although the median KS-test values between the two algorithms are comparable, the inter-quartile range is significantly lower for the Bayesian inference algorithm. Figure 2 shows a fitting example for the two algorithms for a phantom with LDH=80U. Figure 3 shows the correlation of kPL with the LDH concentration, where r=0.933 for the L-M and r=0.948 for the Bayesian inference algorithm. Only kPL is shown because (in agreement with [3]) it is the metabolic parameter with the highest correlation compared to kLP, where r=0.526 for the L-M and r=0.654 for the Bayesian inference algorithm.
Conclusion
The quantified kPL with the Bayesian Inference algorithm exhibited slightly higher correlation with the enzyme concentrations compared to L-M. Nonetheless, the Bayesian inference algorithm led to a more accurate and more reliable fitting compared to L-M.Acknowledgements
This work was undertaken at the centre for vision, speech and signal processing (CVSSP), university of Surrey and UCLH/UCL.References
[1] Nelson SJ, Kurhanewicz J, Vigneron DB, et al. Metabolic imaging of patients with prostate cancer using hyperpolarized [1-¹³C]pyruvate. Sci Transl Med. 2013; 5(198): 198-208.
[2] Day SE, Kettunen MI, Gallagher FA, et al. Detecting tumor response to treatment using hyperpolarized 13C magnetic resonance imaging and spectroscopy. Nat Med. 2007;13(11):1382-7.
[3] Daniels CJ, McLean MA, Schulte RF, et al. A comparison of quantitative methods for clinical imaging with hyperpolarized (13)C-pyruvate.NMR Biomed. 2016; 29(4): 387-99.
[4] Hill DK, Orton MR, Mariotti E, et al. Model free approach to kinetic analysis of real-time hyperpolarized 13C magnetic resonance spectroscopy data. PLoS One. 2013; 8(9): e71996.
Figures

Figure 1: Box-plots of the KS-test across the different time courses (corresponding to different LDH concentrations) of pyruvate and lactate fitted with the L-M and the Bayesian inference algorithm. The median KS statistic test (interquartile range) for the L-M where 0.125 (0.08) for pyruvate and 0.083 (0.04) for lactate and for ther Bayesian Inference where 0.104 (0.03) for pyruvate and 0.073 (0.014) for lactate.

