5614
Dynamic 31P MR spectroscopy of fatigue in triceps surae muscles on post-poliomyelitis patients versus healthy age-matched volunteers at 3T1Radiology, Division of Radiological Physics, University of Basel Hospital, Basel, Switzerland, 2Biomedical Engineering, University of Basel, Basel, Switzerland, 3Radiology, Clinic for Radiology and Nuclear Medicine, University of Basel Hospital, Basel, Switzerland, 4Pediatric Neurology, Universitäts-Kinderspital beider Basel (UKBB), Basel, Switzerland
Synopsis
This study was focused on comparing the metabolism of triceps surae muscles on postpoliomyelitis patients and age-matched healthy volunteers through dynamic 31P spectra acquisition at 3T magnetic field. It has been suggested previously that in postpolio patients, metabolic changes are secondary to neurogenic pathways, but may influence Pi/PCr ratios. Here, it was shown that baseline PDE/PCr ratios were higher in patients. During exercise, controls performed significantly higher work and the change of Pi/PCr ratios was lower than in patients. Investigation of the correlation of Pi/PCr with the degree of the disease could be a promising clinical direction.
PURPOSE
To compare the metabolism of triceps surae muscles of post-poliomyelitis patients to age-matched healthy controls using dynamic 31P MR spectroscopy (MRS) at 3T. 31P-MRS offers insight into muscle metabolism and the ability to quantify noninvasively the kinetics of phosphocreatine (PCr), adenosinetriphosphate (ATP), and intracellular pH in skeletal muscles during rest, exercise, and recovery 1-4. It has been suggested that metabolic changes are secondary to neurogenic pathways in this category of patients, but can influence the ratio of inorganic phosphate (Pi) to PCr ratios at rest and during exercise5-6.METHODS
10 healthy volunteers (age: 68.7±10y, 6 male, 4 female) and 30 patients with different degrees of muscle weakness (age: 65±4.6y, 13 male, 10 female) were examined. In cases where the most heavily affected leg was too weak to perform exercise for 5 min (maximum force <100N), the other leg was selected for the dynamic scan. Out of the 30 patients, four were excluded after the anatomical 1H scans, because of complete fat infiltration of the calf and three due to inability to lie for a long time. Dynamic 31P spectra were acquired at a 3T MRI clinical scanner equipped with a dual tuned 1H/31P surface coil during exercise with an air-pressure-activated commercial MR-compatible ergometer. The pedal resistance was set to 0.7-0.8 bar depending on the maximal exertable force of the subject measured both manually outside the scanner and with the pedal inside the scanner.
After calibration with a 90° RF pulse excitation, partially relaxed 31P spectra were acquired for saturation correction (500 us excitation, flip angle: 42°, acquisition delay (TE*)/ TR= 0.35/ 15000 ms, vector size: 1024, averages: 16, bandwidth: 3000 Hz, total scan time: 4.5 min). Dynamic 31P spectra were acquired with a protocol including 5 min rest, 5 min exercise and 5 min recovery. Non-localized FIDs were acquired during 15 min (500 us excitation, flip angle: 42°, acquisition delay (TE*)/TR: 0.35/2000 ms, vector size: 512, averages: 2, measurements: 150).
Quantification of the 31P spectra (i.e., phasing and peak fitting) was performed afterwards using the AMARES fitting algorithm7. Pi/PCr ratios and phosphodiester (PDE) to PCr ratios were calculated from the baseline spectra. Intracellular pH, PCr depletion, PCr recovery constant (τ), initial PCr recover rate (VPCr) and maximal oxidative flux (Qmax) were calculated offline (γATP was taken as a reference for the calculation of absolute concentrations). Total work performed during the exercise phase was recorded by the ergometer.
RESULTS
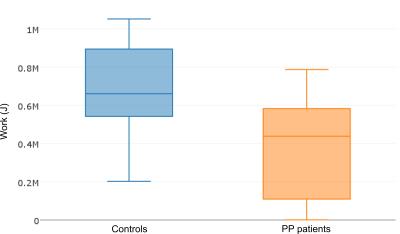
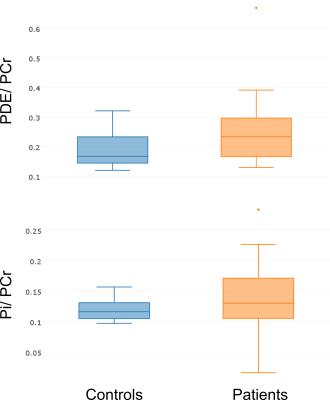
The controls performed significantly higher work (667±263 kJ (p=0.009), see Fig. 1) as compared to patients (379±243kJ). The baseline spectra acquisitions showed higher Pi/PCr ratios for the patient group, but the difference was not statistically significant (controls: 0.11±0.02, patients: 0.14±0.06, see Fig. 2). However, the baseline PDE/PCr ratios were closer to significance (controls: 0.20±0.07, patients: 0.26±0.11 (p = 0.067) see Fig. 2).
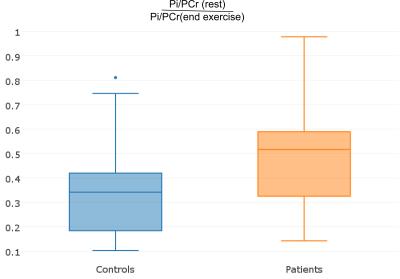
The ratios of Pi to PCr were compared at rest (i.e., first 5 min of dynamic spectra acquisition) and at the end of exercise (last 30 sec of exercise) (see Fig. 3). As expected (7), the ratios (Pi/Pcr-rest/ Pi/Pcr-end) were slightly, but not significantly higher for the group of patients (controls: 0.37±0.24, patients: 0.49±0.24). The comparison of τ, pH, VPCr and Qmax did not show significant differences between the two groups.
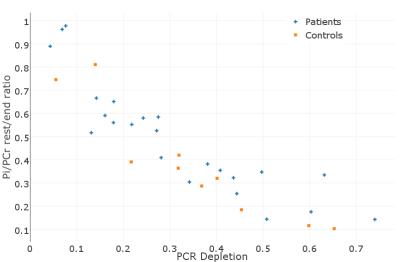
Finally, the change of Pi/PCr due to exercise was correlated with the percentage of PCr depletion. In many cases for the same PCr depletion the change of Pi/PCr was higher for patients, but a clear pattern could not be identified.
DISCUSSION
The mechanism that causes fatigue and weakness in post-poliomyelitis patients is not clear. It has been suggested that the change of Pi/PCr due to exercise is higher in patients5,6, although the effect of the disease on muscle metabolism is yet not completely clarified5,6,8. In this study, high-energy spectra of the posterior calf muscles at 3T were acquired. A difference between patients and controls could be seen in a number of parameters (Pi/PCr, PDE/PCr), but they did not reach significance. The low significance could partly be explained by the need to examine the less affected leg in some cases and by the reduced number of controls scanned so far.CONCLUSION
High energy dynamic phosphate spectra of post-polio patients and age-matched volunteers were acquired at 3T field strength. Confirming previous results5-6 it was shown that in patients the dynamics of Pi and PCr change. Further investigation of the correlation of Pi/PCr with the degree of the disease could be a promising clinical direction.Acknowledgements
This work was supported by the Lorenzo Piaggio Fondation.
We thank Dezortová M. and Šedivý P. for their feedback for the postprocessing.
References
1. D. Bendahan, B. Giannesini and P. J. Cozzone, Functional investigations of exercising muscle: a noninvasive magnetic resonance spectroscopy-magnetic resonance imaging approach, Cell. Mol. Life Sci. 2004; 61(9):1001-1015.
2. M. van Brussel, J.W.M. van Oorschot, J.P.J. Schmitz, K. Nicolay, A. van Royen-Kerkhof, T. Takken, J.A.L. Jeneson, Muscle Metabolic Responses During Dynamic In-Magnet Exercise Testing : A Pilot Study in Children with an Idiopathic Inflammatory Myopathy. Academic Radiology. p.2015; 22,11; 1443–1448.
3. Schocke MF1, Esterhammer R, Kammerlander C, Rass A, Kremser C, Fraedrich G, Jaschke WR, Greiner A. High-energy phosphate metabolism during incremental calf exercise in humans measured by 31 phosphorus magnetic resonance spectroscopy (31P MRS). Magn Reson Imaging 2004; 22(1):109-15.
4. Šedivý P, Kipfelsberger MC, Dezortová M, Krššák M, Drobný M, Chmelík M, Rydlo J, Trattnig S2, Hájek M, Valkovic L. Dynamic 31P MR spectroscopy of plantar flexion: influence of ergometer design, magnetic field strength (3 and 7 T), and RF-coil design, Med Phys. 2015; 42(4):1678-89.
5. Sharma U, Kumar V, Wadhwa S, Jagannathan NR., In vivo (31)P MRS study of skeletal muscle metabolism in patients with postpolio residual paralysis, Magn Reson Imaging. 2007; 25(2):244-9.
6. Ljungberg M, Sunnerhagen KS, Vikhoff-Baaz B, Starck G, Forssell-Aronsson E, Hedberg M, Ekholm S, Grimby G. 31P MRS evaluation of fatigue in anterior tibial muscle in postpoliomyelitis patients and healthy volunteers. Clin Physiol Funct Imaging. 2003; 23(4):190-8.
7. L. Vanhamme, A. van de Boogaart and S. Van Huffel, Improved method for accurate and efficient quantification of MRS data with use of prior knowledge, J. Magn. Reson. 1997; 129, 35-43.
8. Thompson RT, Barton PM, Marsh GD, Cameron MG, Gravelle DG, Hsieh JT, Hayes KC, Driedger AA. Post-polio fatigue: a 31P magnetic resonance spectroscopy investigation, Orthopedics. 1991; 14(11):1263-7.
Figures


