5612
Different activated calf muscle groups measured simultaneously during plantar flexion exercise with multiple knee angles using multivoxel 31P-MRS.1Center for Medical Physics and Biomedical Engineering, Medical University Vienna, Vienna, Austria, 2Department of Clinical Pharmacology, Medical University Vienna, Vienna, Austria
Synopsis
The distribution of workload between GM and SOL during plantar flexion exercise is strongly linked to the knee angle. This work investigates the differences in muscle activation of GM and SOL during plantar flexion with multiple knee angles. Time series spectra of both muscle groups were acquired simultaneously with high time resolution using dynamic multi-voxel 31P MRS. A linear correlation was found between knee angle and 31P MRS parameters related to muscle activation (PCr depletion, pH, PCr recovery time), confirming predominant involvement of GM with a straight knee, and increasing contributions of SOL with a bent knee.
Purpose/Introduction
Non invasive measurements of muscle activity using magnetic resonance spectroscopy can be done by quantifying specific metabolites which are involved in energy metabolism e.g. PCr, Pi, ATP and Lactate (1-2). Acquiring phosphocreatine and inorganic phosphate time courses in exercising muscle tissue using 31P-MRS is a common method to measure the metabolic response and allows calculating physiological relevant parameters e.g. pH, PCr recovery time constant τpcr, and maximum oxidative capacity Qmax (3,4). Many studies investigating exercising human calf muscles, with gastrocnemius medialis and soleus as the main contributor to force, have been published using localized MRS (5,6) or MRI (7-9). Considering differences in function, fibre-type composition and biomechanical properties (10,11), it is known that the knee angle affects the distribution of workload between GM and SOL activation (7,8), but available literature involving two or more knee angles is sparse. This study investigates the knee angle´s impact on different activations of human calf muscle groups with four knee angles using multivoxel 31P-MRS.
Methods
Twelve healthy subjects (8m/4f) who had declared written consent according to the declaration of Helsinki were measured with a protocol of 1 min rest, 3 min exercise and 5 min recovery for each knee angle (10°,20°,30°,40°). A custom-built 1H/31P multichannel transceiver surface coil array (12) was used to acquire time series spectra of GM and SOL simultaneously, with an effective time resolution of 6s, using a multivoxel 31P semiLASER sequence (13) with an interleaved acquisition scheme at 7T (Siemens Magnetom). Plantar flexion exercise was performed using a custom-built pneumatic non-magnetic ergometer prescribing the same pedal resistance for all subjects (F=248±62N). Spectra were fitted using jMRUI and processed with in-house developed python scripts. End exercise PCr depletion and pH and were calculated for each subject and each knee angle.Results
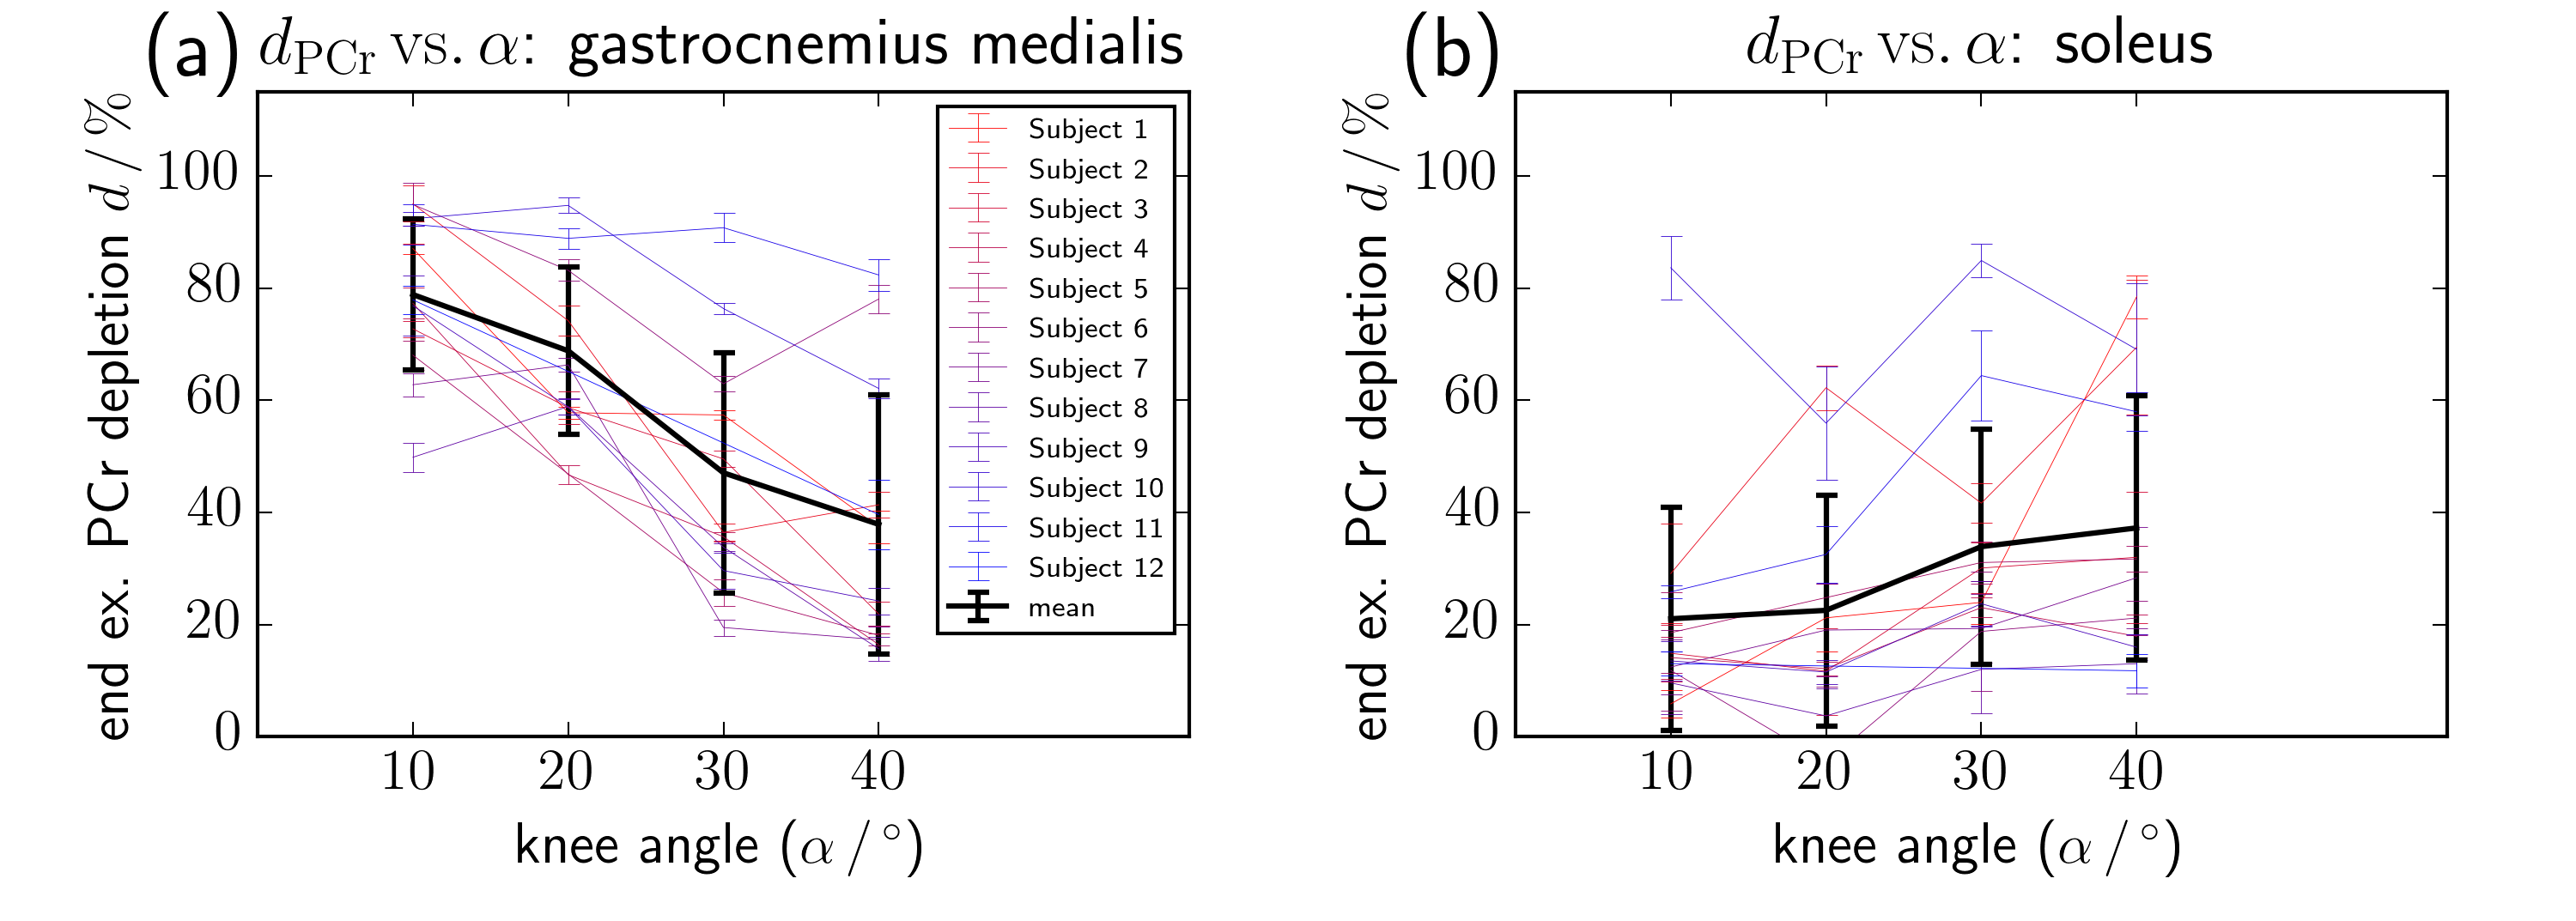
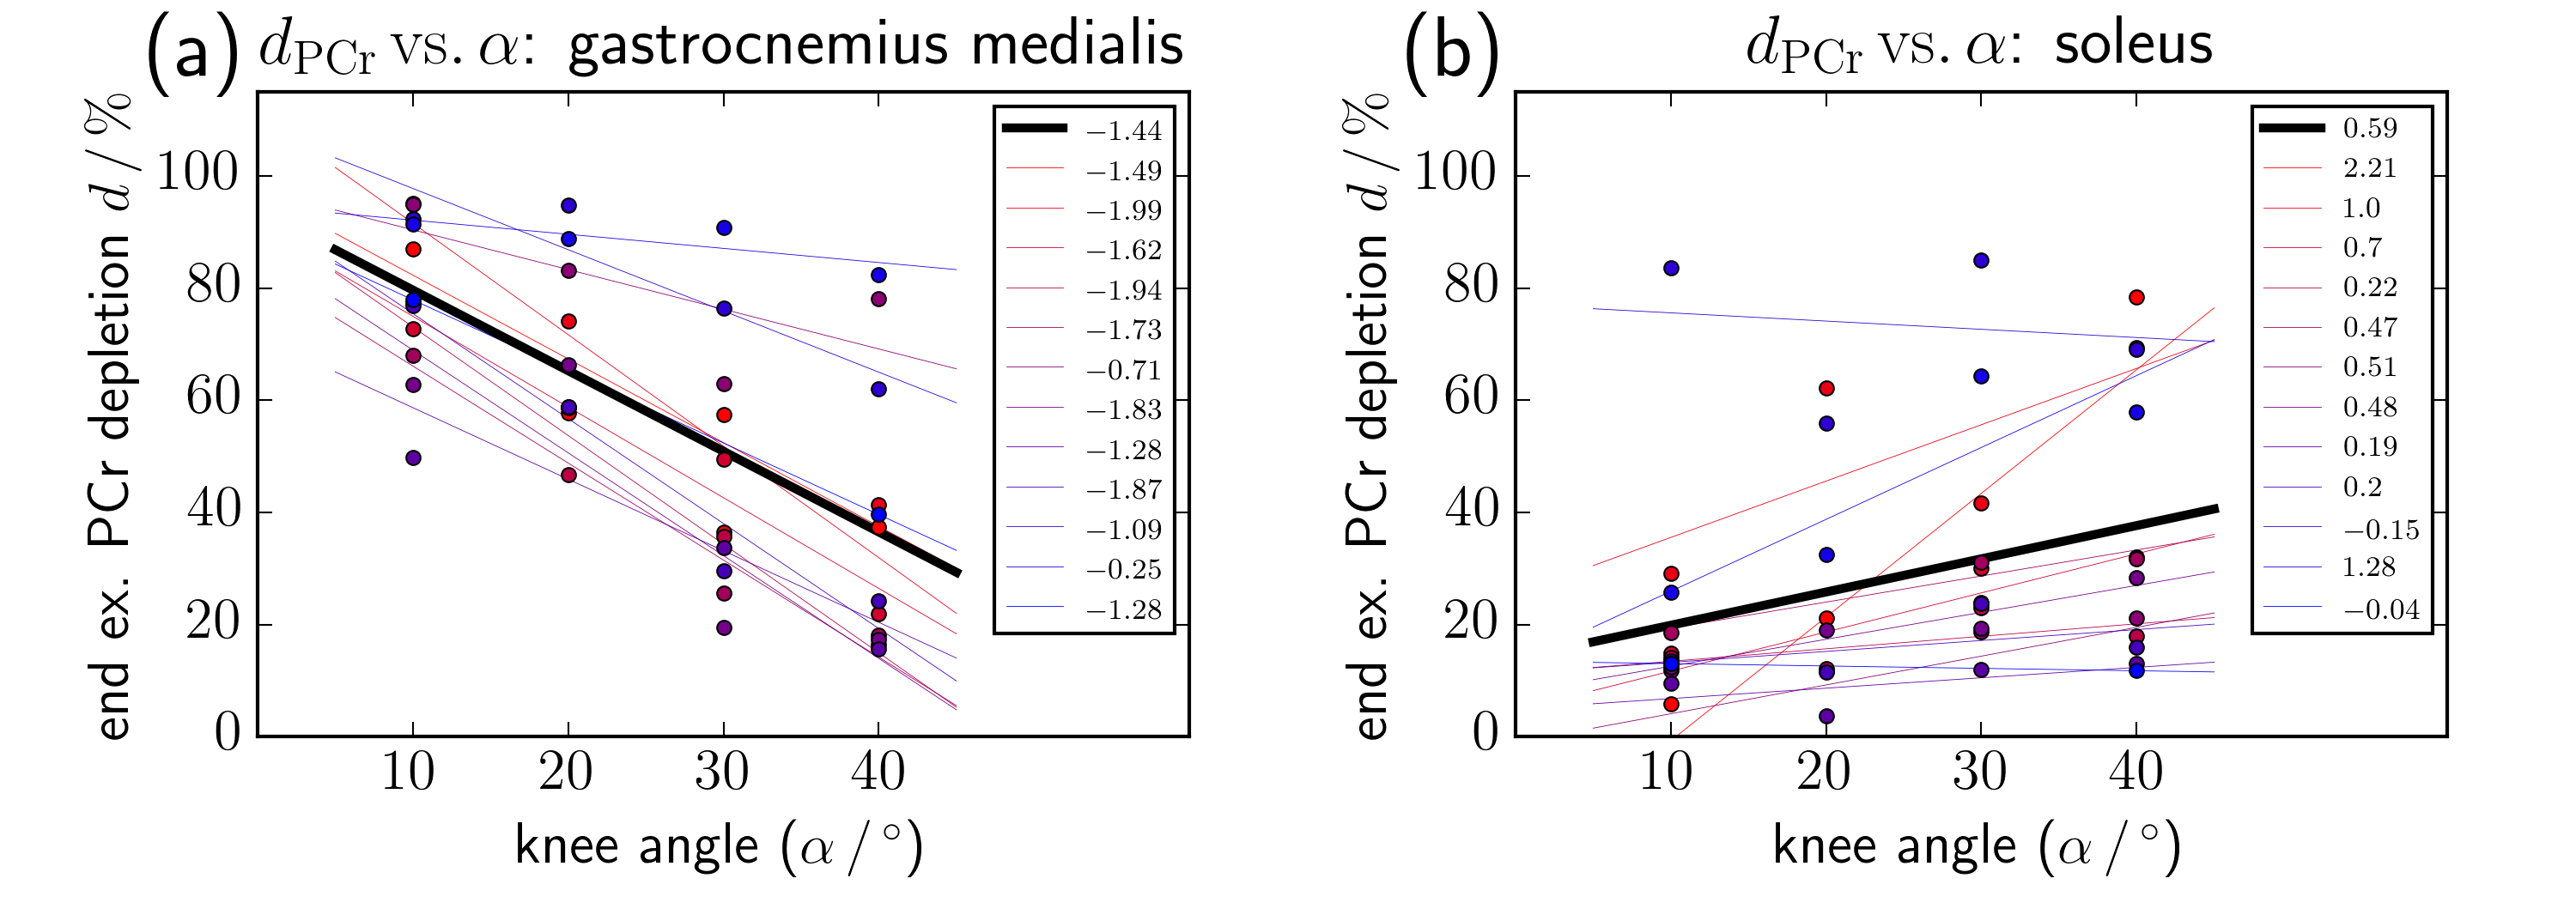
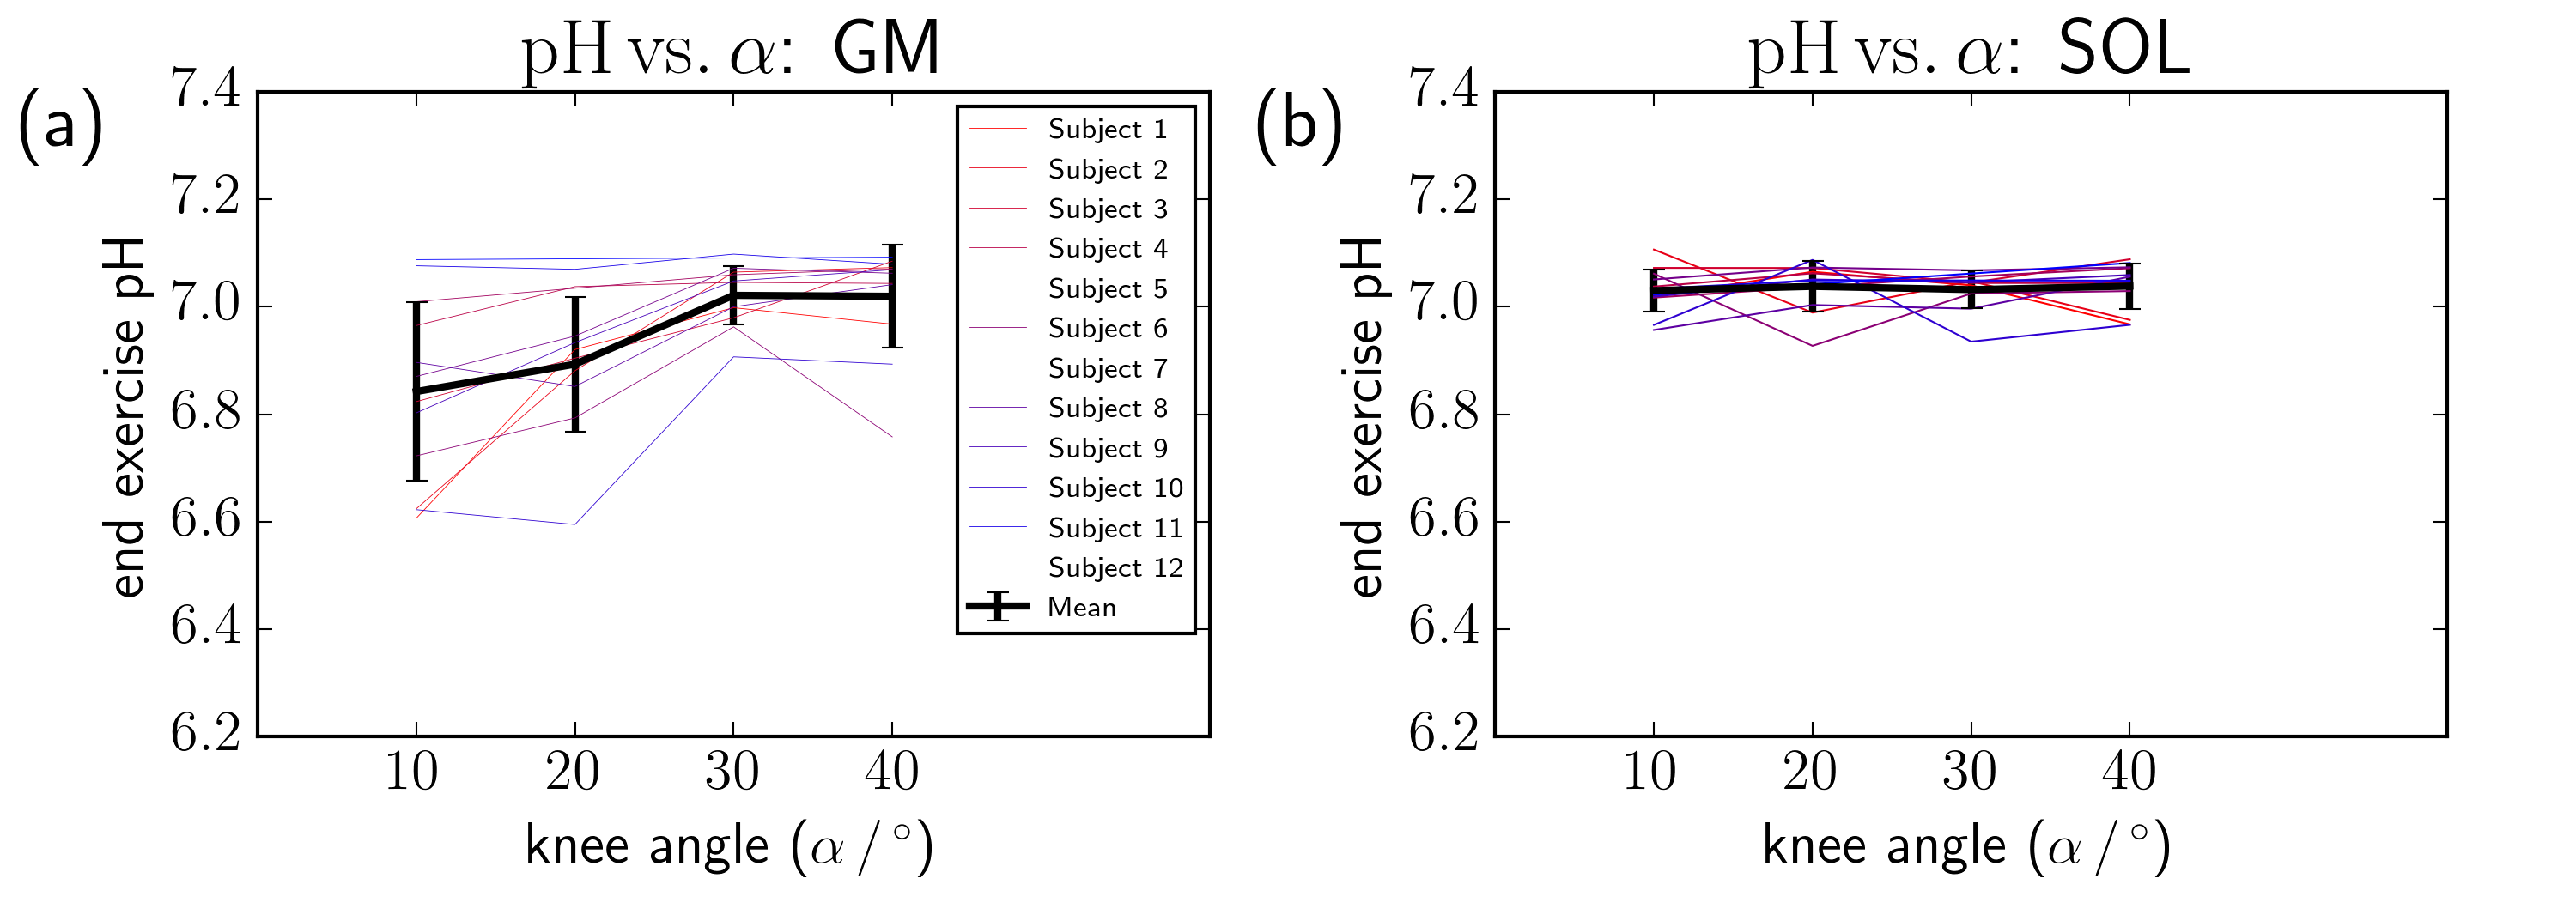
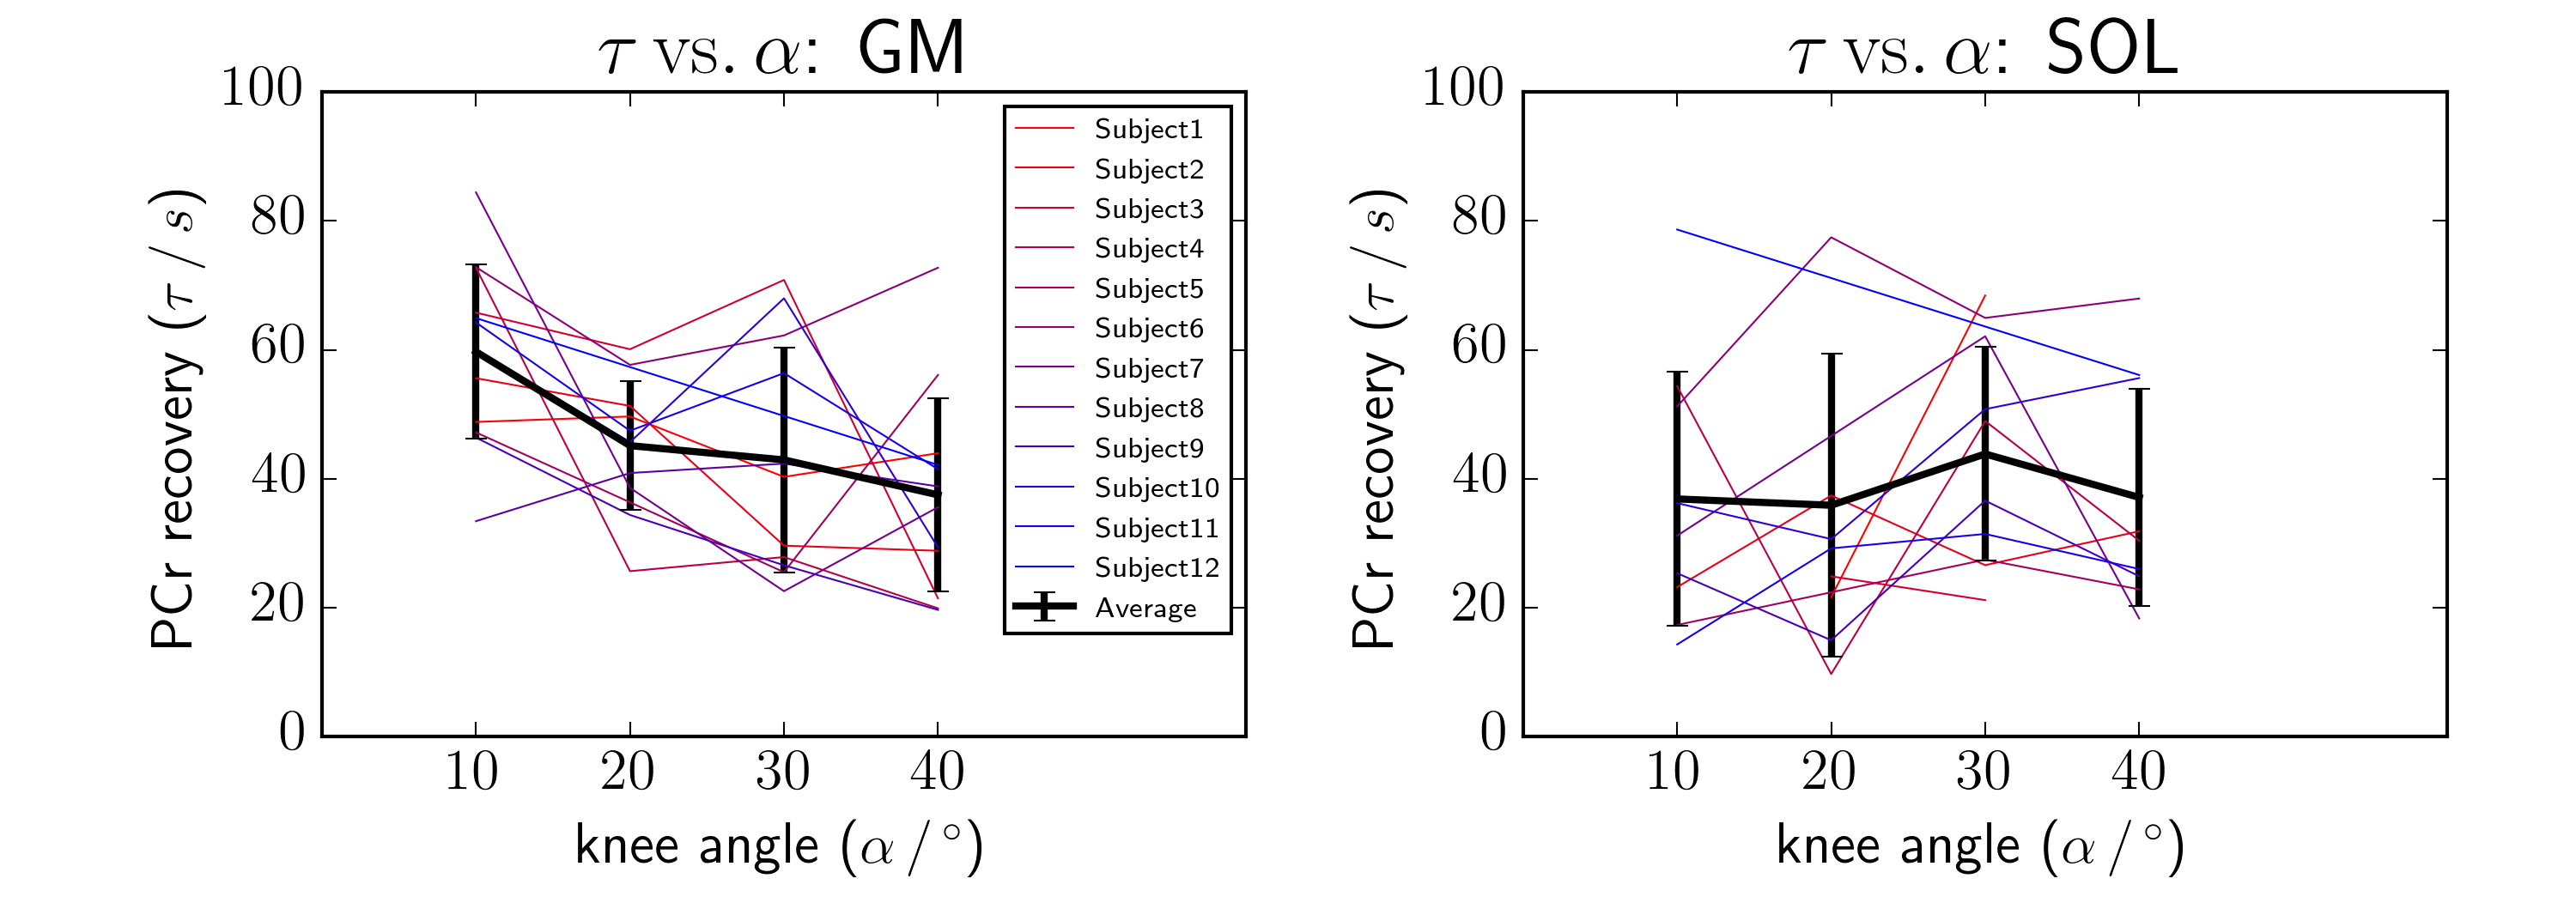
In both muscle groups end exercise PCr depletion changed almost linearly with increasing knee angle in all subjects. With a flexed knee the averaged end exercise PCr depletion decreased to 38±23% in GM compared to 79±14% with a straight knee, while in SOL the opposite was observed, increasing from 21±20% to 37±23%, as shown in Figure 1a and 1b. By performing linear regression in each subject, a PCr depletion offset between the subjects was observed, while the slopes were comparable with -1.44±0.51%/° in GM and in SOL 0.73±0.63 %/° (excluding two outliers), see Figure 2a and 2b. The dependence between knee angle and muscle activation was also indicated in GM through lower end-exercise pH values with the knee extended 6.78±0.13, and more neutral with the knee flexed 6.99±0.11, see Figure 3a. Only few subjects showed high depletion in SOL, nevertheless the end exercise pH did not drop comparably to GM. The majority stayed at neutral levels throughout all knee angles with 7.03+-0.01 on average, shown in Figure 3b. As known from literature, τpcr slightly increases with acidification (14), which was observed in GM but only slightly and not significantly in SOL shown in Figure 4a and 4b.
Discussion
It was clearly shown that the knee angle is linked to the distribution of muscle activation between the main contributors to force for plantar flexion exercise, GM and SOL. The inter-subject offset in phosphocreatine depletion was expected, since exercise intensities remained constant for all subjects, while their physical condition varied. Interestingly, higher average activation did not significantly change the slopes of each individual linear regression in GM, see Figure 2a. SOL showed higher variability but despite the outliers and the fact that PCr did not deplete to the same level as in GM, the calculated slopes are similar. End exercise pH dropped with high PCr depletion in GM for a straight knee and increased for lower activations shown in Figure 3a. Since the majority of the subjects did not reach a depletion over 60% end exercise pH in SOL stayed in the neutral range throughout all knee angles (4).
Few subjects showed high depletion in SOL (ca. 70-80%) and although the drop in pH was small and not comparable to GM, the sample size is too small to draw solid conclusion based on these data. It could be the focus of future studies. With higher acidification τpcr slightly increases, which was clearly visible in GM, see Figure 3a. Since in SOL the acidification is not as prominent compared to GM, the expected increase of τpcr is minimal, and as shown in Figure 4b there was an increase observable, but the difference was not significant.
Acknowledgements
This work has been funded by the Austrian Science Fund (FWF): I 1743-B13References
(1) Chance B. et al. “Skeletal muscle energetics with PNMR”, NMR Biomed 2006;19:904-926
(2) Asllani I. et al., “Anisotropic orientation of lactate in skeletal muscle observed by dipolar coupling in ¹H NMR spectroscopy”, Journal of Margnetic Resonance 1999;139:213-224
(3) Kemp G. J. et al. “Quantification of skeletal muscle mitochondrial function by ³¹P magnetic resonance spectroscopy techniques: a quantitative review”, Acta Physiologica 2015;213,107-144
(4) Fiedler G. B. et
al. “Skeletal muscle ATP synthesis and cellular H+ handling measured by localized 31P-MRS during exercise and recovery” Scientific Reports 2016:26;6:32037
(5) Allen PS. et al. “Simultaneous 31P MRS of the soleus and gastrocnemius in Sherpas during graded calf muscle exercise.”, Am J Physiol. 1997;273:R999-1007
(6) Meyerspeer M. et al., “Semi-Laser Localized Dynamic ³¹P Magnetic Resonance Spectroscopy in Exercising Muscle at Ultra-High Magnetic Field”, MRM 2011;65:1207-1215
(7) Valkovic L. et al. “Recruitment of calf muscles during plantar flexion with different knee angulation investigated by dynamic spiral ³¹P-MRSI at 7T”, ESMRMB 2016 #143
(8) Price TB et al. “Comparison of MRI with EMG to study muscle activity associated with dynamic plantar flexion”, Magn Reson Imaging 2003;8:853-61
(9) Forbes SC et al. “Comparison of oxidative capacity among leg muscles in humans using gated 31P 2-D chemical shift imaging.”, NMR Biomed 2009;10:1063- 1071
(10) Sale D. “Influence of joint position on ankle plantar flexion in humans.” J Appl Physiol Respir Env Exerc Physiol 1982;52:1636 – 42.
(11) Johnson MA et al. “Data on the distribution of fiber types in thirty-six human muscles” J Neurol Sci 1973;18:111–29.
(12) Goluch S et al. “A form-fitted three channel 31P, two channel 1H transceiver coil array for calf muscle studies at 7T.” Magn Reson Med 2014;73:1190–1195.
(13) Niess F et al. “Interleaved Multivoxel 31P MR Spectroscopy”, Magn Reson Med 2016;(Epub ahead of print)
(14) Iotti S et al.
“In Vivo Assessment of Mitochondrial Functionality in Human
Gastrocnemius Muscle by ³¹P MRS” NMR Biomed 1993;6:248-253
Figures