5611
31P spectroscopic imaging of the human brain at 3T: effect of NOE and 1H-decoupling1Radiology and Nuclear Medicine, Radboud university medical center, Nijmegen, Netherlands
Synopsis
31P MRS of the brain can reveal changes in energy and lipid metabolism in healthy and diseased brain. In this abstract we compare 31P MRS measurements with and without NOE and/or 1H-decoupling. Adding nuclear Overhauser enhancement (NOE) and 1H-decoupling to a 31P MRS measurement at 3T increases spectral resolution to that at 7T and improves sensitivity so that the theoretical difference with 7T is partly compensated for. At relatively short repetition times both 1H-decoupling and NOE have to be taken into account for proper quantification.
Introduction
In vivo phosphorus MR spectroscopy (31P MRS) of the brain enables noninvasive measurement of metabolites involved in bioenergetics and phospholipid metabolism. Alterations in the levels of these metabolites are reported in neurological diseases [1, 2]. However, in vivo 31P MRS is challenging due to its low intrinsic SNR and overlap of some signals such as those of mono- and diester upfield of phosphocreatine (PCr). Performing 31P MRS at a high field of 7T can partly solve these problems, but by applying nuclear Overhauser enhancement (NOE) and 1H decoupling a substantial improvement is also possible on 3T MR systems, which are more widely available.
In this study we investigated the effect of applying both these techniques using a dedicated multi-phased array 31P receive coil on the quality of 31P MR spectra at 3T .
Methods and Materials
Three healthy volunteers were measured on a 3T (TRIO, Siemens, Erlangen) system. The coil setup consists of a TxRx 31P/1H birdcage coil (RAPID Biomedical GmbH., Rimpar, Germany) combined with a home-built 8-channel 31P head array[3]. Four successive 3D 31P-MRSI measurements (FOV=260x260x260mm, matrix=10x10x10(16x16x16 interpolated), TR=2000ms, flip=40⁰, total acquisition time=13:03 minutes) were performed with or without NOE and/or 1H-decoupling. For 1H-decoupling a WALTZ4 train of 256ms was used and the γB1 of the NOE pulses was 35Hz and filled the dead time between acquisition and 31P excitation (~1.5 s). Whitened singular value decomposition[4] (WSVD) channel combination was used to combine the signals from the 8 individual 31P elements.
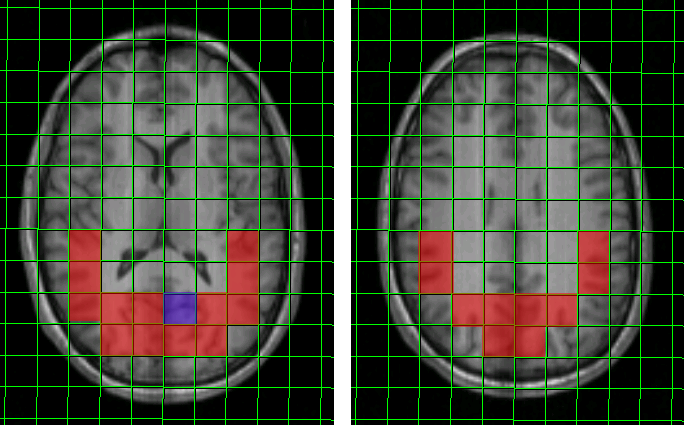
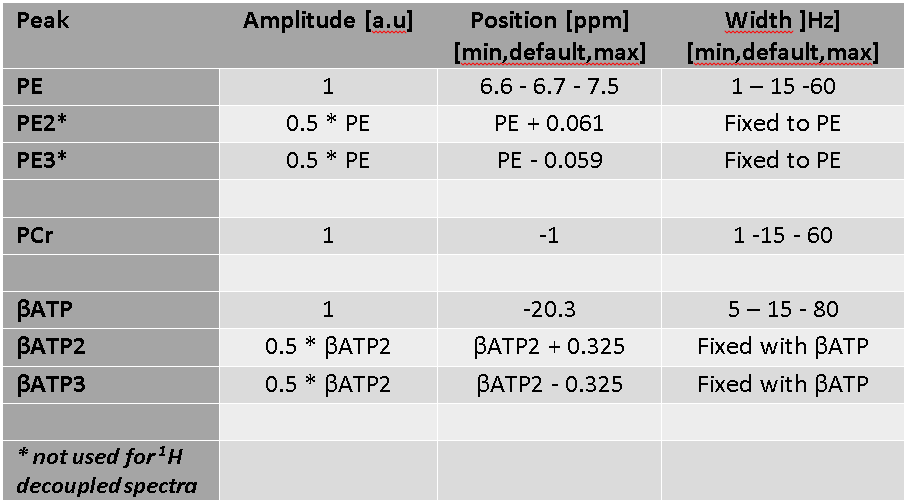
Metabolite Report (WIP, Siemens, Germany) was used to fit the metabolites of the selected voxels (Fig.1). As decoupling influences the spectral shape of 1H-31P coupled resonances of the mono- and diesters the prior knowledge for fitting was different for these resonances between 1H-decoupled and non 1H-decoupled spectra (Fig.2). Voxels completely within the anterior part of the brain were chosen to prevent fitting problems due to distorted peaks caused by susceptibility artefacts and partial volume effects.
All spectra were fit with appropriate prior knowledge (Fig.2 for PE, PCr and βATP). For every volunteer the average metabolite integrals and their standard deviation were calculated from the selected voxels without normalization. The standard deviation therefore reflects spatial differences in signal intensities across the brain. From the averages per volunteer a global average for the different MRSI acquisition techniques was calculated, and the relative increase in signal intensities as effect of using NOE and/or 1H-decoupling compared to the non-enhanced/non-decoupled measurement.
Results
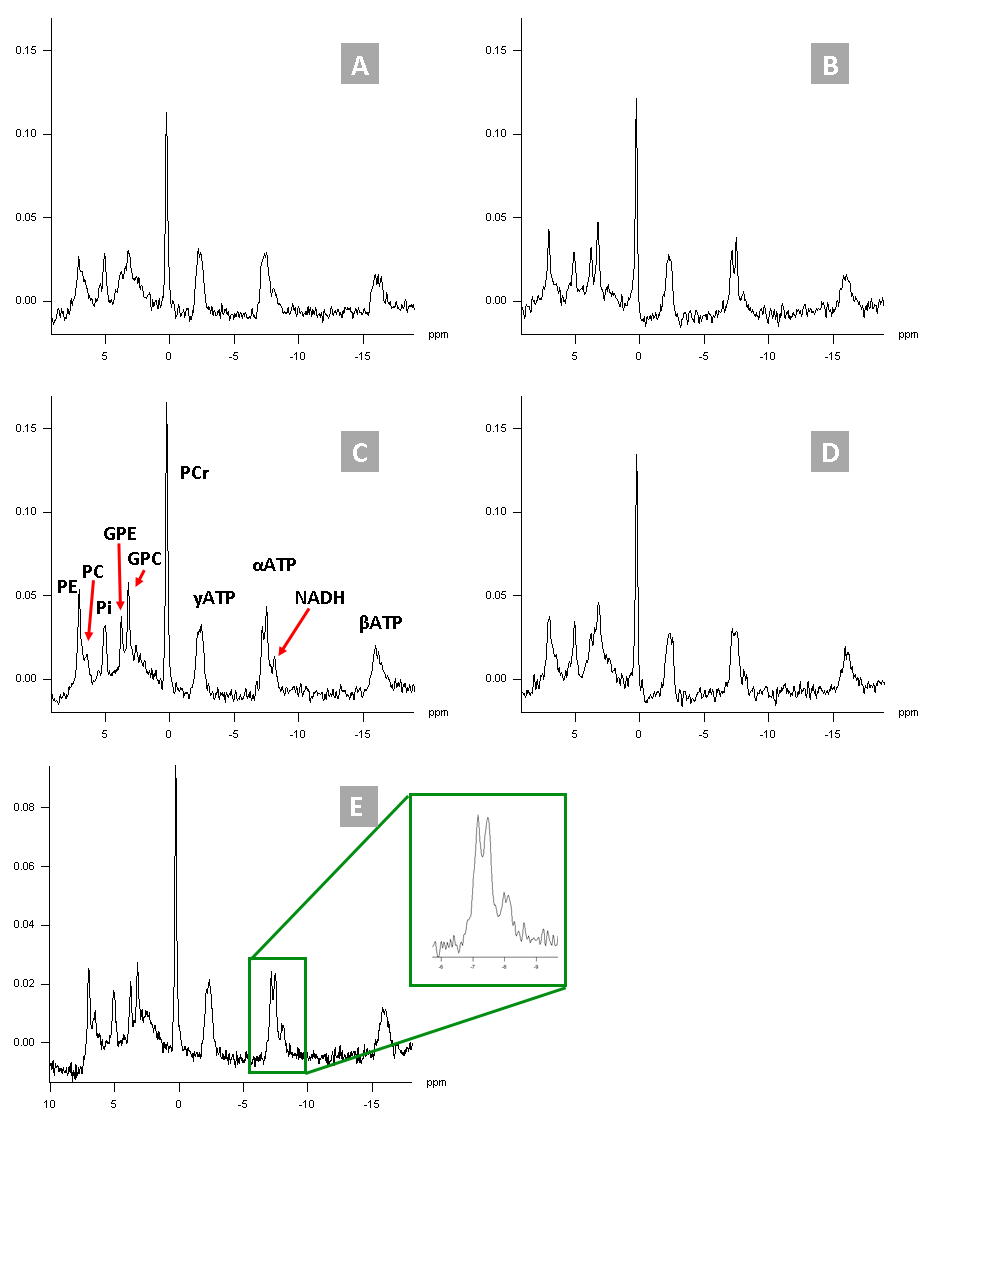
Applying 1H decoupling and NOE pulses has different effects on the appearance of 31P spectra (Fig.3). With 1H-decoupling the spectral resolution in the region of the mono- and diesters is increased and NOE increased the sensitivity. Moreover, the NAD(H) peak directly next the αATP can be resolved (Fig.3E)
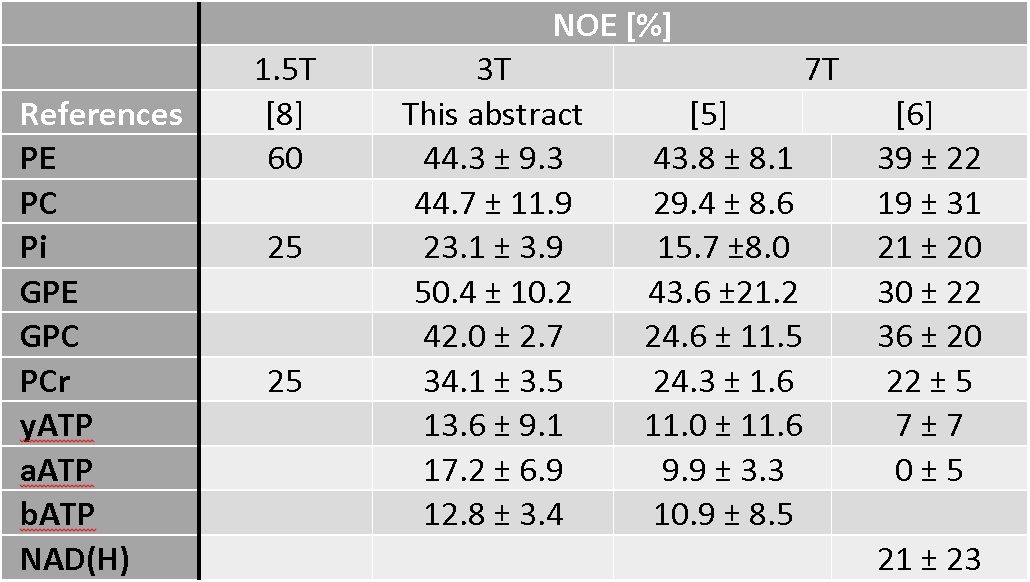
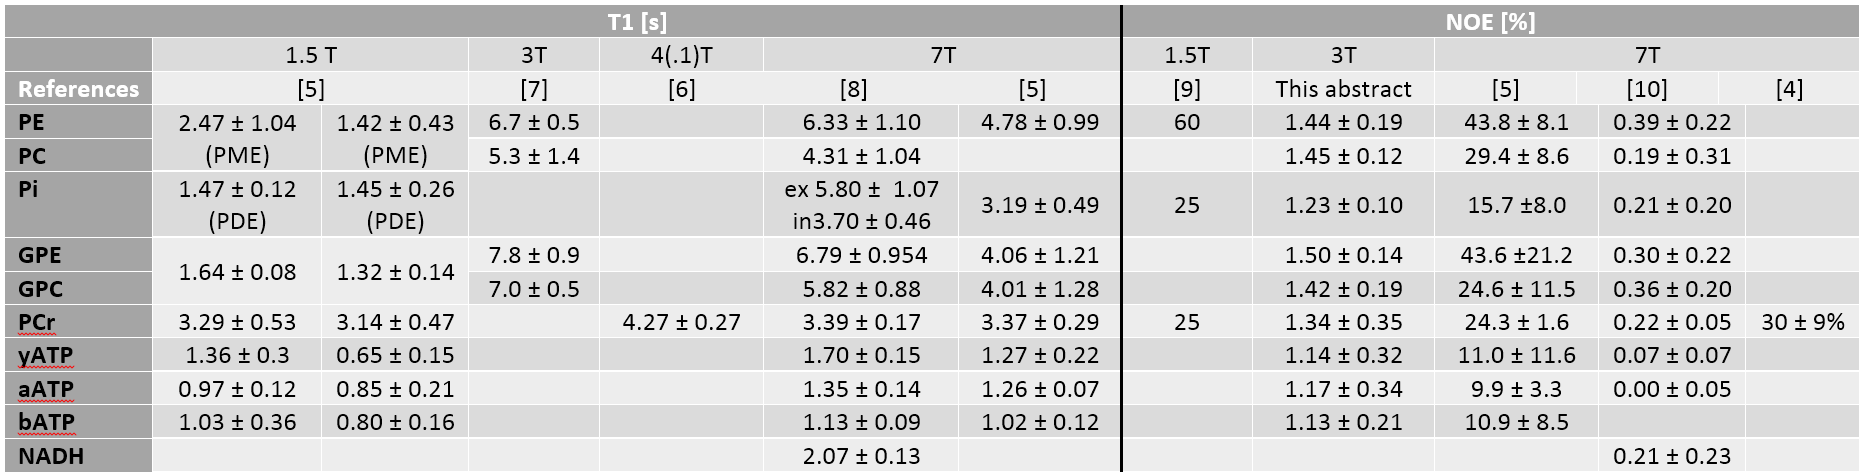
NOE was quantified for all the metabolites and the overall trend is a lower enhancement at higher B0-field (Fig. 4). Covering the whole metabolite range the NOE for PE, PCr and βATP are 44,3% ± 9,3%, 34,1% ± 3,5 and 12,8% ± 3,4 respectively. Compared to 7T data [5, 6] the NOE is approximately 8 percent higher for PE, 47% for PCr and for βATP the increase is ~17% .
The SNR of PE and PCr increases when adding more 1H decoupling transmit pulses to the measurement (Fig.5), indicating that with 1H-decoupling at the current TR there is already a measureable NOE.
Discussion/Conclusion
Publications [5, 7] showed that the SNRper unit time at 3T compared to 7T lacks a theoretical factor of ~3.6. Despite this backlog, measuring at 3T can still be valuable since other factors are more in favor or equal for 3T. On average loaded Q-factors are higher, line widths are narrower and the T1 times in brain seem rather similar[7]. Adding to this the higher NOE and including 1H-decoupling the sensitivity is approximately only about a factor 2 lower and spectral resolution at 3T is similar to 7T.
For quantitation NOE can be a drawback, even with only 1H-decoupling if relatively short TR values are used as variable NOEs may be generated. This effect varies per metabolite and will affect the quantification of these metabolites. Another potential problem for quantitation is a larger signal contribution from immobile phosphates at 3T.
We quantified the NOE for all the metabolites present in 31P MRS spectra in human brain. The NOE for PE, PCr and βATP at 3T was compared to published 7T data and showed a higher sensitivity gain at 3T. This gain differs per metabolite and for PCr this was even 44%.
Acknowledgements
No acknowledgement found.References
1. Mandal, P.K., Magnetic resonance spectroscopy (MRS) and its application in Alzheimer's disease. Concepts in Magnetic Resonance Part A, 2007. 30A(1): p. 40-64.
2. Maintz, D., et al., Phosphorus-31 MR spectroscopy of normal adult human brain and brain tumours. NMR Biomed, 2002. 15(1): p. 18-27.
3. Uden, M.J. 3 Tesla 8 channel 31P receive head array combined with double tuned 1H/ 31P birdcage to study brain disease in ESMRMB. 2013. Toulouse.
4. Rodgers, C.T. and M.D. Robson, Receive array magnetic resonance spectroscopy: Whitened singular value decomposition (WSVD) gives optimal Bayesian solution. Magn Reson Med, 2010. 63(4): p. 881-91.
5. Lei, H., et al., In vivo 31P magnetic resonance spectroscopy of human brain at 7 T: an initial experience. Magn Reson Med, 2003. 49(2): p. 199-205.
6. Lagemaat, M.W., et al., Repeatability of (31) P MRSI in the human brain at 7 T with and without the nuclear Overhauser effect. NMR Biomed, 2016. 29(3): p. 256-63.
7. Qiao, H., et al., In vivo 31P MRS of human brain at high/ultrahigh fields: a quantitative comparison of NMR detection sensitivity and spectral resolution between 4 T and 7 T. Magn Reson Imaging, 2006. 24(10): p. 1281-6.
8. Murphy-Boesch, J., et al., Proton-decoupled 31P chemical shift imaging of the human brain in normal volunteers. NMR Biomed, 1993. 6(3): p. 173-80.
Figures