5606
Metabolomic Analysis of Dendritic Cell Vaccination1Department of Biochemistry & Molecular Biology, University of Florida, Gainesville, FL, United States, 2Department of Neurosurgery, University of Florida, Gainesville, FL, United States, 3Mcknight Brain Institute, University of Florida, Gainesville, FL, United States, 4Department of Biochemistry and Molecular Biology, University of Florida, Gainesville, FL, United States
Synopsis
We use 1H NMR metabolomics to measure the impact of immunotherapy intended to target glioblastoma multiforme in a murine model. Cellular immunotherapy is a promising new platform for cancer treatment. Analysis of the urine of C57Bl6 mice revealed a set of metabolites associated with changes in glycolysis after immunotherapy treatment.
Target Audience
Results obtained from this study are relevant to genetics, cancer treatment, toxicology, and infectious diseases and to investigators who use urine as a metabolic readout of whole body homeostasis.Introduction
Gliblastoma multiforme (GBM) is the brain tumor with the poorest prognosis for long term survival. Besides surgical resection, chemotherapy and radiation therapies, cellular immunotherapy is a recently developed method to treat cancers, including GBM. One frequently used strategy in cellular immunotherapy is stimulation of dendritic cells (DCs) that migrate towards lymph nodes, triggering immune responses against target antigens.1 Since the potency of DC vaccine rely on migration of DC towards lymph nodes, the mice under study were injected with tetanus diphtheria (Td) toxoid or matured DCs prior DC vaccination. Previous literature showed that pre-conditioning the mice with Td toxoid elevates bilateral DC migration, leading to better anticancer specficity.2
Identifying altered metabolites in bio fluids of these DC vaccine treated animals should lead to a better understanding of diagnosis or prognosis of GBM, risk prediction and possibly the mechanism associated with GBM destruction.3 NMR based metabolite profiling of bio fluids is exquisitely sensitive to changes in metabolism, including those induced by stress or drug treatments.4 We found several metabolites that changed concentration in drug treated samples for C57BL/6 mice, among which 2-Oxoglutarate (a-ketoglutarate) was found most significant.
Methods
Models mice utilized in this study were C57BL/6. UF IACUC regulations were properly followed while handling these animals.
Vaccination: Mice were first primed with Td toxoid and then on the day before DC vaccination, infused with 10-15 millions of OT-1 splenocytes (taken from transgenic mice that have T cell receptors designed to identify OVA antigen) via tail vein. These dendritic cells were obtained by harvesting bone marrow from other mice and were grown in 8 day culture system to mature into dendritic cells. Before injecting into the mice, these dendritic cells were electroporated with OVA antigen. Ideally, these mice were supposed to develop an immune response against the OVA antigen. Urine samples from these mice were collected before vaccination, and at 24 and 48 hours of post vaccination.
Sample preparation and NMR experiment: Each sample for all the experiments consists of phosphate buffer saline (PBS) with 10 mM of Trimethylsilylpropanoic acid (TSP) as a standard internal reference. 1H NMR spectra were taken at 27 0C using a 600 MHz Bruker Avance II Console equipped with a TCI CryoProbe.5
Multivariate data analysis: MetaboAnalyst 3.0, a web based comprehensive software tool was used to perform metabolomics data analysis.6 Before running MetaboAnalyst 3.0, the 1H NMR spectra for all samples were pre-processed with MestReNova 11.0.0-17609 (Mnova). All the spectra were referenced, phased, baseline corrected, and locally aligned at 89 regions using Mnova. Water, TSP and urea signals were removed from all spectra. Binning size of 0.001 ppm was applied with probabilistic quotient normalization (PQN).7
Results and Discussion
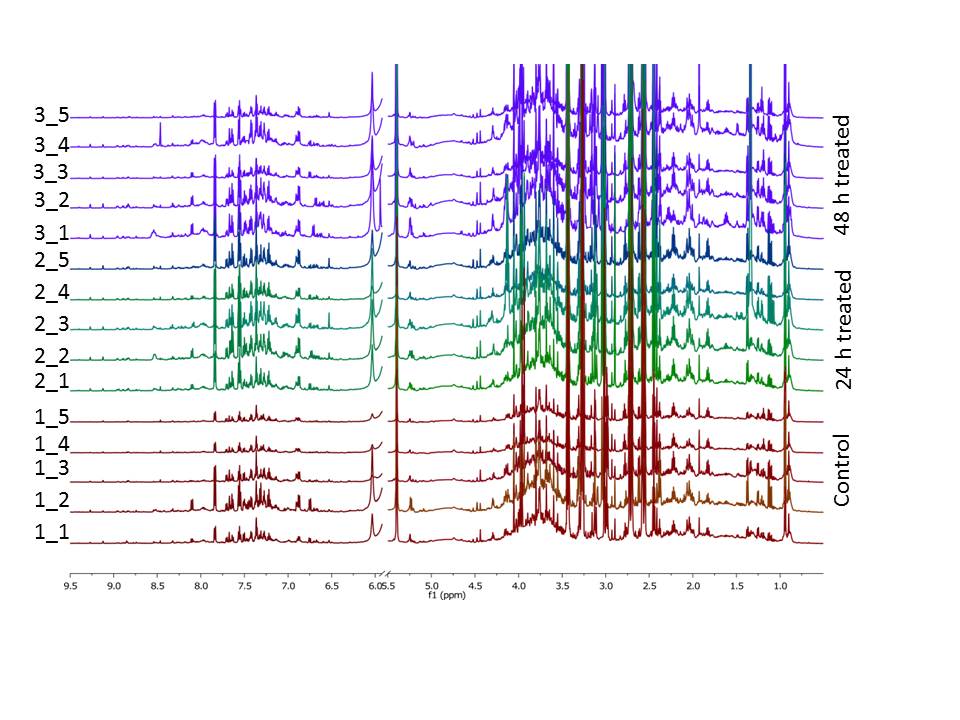
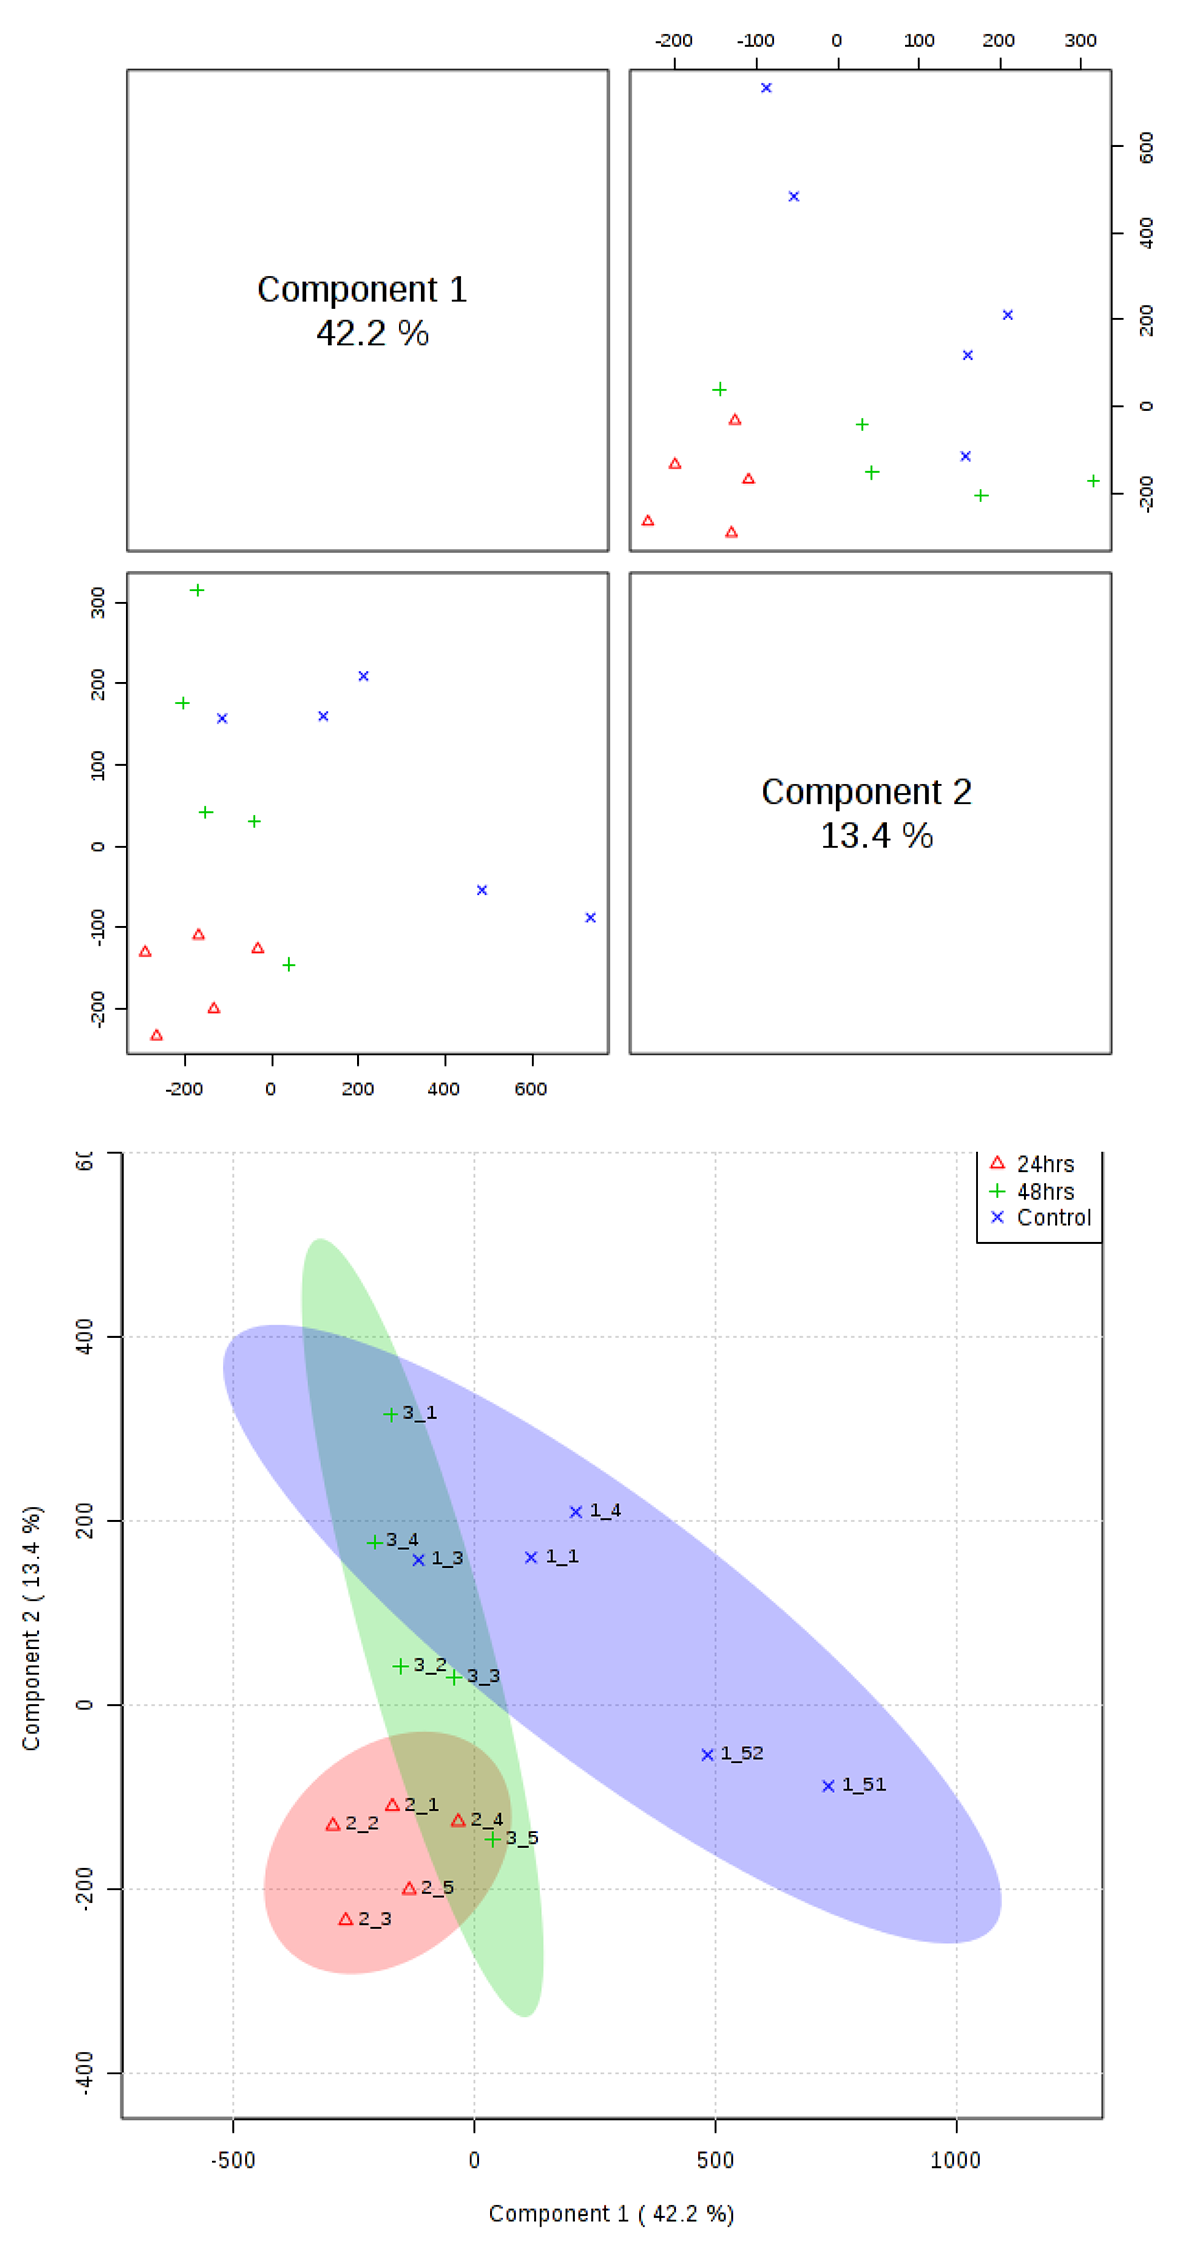
Typical pre-processed 1H spectra of urine samples before, and after 24 and 48 hours of vaccination are shown in Figure 1. The varying metabolites composition was investigated using one-way analysis of variance (ANOVA), principal components analysis (PCA) and partial least squares- discriminant analysis (PLS-DA). ANOVA found several significant chemical shifts with p value ≤ 0.05 as shown in Figure 2. While principal components analysis did not provide good separation of the samples (Figure 3 top & bottom), PLS-DA produced effective classifiers (Figure 4 top & bottom). R2/Q2 value validate the PLS-DA results, but not by permutation test (Figure 5 top & bottom, and table 1). VIP score plots from PLS-DA showed that metabolites such as 2-oxoglutarate, Taurine, Citrate, Allantoin, and Creatine were the primary indicators of metabolic perturbation by vaccination.Conclusion
Vaccination with dendritic cells results in changes in glycolytic metabolism. The next phase of these experiments will be carried out in a human trial study at UF.Acknowledgements
No acknowledgement found.References
1. Steinman, R.M.; Banchereau, J., Taking dendritic cells into medicine. Nature, 449, 419–426 (2007). 2. Sampson, J.H. et al. Tetanus toxoid and CCL3 improve DC vaccines in mice and glioblastoma patients. Nature, 519, 7543, 366-369 (2015)
3. Lee, J. et al. Metabolomic identification of biochemical changes induced by fluoxetine and imipramine in a chronic mild stress mouse model of depression. Seientific reports, 5, 8890 (2015).
4. Zheng, X. et al. Cold water forced swimming stress induced metabolic alterations in rats. Anal. Methods, 6, 4144-4151 (2014).
5. Ramaswamy, V. et al. Development of a 13C-optimized 1.5-mm high temperature superconducting NMR probe. J. Magn. Reson. 235, 58–65 (2013).
6. Xia, J.; Sinelnikov, I.; Han, B.; Wishart, D.S., MetaboAnalyst 3.0 - making metabolomics more meaningful. Nucl. Acids Res. 43, W251-257 (2015).
7. Dieterie, F.; Ross, A.; Schlotterbeck, G.; Senn, H., Probabilistic quotient normalization as robust method to account for dilution of complex biological mixtures. Application in 1H NMR metabonomics. Analytical Chemistry, 78, 4281-4290.
Figures