5605
Metabolomical NMR measurements of cell cultures: Increasing the metabolic stability of lysed cells by additional heating due to enzymatic inactivation.1Depts. Radiology and Clinical Research, University Bern, Bern, Switzerland, 2Dept. Chemistry and Biochemistry, University Bern, Bern, Switzerland, 3University Institute of Clinical Chemistry, Bern University Hospital, Bern, Switzerland, 4Pediatric Endocrinology and Diabetology of the Dept. Pediatrics & Dept. Clinical Research, University Bern, Bern, Switzerland
Synopsis
Advanced NMR measurements of biological samples may take several hours. Preanalytical issues may impact the metabolite content, potentially leading to misinterpretation. Our aim was to investigate by 1H HR-MAS NMR the impact of different cell handling preparation protocols (lysis with and without heating) on the stability of the cell metabolome over the measurement time. In lysed fibroblasts and adrenal-cells, metabolism was ongoing over-time, contrary to a stable metabolite content of the lysed-heated cells. Therefore, to minimize metabolome modifications over the measurement time, it is suggested to use cell lysis in combination with heat inactivation for extended HR-MAS NMR measurements.
Introduction
1H-HR-MAS NMR allows for metabolic characterization of biological samples. However, the accuracy of biomarker detection depends on the sample stability over the measurement time. Previously, Duarte et al. compared frozen with lysed cells1. Here we compared lysed cells with and without additional heating to investigate the effect on metabolite stability. We hypothesized that cell heating would have only a minor effect on initial metabolite content (i.e. initially similar spectra for lysed cells with and without heating) and result in increased metabolite instability over the measurement duration.Methods
Cell material: Six healthy human fibroblast cell lines, previously established from skin biopsies, and human adrenocortical NCI-H295R cells were cultured. Two samples per cell lines were collected: one sample was lysed, the second one was additionally heated (70°C) for 20min.
Spectroscopy: 1.1 million cells for fibroblasts and 10 million cells for adrenal-cells were inserted with D2O-based PBS in 4mm rotors using a 50μl insert. HR-MAS NMR experiments were performed on a Bruker Avance II spectrometer operating at 500.13MHz at 286K and 3kHz. A PROJECT pulse sequence2 with water presaturation was used for acquiring 1D 1H-NMR spectra with a TE of 117ms and 400ms, for fibroblasts and adrenal-cells, respectively. For fibroblasts, four spectra were acquired over 394min. For adrenal-cells, spectra were acquired continuously over 23hours with a time resolution of 2hours.
Data Processing & Analysis: Spectral processing was performed using Bruker TopspinTM software, including line-broadening, FFT, phasing and baseline-correction. Individual peak analysis, coefficient of variations and chemometric analysis were performed with MatLab (R2014b, The MathsWorks Inc.), PLS_Toolbox (Eigenvector Research, Inc) and Excel, using PQN-normalized individually sized buckets. Dynamics Center (Version 2.4.2, Bruker) was used to investigate the reaction and degradation kinetics of metabolites.
Results & Discussion
Variability of lysed and lysed-heated fibroblasts
Fig.1 shows early and late measured fibroblasts spectra, for both lysed and lysed-heated fibroblasts, to visualize metabolite modifications over time. The lysed-heated sample (black & red) shows almost no visible spectral change over the measurement, while the lysed sample spectra (green & blue) show stronger differences, signifying metabolite content modifications over the measurement time.
The average temporal coefficient of variation (CV) was 12.6% for lysed-heated fibroblasts, compared to significantly higher 36.7% for lysed fibroblasts (p<0.002). Confirming our hypothesis, those numbers reflect the higher stability of the metabolite content of the lysed-heated fibroblasts compared to the lysed fibroblasts, suggesting further inactivation of the metabolism by moderate heating the samples after cell lysis. The CV between lysed and lysed-heated fibroblasts at the beginning of the measurement was 35.6%, which is significantly lower than the variation at the end of the measurement (43.8%, p<0.002). This lower variability between lysed and lysed-heated fibroblasts at early measurement time-point confirms the hypothesis that the metabolite contents of lysed fibroblasts and lysed-heated fibroblasts are closer to each other at the beginning of the measurement than at the end.
Chemometric Analysis
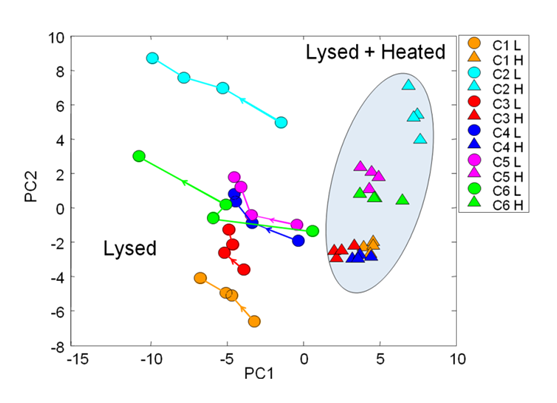
PCA results (Fig.2) provide another view of the data stability. The lysed and lysed-heated samples were completely separated on PC1 independently of the time-point. The temporal metabolite stability of lysed-heated fibroblasts was largely maintained compared to lysed fibroblasts. Fig.2 demonstrates close clustering of lysed-heated fibroblasts, in contrast to lysed fibroblasts, which showed a drift over time, further away from the corresponding lysed-heated samples. PCA results confirmed also the hypothesis that the metabolite content of lysed-heated fibroblasts is more stable over time compared to lysed fibroblasts, which are experiencing remaining on-going metabolic activities.
Time-dependent investigation of adrenal-cell metabolism
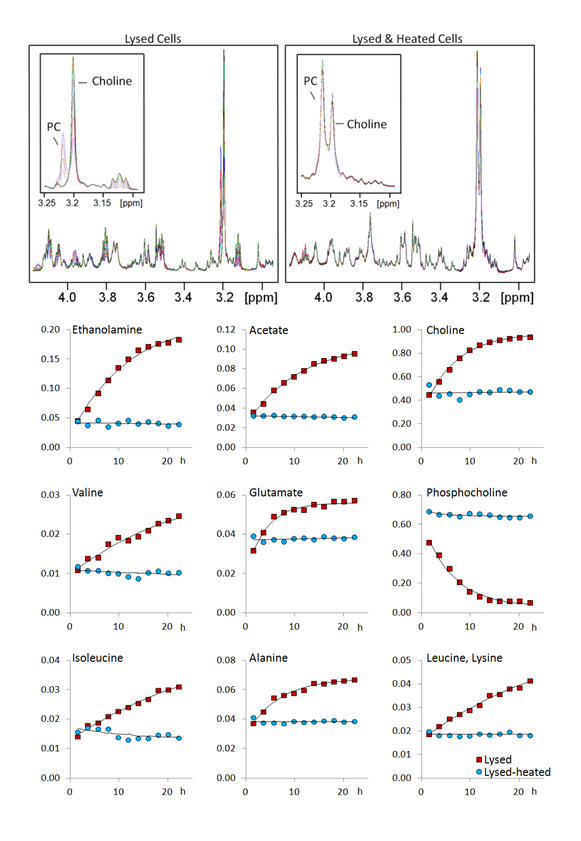
Similar to fibroblasts, the sample heating lead in adrenal-cells to moderate metabolite changes compared to lysed cell metabolites. However, much stronger metabolite changes were seen in lysed cells over time (Fig.3-Top): Over 22 hours of measurement, some metabolites from the lysed adrenal-cell sample were strongly modified, as for example choline and phosphocholine resonances around 3.2ppm (Fig.3-Top left). On the other hand, the metabolite content of the lysed-heated adrenal-cell sample was stable over the measurement time (Fig.3-Top right), suggesting that heating the sample inactivates enzymatic activity. While the initial concentrations of most metabolites were similar in lysed and lysed-heated samples (Fig.3-Bottom), they strongly changed over time in lysed samples, but remained rather constant in lysed-heated samples.
Conclusion
The impact of different cell handling preparation protocols (lysed and lysed-heated cells) on the stability of the cell metabolite content over the measurement time was investigated by 1H-HR-MAS NMR. In order to minimize metabolite content modifications over the measurement time, it is suggested to use cell lysis in combination with heat inactivation for extended HR-MAS NMR measurements.Acknowledgements
This work was supported by the UniBE ID-Grant (PV) and the Swiss National Science Foundation SNF grant # 200021_149438(MV).References
1. F. Duarte, I.Lamego, J.Marques, M.P.Marques, B.J.Blaise, A.M.Gil, J Proteome. Res. 2010, 9, 5877-5886. 2. J. A. Aguilar, M.Nilsson, G.Bodenhausen, G.A.Morris, Chemical Communications 2012, 48, 811-813.Figures
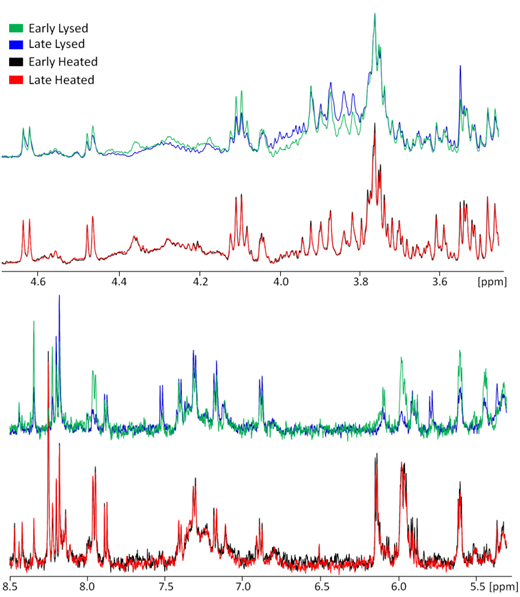
Fig. 1 Overlay of 1D mean spectra (between 3.5-4.6ppm and 5.3-8.5 ppm - visually scaled) of early and late (Δt = 394 min) lysed fibroblasts (green - Early & blue - Late) and lysed-heated fibroblasts (black - Early & red - Late) for comparison of metabolite modifications over time.