5603
Detection of Tumor Spheroid Metabolism Using Hyperpolarized Magnetic Resonance Spectroscopy1Memorial Sloan Kettering Cancer Center, New York, NY, United States, 2Hunter College, New York
Synopsis
Cell-line tumor spheroids or patient-derived organoids are 3D structures that self-organize when grown in a suitable extracellular matrix. As they mirror in vivo physiology and biology well, these structures have been used as surrogates for clinical trials. This study describes the ability to grow spheroids in NMR-compatible scaffolds that metabolize hyperpolarized [1-13C] pyruvate. These spheroids are also sensitive to AKT inhibition that manifest in significantly decreased lactate production. Histological analysis confirms on-target inhibition, demonstrating that hyperpolarized magnetic resonance spectroscopy can be used to probe treatment response in spheroids that can mimic human disease.
Purpose
Hyperpolarized NMR has greatly increased the sensitivity of detection for 13C NMR enabling rapid flux measurements of labeled metabolites in biological samples. The first hyperpolarized experiments were performed on a suspension of lymphoma cells1. Subsequent iterations used alginate encapsulated to maximise cell number over short-term culture2. While hyperpolarized studies have been performed on custom-sectioned human tissue slices3, these tissues do not remain viable for extended periods of time. The ability to measure metabolic flux in patient-derived tumor organoids or cell line-derived tumor spheroids that are 3D cultures that mimic human disease4 will allow high-throughput screening of multiple samples with distinct genetic backgrounds, providing complementary information prior to clinical trials. This study demonstrates the ability to culture tumor spheroids in NMR-compatible scaffolds and the quantification of treatment response using hyperpolarized pyruvate.Materials and Methods
LnCAP prostate spheroids were obtained by seeding a solution of 1:1 sodium alginate:Matrigel at 1x10⁵cells/ml and loading into hollow fibers (A/G Technology Corporation, NY) and dropped into a 100mM CaCl2 solution to polymerize and culture over at least 10 days. [1-13C] pyruvate were prepared for HP according to published reports using a prototype SpinLab (General Electric, NY) before dissolving to a final concentration of 5mM. Spectra were acquired on a 1T Magritek spectrometer (Magritek, San Diego, CA) using a 10o flip angle every 5 s for 25 scans. The sum of all spectra was quantified by taking the ratio of lactate to pyruvate hydrate and was normalized to the amount of DNA present.Results
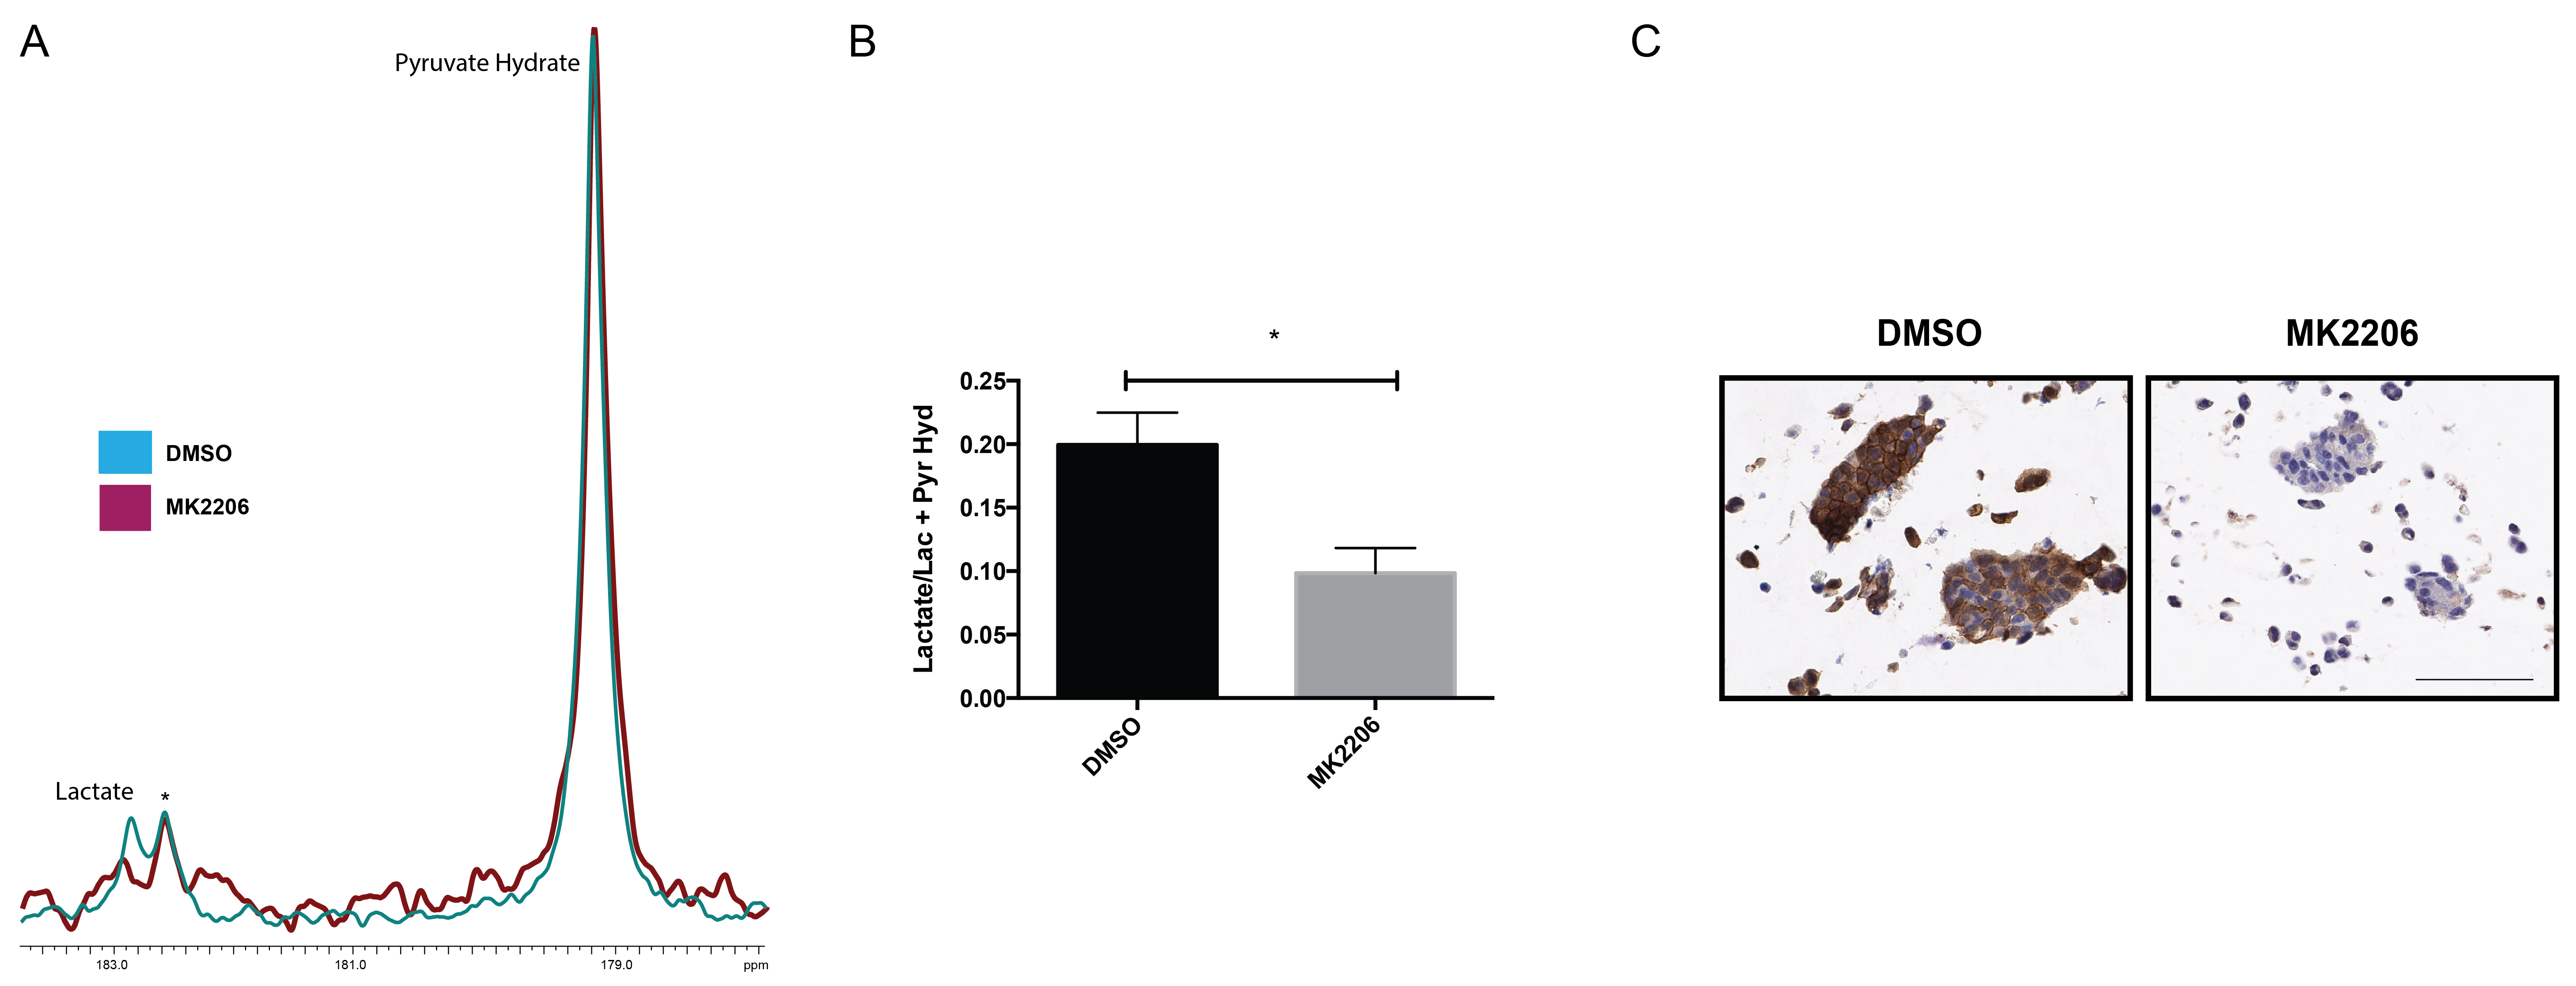
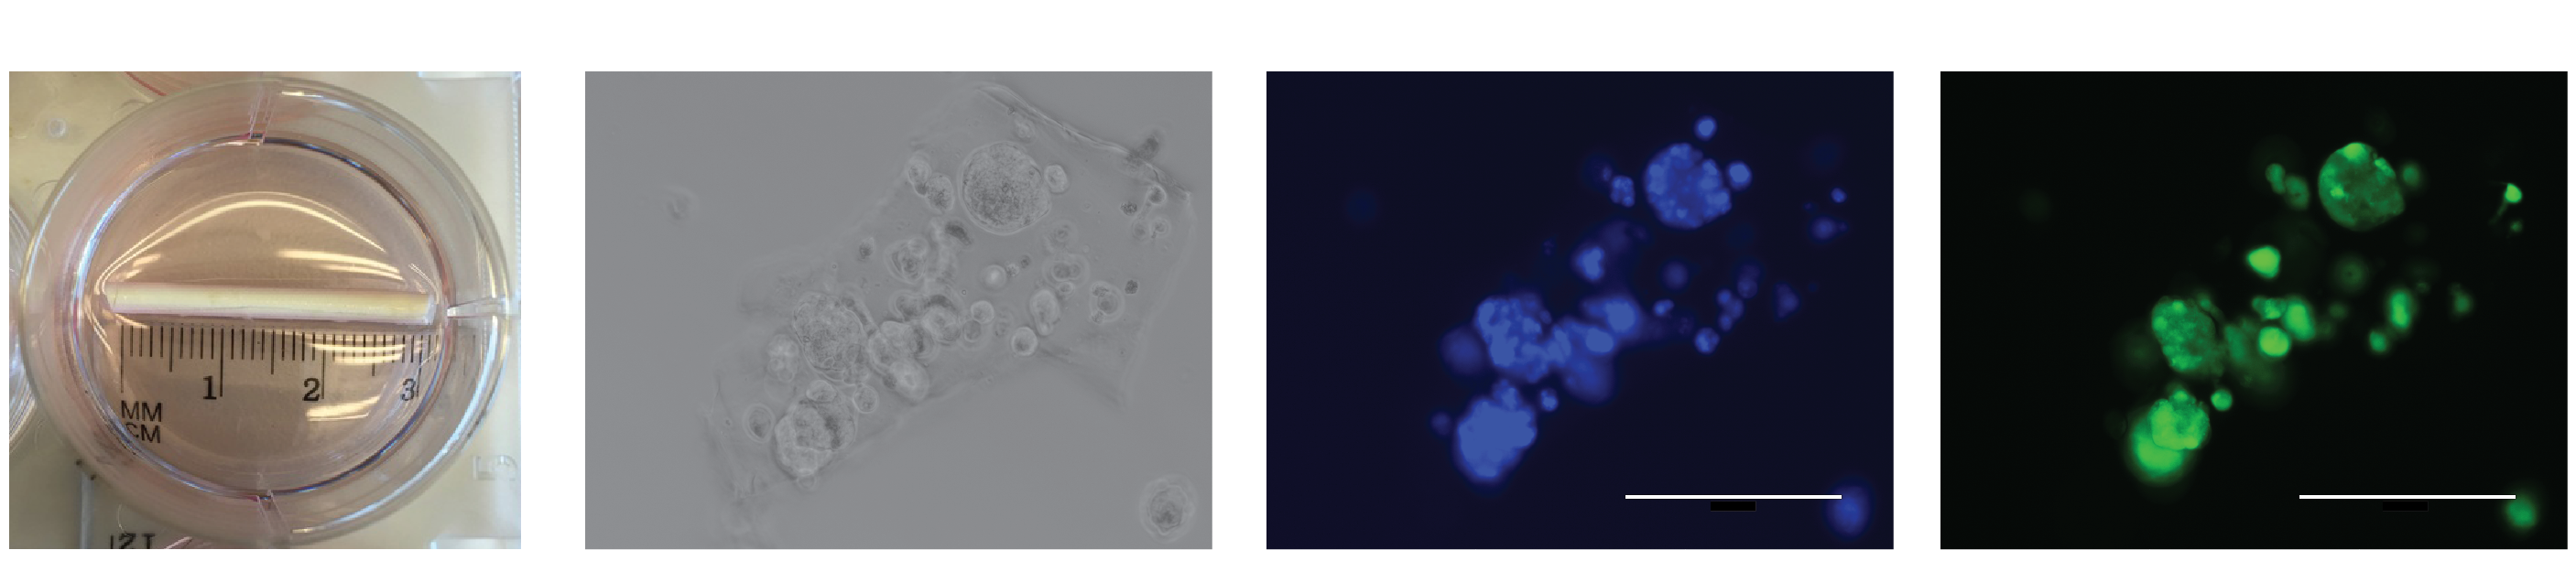
LnCAP cells were cultured in porous hollow fibers that are compatible with NMR studies (Fig. 1A). Spheroids readily form clusters up to 100µm (Fig. 1B) after approximately 10 days of culture in a rotating incubator. These clusters are closely associated, multi-cellular structures as evidenced by nuclear staining (Fig. 1C) and are viable when probed with calcein-AM, a cell-permeant viability dye (Fig. 1D). As a proof of concept that hyperpolarized MRS enables measurement of metabolic flux in tumor spheroids, hollow fibers were treated either with vehicle (DMSO) or a pan-AKT inhibitor, MK2206. Vehicle-treated spheroids demonstrated production of lactate, and lactate production is reduced in MK2206-treated spheroids by approximately 30% as shown in Fig. 2A and 2B (n=3 each condition, p < 0.05). Immunohistochemistry of spheroids revealed reduction phospho-AKT staining at residue serine 473, demonstrating specific, on-target inhibition by MK2206.Discussion
Hyperpolarized measurements performed on cell cultures have either been in suspension or encapsulation of large quantities of cells, neither of which recapitulate in vivo physiology. This study demonstrates that lower initial cell seeding densities give rise to spheroids that self-organize in the presence of an extracellular matrix. Significantly, we have adopted a porous scaffold that enables long-term culture and also possess physical dimensions suitable for NMR. The porous hollow fiber material allowed rapid diffusion of hyperpolarized pyruvate through the membrane even though the outer diameter of the hollow fiber is approximately 1mm. Additionally, there is no requirement to culture spheroids in the spectrometer or magnet, ensuring ease of use where the hollow fiber is directly dropped into an NMR tube immediately before dissolution. This technique can be easily translated for use with human-derived tissue to form organoids that have proven to be informative in neurology5, stem cell biology6 as well as oncology7. To demonstrate the utility of this model, we selected a pan-AKT inhibitor. AKT has been called the master regulator of metabolism and we observed a decrease of lactate production from hyperpolarized pyruvate. The ability to subsequently retrieve the hollow fiber enabled histological slices to be obtained. Besides pharmacological inhibition in oncology, spheroid and organoid metabolism can also be modulated using growth factors, distinct extracellular matrices as well as co-culture with different cell types and subsequently probed with a range of hyperpolarized metabolites.Conclusion
Biological samples such as tumor spheroids can be grown in physiologically-relevant extracellular matrices over extended periods of time in porous hollow fibers to enable measurements using hyperpolarized NMR. Metabolic perturbations using clinically relevant drugs can be quantified and later verified using immunohistochemistry.Acknowledgements
This research was funded in part through the NIH/NCI Cancer Center Support Grant P30 CA008748 and NIH/NIBIB R00 EB014328 as well as Memorial Sloan Kettering’s Center for Molecular Imaging and Nanotechnology (CMINT).References
1 Day, S. E., Kettunen, M. I., Gallagher, F. A. et al. Detecting tumor response to treatment using hyperpolarized C-13 magnetic resonance imaging and spectroscopy. Nat Med 13, 1382-1387, doi:10.1038/nm1650 (2007).
2 Keshari, K. R., Kurhanewicz, J., Jeffries, R. E. et al. Hyperpolarized C-13 Spectroscopy and an NMR-Compatible Bioreactor System for the Investigation of Real-Time Cellular Metabolism. Magnetic Resonance in Medicine 63, 322-329, doi:10.1002/mrm.22225 (2010).
3 Keshari, K. R., Sriram, R., Van Criekinge, M. et al. Metabolic Reprogramming and Validation of Hyperpolarized C-13 Lactate as a Prostate Cancer Biomarker Using a Human Prostate Tissue Slice Culture Bioreactor. Prostate 73, 1171-1181, doi:10.1002/pros.22665 (2013).
4 Fatehullah, A., Tan, S. H. & Barker, N. Organoids as an in vitro model of human development and disease. Nat Cell Biol 18, 246-254 (2016).
5 Qian, X. Y., Nguyen, H. N., Song, M. M. et al. Brain-Region-Specific Organoids Using Mini-bioreactors for Modeling ZIKV Exposure. Cell 165, 1238-1254, doi:10.1016/j.cell.2016.04.032 (2016).
6 Kretzschmar, K. & Clevers, H. Organoids: Modeling Development and the Stem Cell Niche in a Dish. Dev Cell 38, 590-600, doi:10.1016/j.devcel.2016.08.014 (2016).
7 Gao, D., Vela, I., Sboner, A. et al. Organoid cultures derived from patients with advanced prostate cancer. Cell 159, 176-187, doi:10.1016/j.cell.2014.08.016 (2014).
Figures