5602
A Very Low-cost EPR Spectrometer Using 3D Design and ManufacturingBahareh Behzadnezhad1,2, Jian Dong1, Nader Behdad1, and Alan McMillan2
1Dept of Electrical and Computer Engineering, University of Wisconsin-Madison, Madison, WI, United States, 2Dept of Radiology, University of Wisconsin-Madison, Madison, WI, United States
Synopsis
This study describes a very low-cost EPR spectrometer that can be feasibly constructed using general purpose laboratory equipment combined with the use of 3D electromagnetic design and additive manufacturing. We demonstrate a functioning, homebuilt, low-cost continuous wave EPR spectrometer operating at 115 MHz. The development of a low-cost spectrometer has applications in education and for other general laboratory purposes.
Purpose
The purpose of this study is to demonstrate that a low-cost EPR spectrometer can be constructed by leveraging additive manufacturing to build various system components. Herein, we demonstrate a homebuilt, low-cost continuous wave (CW) EPR spectrometer operating at 115 MHz where the structure of electromagnetic components (modulation coils and resonator) have been constructed using additive manufacturing (3D printing).Methods
The block diagram of the constructed CW EPR spectrometer is shown in Figure 1. Components of the spectrometer can be divided into three categories: (1) Electromagnetic Components including the main electromagnet, modulation coil, and radio frequency (RF) resonator, (2) RF bridge, and (3) Data acquisition system. (1) The main magnet was wound with a single layer of 140 turns of #12 copper wire on a 30-cm polycarbonate tube. The electromagnet provides 4.1 mT magnetic field (corresponding to a 115 MHz EPR frequency) at 15 amps using a DC programmable power supply (XFR 150-18, AMETEK, San Diego, CA). The modulation field is generated with a Helmholtz coil (coil diameter of 11 cm) for which the frame was constructed using additive manufacturing from ABS plastic filament on an available 3D printer (Creator X, Flashforge, Rowland Heights, CA). The modulation coil was driven by an audio-frequency amplifier. The RF resonator uses a parallel loop configuration in conjunction with a capacitive impedance matching network similar to designs previously utilized for EPR spectroscopy/imaging1. Full-wave electromagnetic simulations in CST Studio (Darmstadt, Germany) were used to design and simulate the parallel loop structure, including the material properties (e.g., dielectric loss, thermal, and mechanical properties) of all resonator components. The mechanical design of loop’s supporting structure was then 3D printed in ABS plastic. The simulated scattering parameter (S-parameters) of the loop were then exported into electronic design software ADS (Keysight Technologies, Santa Rosa, CA) to design and optimize the resonator as well as to determine component values of the capacitive impedance matching network. Figure 2 shows the simulated and fabricated parallel loop resonator and the modulation coil. Figure 3 shows the measured reflection coefficient (S11) of the resonator. (2) The RF bridge (shown in Figure 4) is a homodyne reflection-type bridge using a double balanced mixer as detector to ensure that signal phase information can be accurately measured. A 180° hybrid coupler was used to direct signal to and from the resonator and provide 40 dB decoupling between source and detector. A 16dB attenuator was used in the reference arm and the required phase shift was attained by adjusting the cable length. A signal generator (AFG 3251, Tektronix, Beaverton, OR) was used as the main RF source. (3) Data acquisition is based on a commercially available lock-in amplifier (AMETEK 7230) connected to a PC via an Ethernet connection. Custom software written in MATLAB (The Mathworks, Natick, MA) was used to control the lock-in amplifier. The oscillator of the lock-in amplifier was used to generate the modulation signal (at 20 kHz, chosen based on the phase noise measurements of the RF source). An auxiliary digital-to-analog (DAC) signal from the lock-in amplifier was used to control the field sweep of the main magnet. To evaluate the prototype spectrometer, a sample of DPPH powder (D9132, Sigma Aldrich) was placed in the resonator and the EPR spectra was measured at a transmit power of 10 dBm.Results
Figure 5 shows the measured EPR spectrum of DPPH in the prototype spectrometer using 100 points and averaging. Measurements were performed using a B0 field sweep between 3 to 5.5 mT and the total measurement time was approximately 5 minutes.Discussion and Conclusion
This abstract demonstrates the design and construction of a low-cost, homebuilt EPR spectrometer. Such a system can be designed and implemented quickly with very low cost for educational or general laboratory purposes. When existing general purpose laboratory equipment can be utilized (e.g., DC power supply, signal generator, lock-in amplifier, 3D printer), the remaining costs of constructing an operating EPR spectrometer can be very low (less than $2,500 USD for the system presented here). The entire process is enhanced by the use of 3D design, where the mechanical structure of components can be designed and subsequently imported into EM simulation software to perform rapid design iteration of highly optimized electromagnetic components prior to construction. Additive manufacturing provides a low-cost and rapid means to construct these components. Future work includes the development of the spectrometer at higher B0 field strengths as well application of the 3D design and additive manufacturing techniques to construct gradient coils to extend the device to imaging.Acknowledgements
The project described was supported by the Clinical and Translational Science Award (CTSA) program, through the NIH National Center for Advancing Translational Sciences (NCATS), grant UL1TR000427. The content is solely the responsibility of the authors and does not necessarily represent the official views of the NIH.References
1- Devasahayam, N., et al. "Parallel coil resonators for time-domain radiofrequency electron paramagnetic resonance imaging of biological objects." Journal of Magnetic Resonance 142.1 (2000): 168-176.Figures
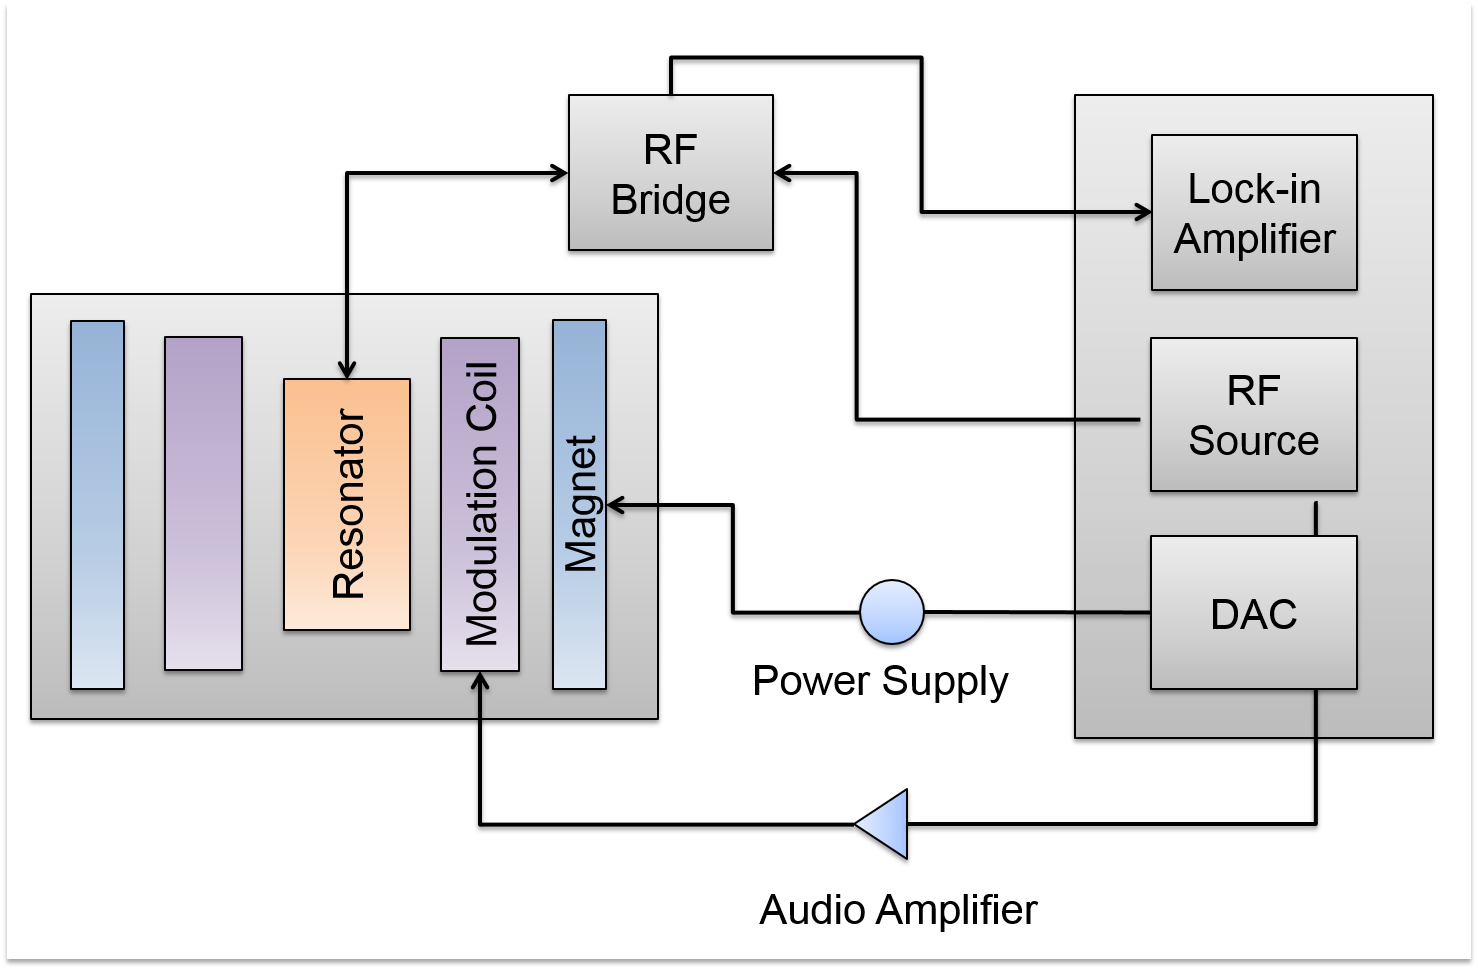
Overall block diagram of the homebuilt CW EPR
spectrometer.
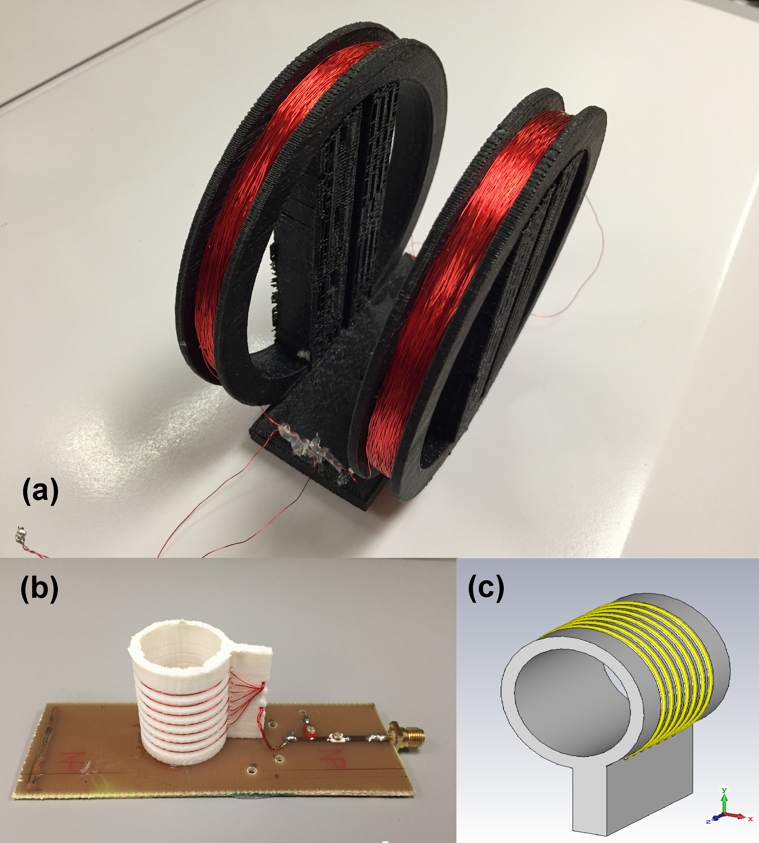
Electromagnet elements of the homebuilt
spectrometer constructed using additive manufacturing. (a) Modulation coil. (b-c). Parallel
loop resonator.
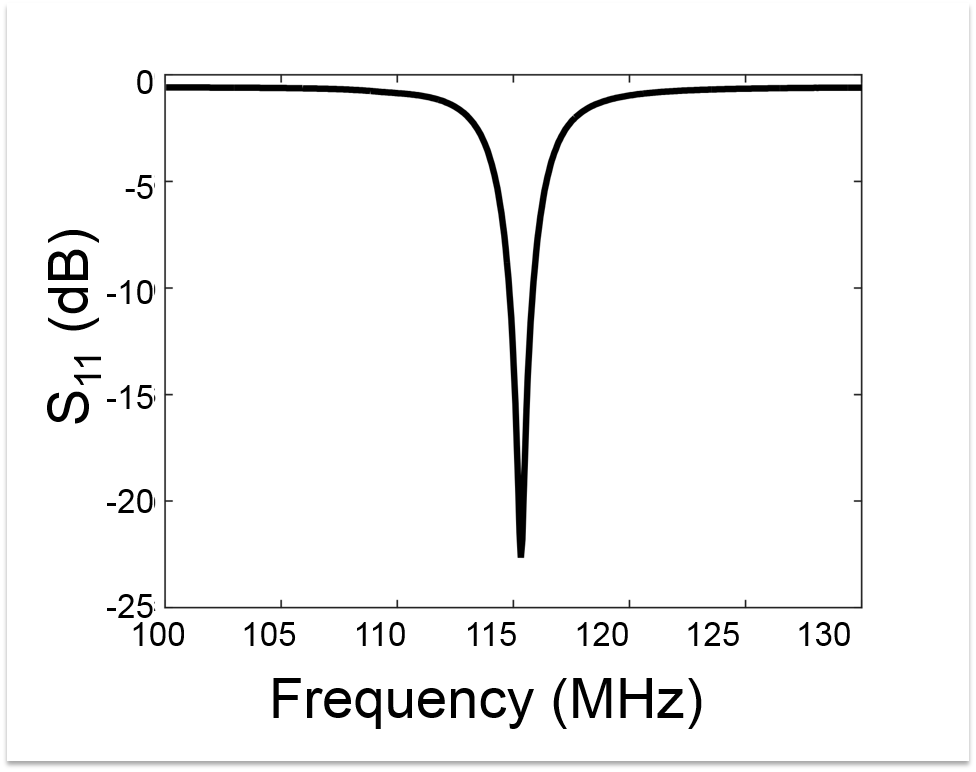
Measured input reflection coefficient (S11)
of the constructed parallel loop resonator.
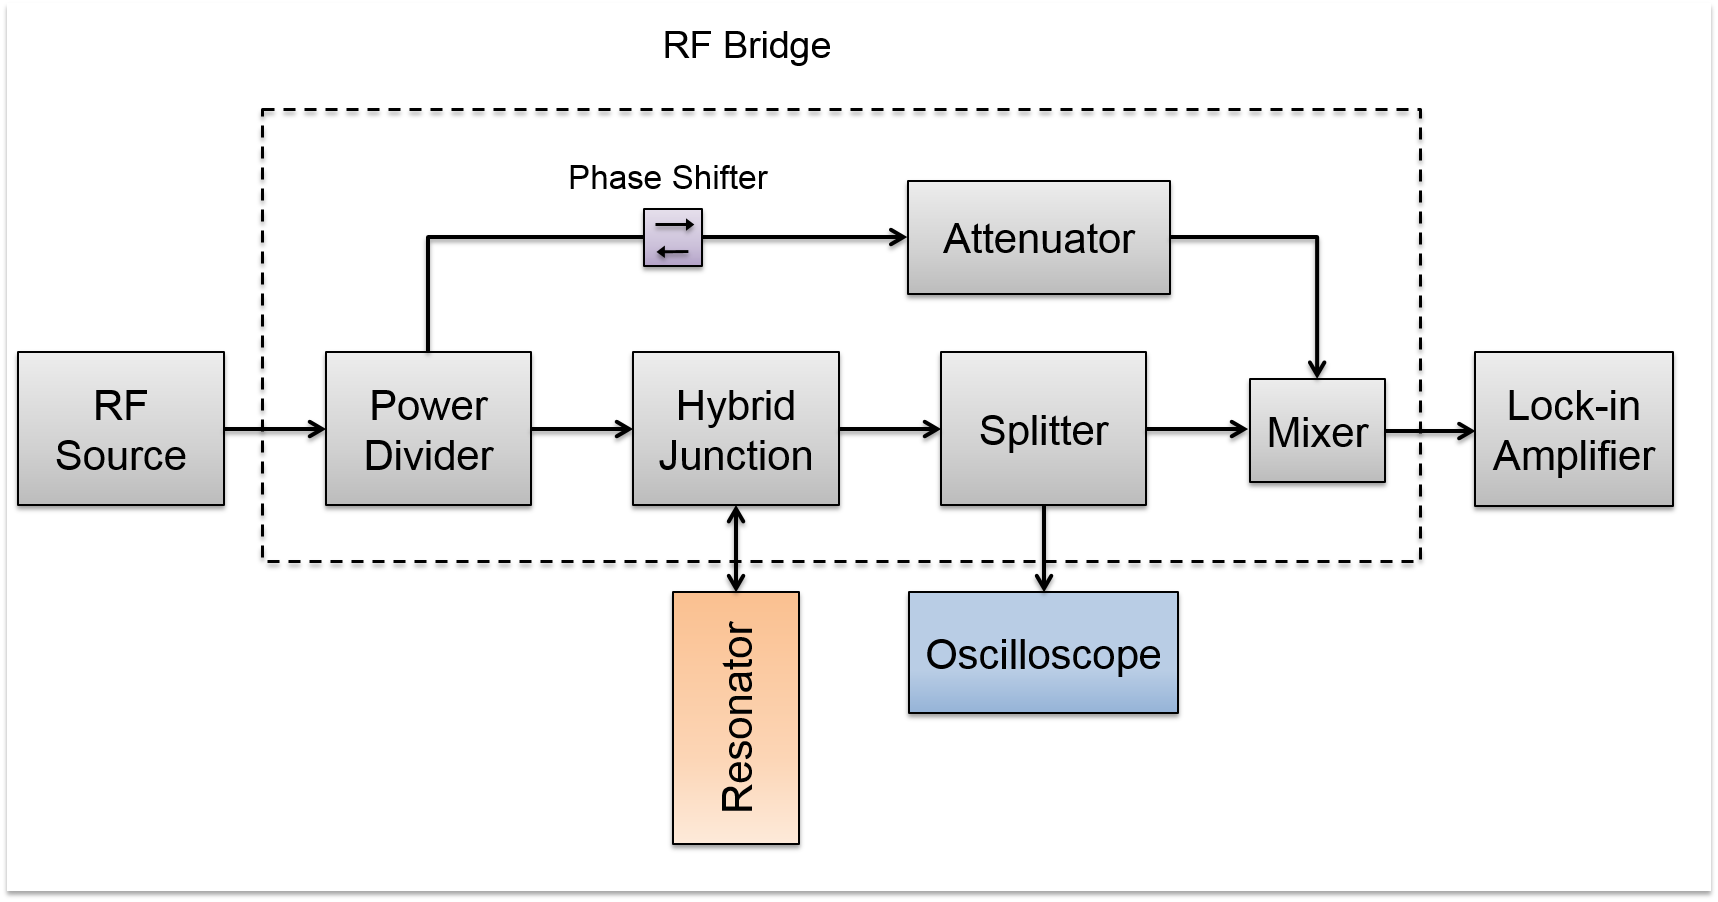
Block diagram of the RF bridge.
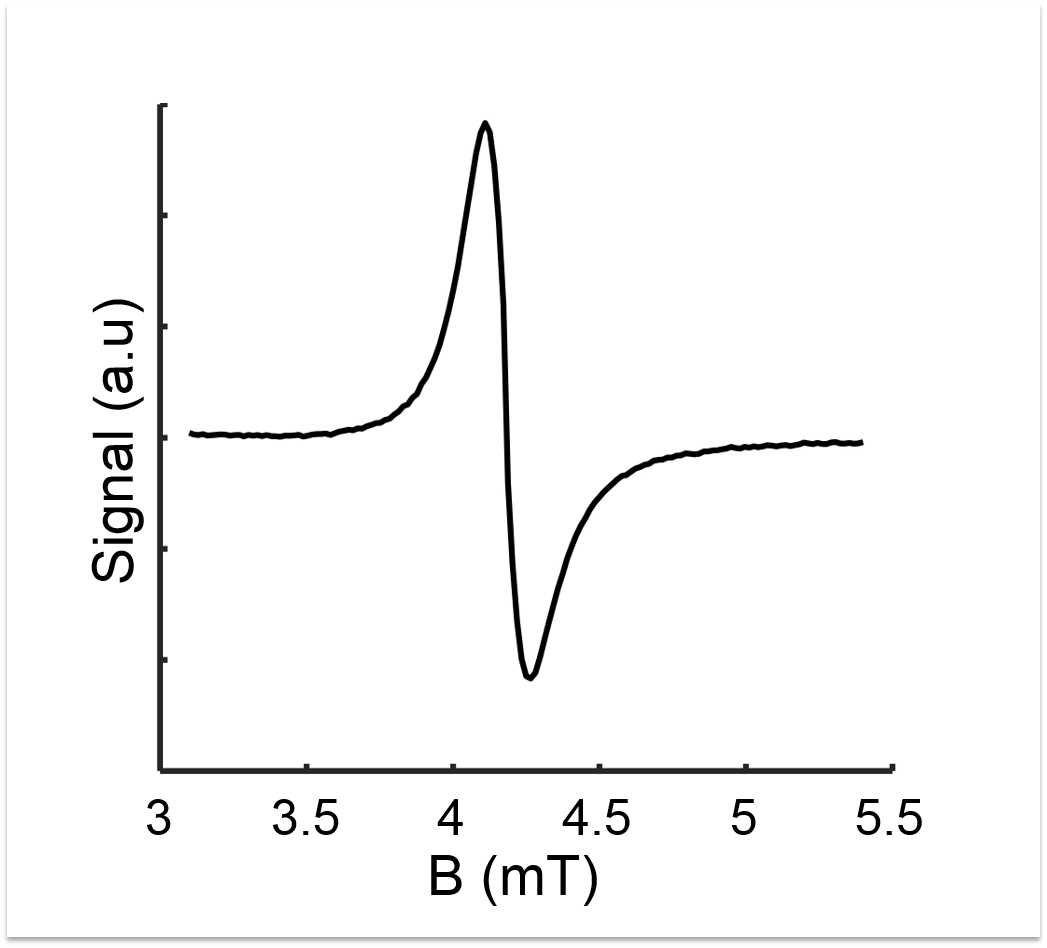
Measured spectrum of
1,1-diphenyl-2-picrylhydrazyl (DPPH) on the homebuilt spectrometer.