5601
Phenformin Induces Profound Metabolic Changes in Lung Cancer Cells1Radiology, JOHNS HOPKINS UNIVERSITY, BALTIMORE, MD, United States, 2Department of Pathology, The Johns Hopkins University School of Medicine, Baltimore, MD, United States, 3JHU ICMIC Program, Division of Cancer Imaging Research, The Russell H. Morgan Department of Radiology and Radiological Science, The Johns Hopkins University School of Medicine, Baltimore, MD, United States, 4Sidney Kimmel Comprehensive Cancer Center, The Johns Hopkins University School of Medicine, Baltimore, United States
Synopsis
Lung cancer is a leading cause of cancer associated death in United States and worldwide. Non-small cell lung cancer (NSCLC) accounts for 85% of all lung cancer cases in the United States. Use of metformin is associated with improved cancer treatment outcomes, reduction in cancer incidence and decreased mortality, and because of a higher potency, phenformin may be a more promising anti-cancer agent. Here, we have used 1H MRS of cell extracts to investigate the effect of phenformin on A549 cells. Significant metabolic changes were observed following phenformin treatment
Introduction
Lung cancer is a leading cause of cancer associated death in United States and worldwide. Non-small cell lung cancer (NSCLC) accounts for 85% of all lung cancer cases in the United States.1 Treatment of NSCLC with metformin is associated with improved cancer outcomes, reduction in cancer incidence and decreased mortality2. Phenformin is another biguanide with a potency of 50% higher than metformin. Due to lactate acidosis, phenformin use in diabetic patients was withdrawn since 19703. Metformin directly inhibits the mitochondrial complex I that supports proliferation through nicotinamide adenine dinucleotide (NAD+) regeneration to maintain cellular NAD+/NADH balance and allow aspartate biosynthesis. Gui et. al. showed that the anti-proliferative activity of metformin was caused by a decrease in the NAD+/NADH ratio and aspartate levels2. Here we have treated the NSCLC cell line A549 with phenphormin (10µM) and measured aspartate levels in cells and media by 1H MRS. A significant changes in 1H MRS derived metabolites were detected following phenformin treatment.Methods
The human NSCLC cancer cell line, A549 was obtained from ATCC. Cells were maintained in RPMI 1640 medium (Mediatech, Manassas, VA) at 37°C incubator. Three sets of 3.5X10⁶ cells each of control and phenformin treatment (10µM for 16 hours) were used for 1H MRS analysis. Cells were sonicated in D2O phosphate buffer saline under ice cold condition for 5 min to dissolve the cell polar metabolites. Cell lysate was then centrifuged and supernatant was subjected for 1H MRS analysis. Fresh RPMI and media from culture flask were collected centrifuged to remove any suspension. 300µL of medium was mixed with 300µL D2O PBS, vortexed, centrifuged and supernatant was used for 1H MRS analysis. High-resolution proton 1H MRS was performed on an Avance III 750 MHz Bruker MR spectrometer equipped with a 5 mm broad band inverse probe. Carr-Purcell-Meiboom-Gill (CPMG) pulse sequence with water suppression [PRESET-90°-(d-180-d)n-Aq] was performed to remove short T2 components arising due to the presence of proteins as well as to obtain a better baseline in the spectra4. Spectra were acquired using the following parameters: spectral width of 15495.86 Hz, data points of 64 K, 90° flip angle, relaxation delay 10 sec, acquisition time 2.11 sec, 64 scans with 8 dummy scans, receiver gain 80.6. Spectral acquisition, processing and quantification were performed using TOPSPIN 2.1 software.Results & Discussion
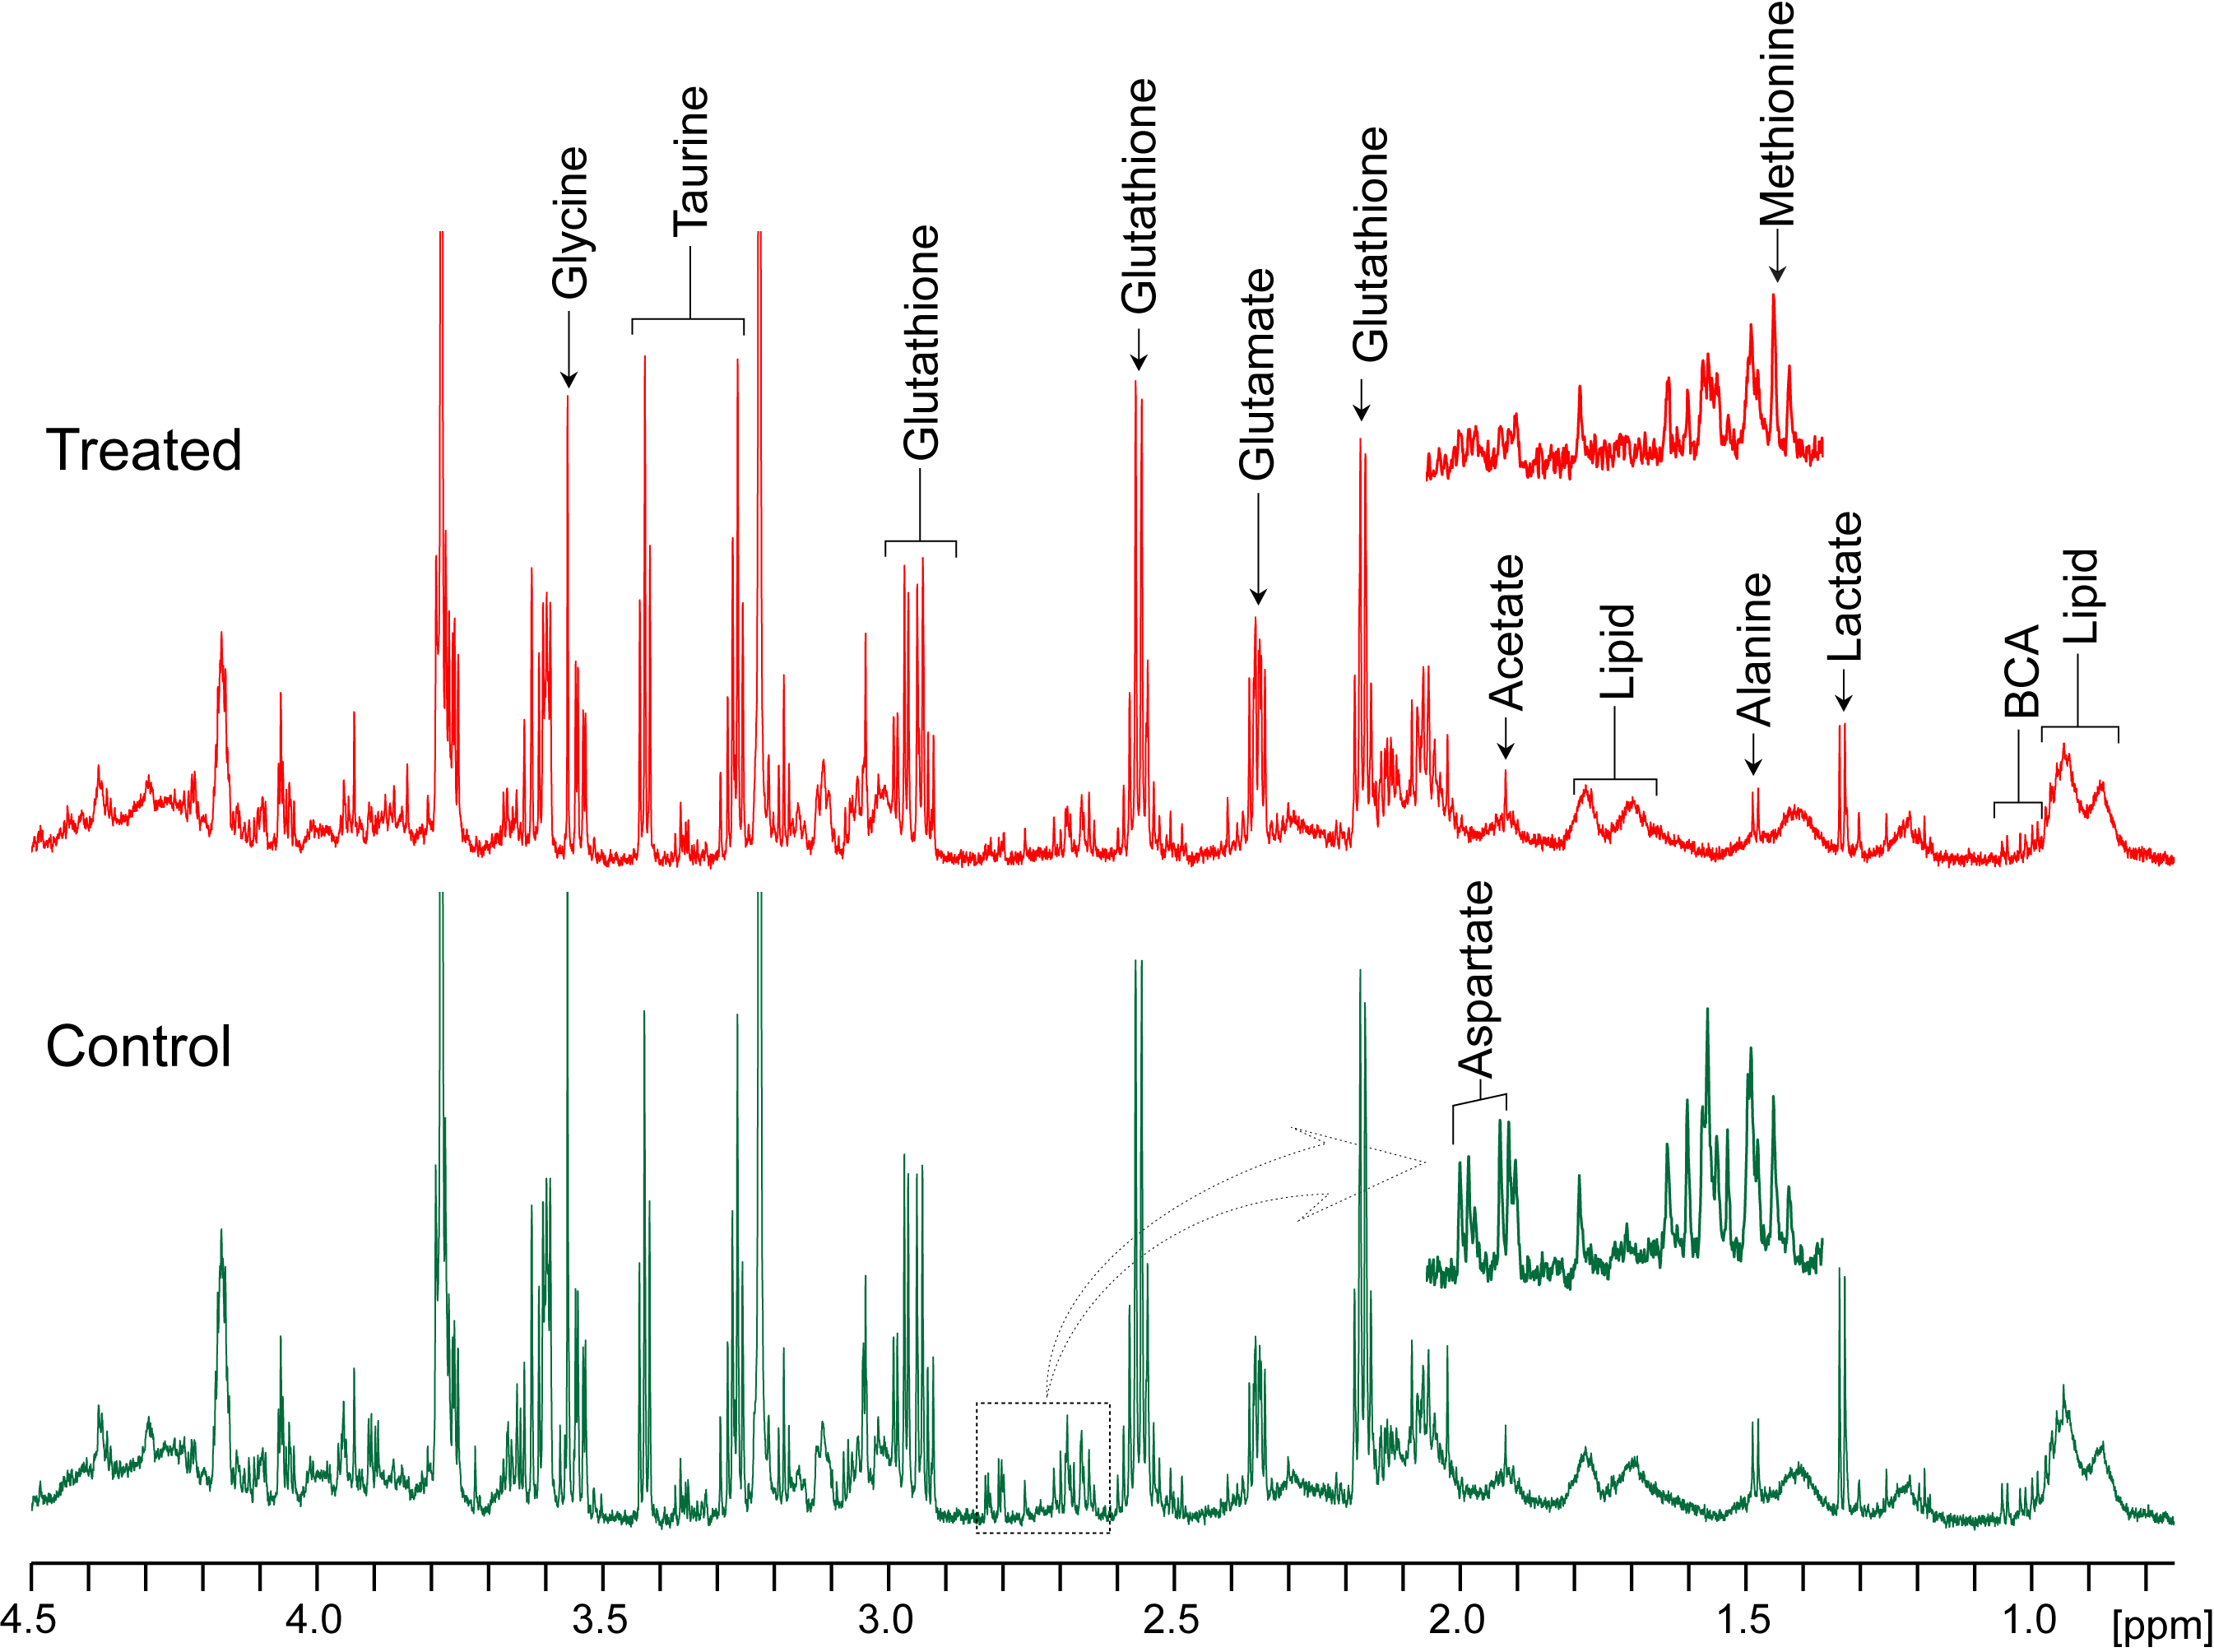
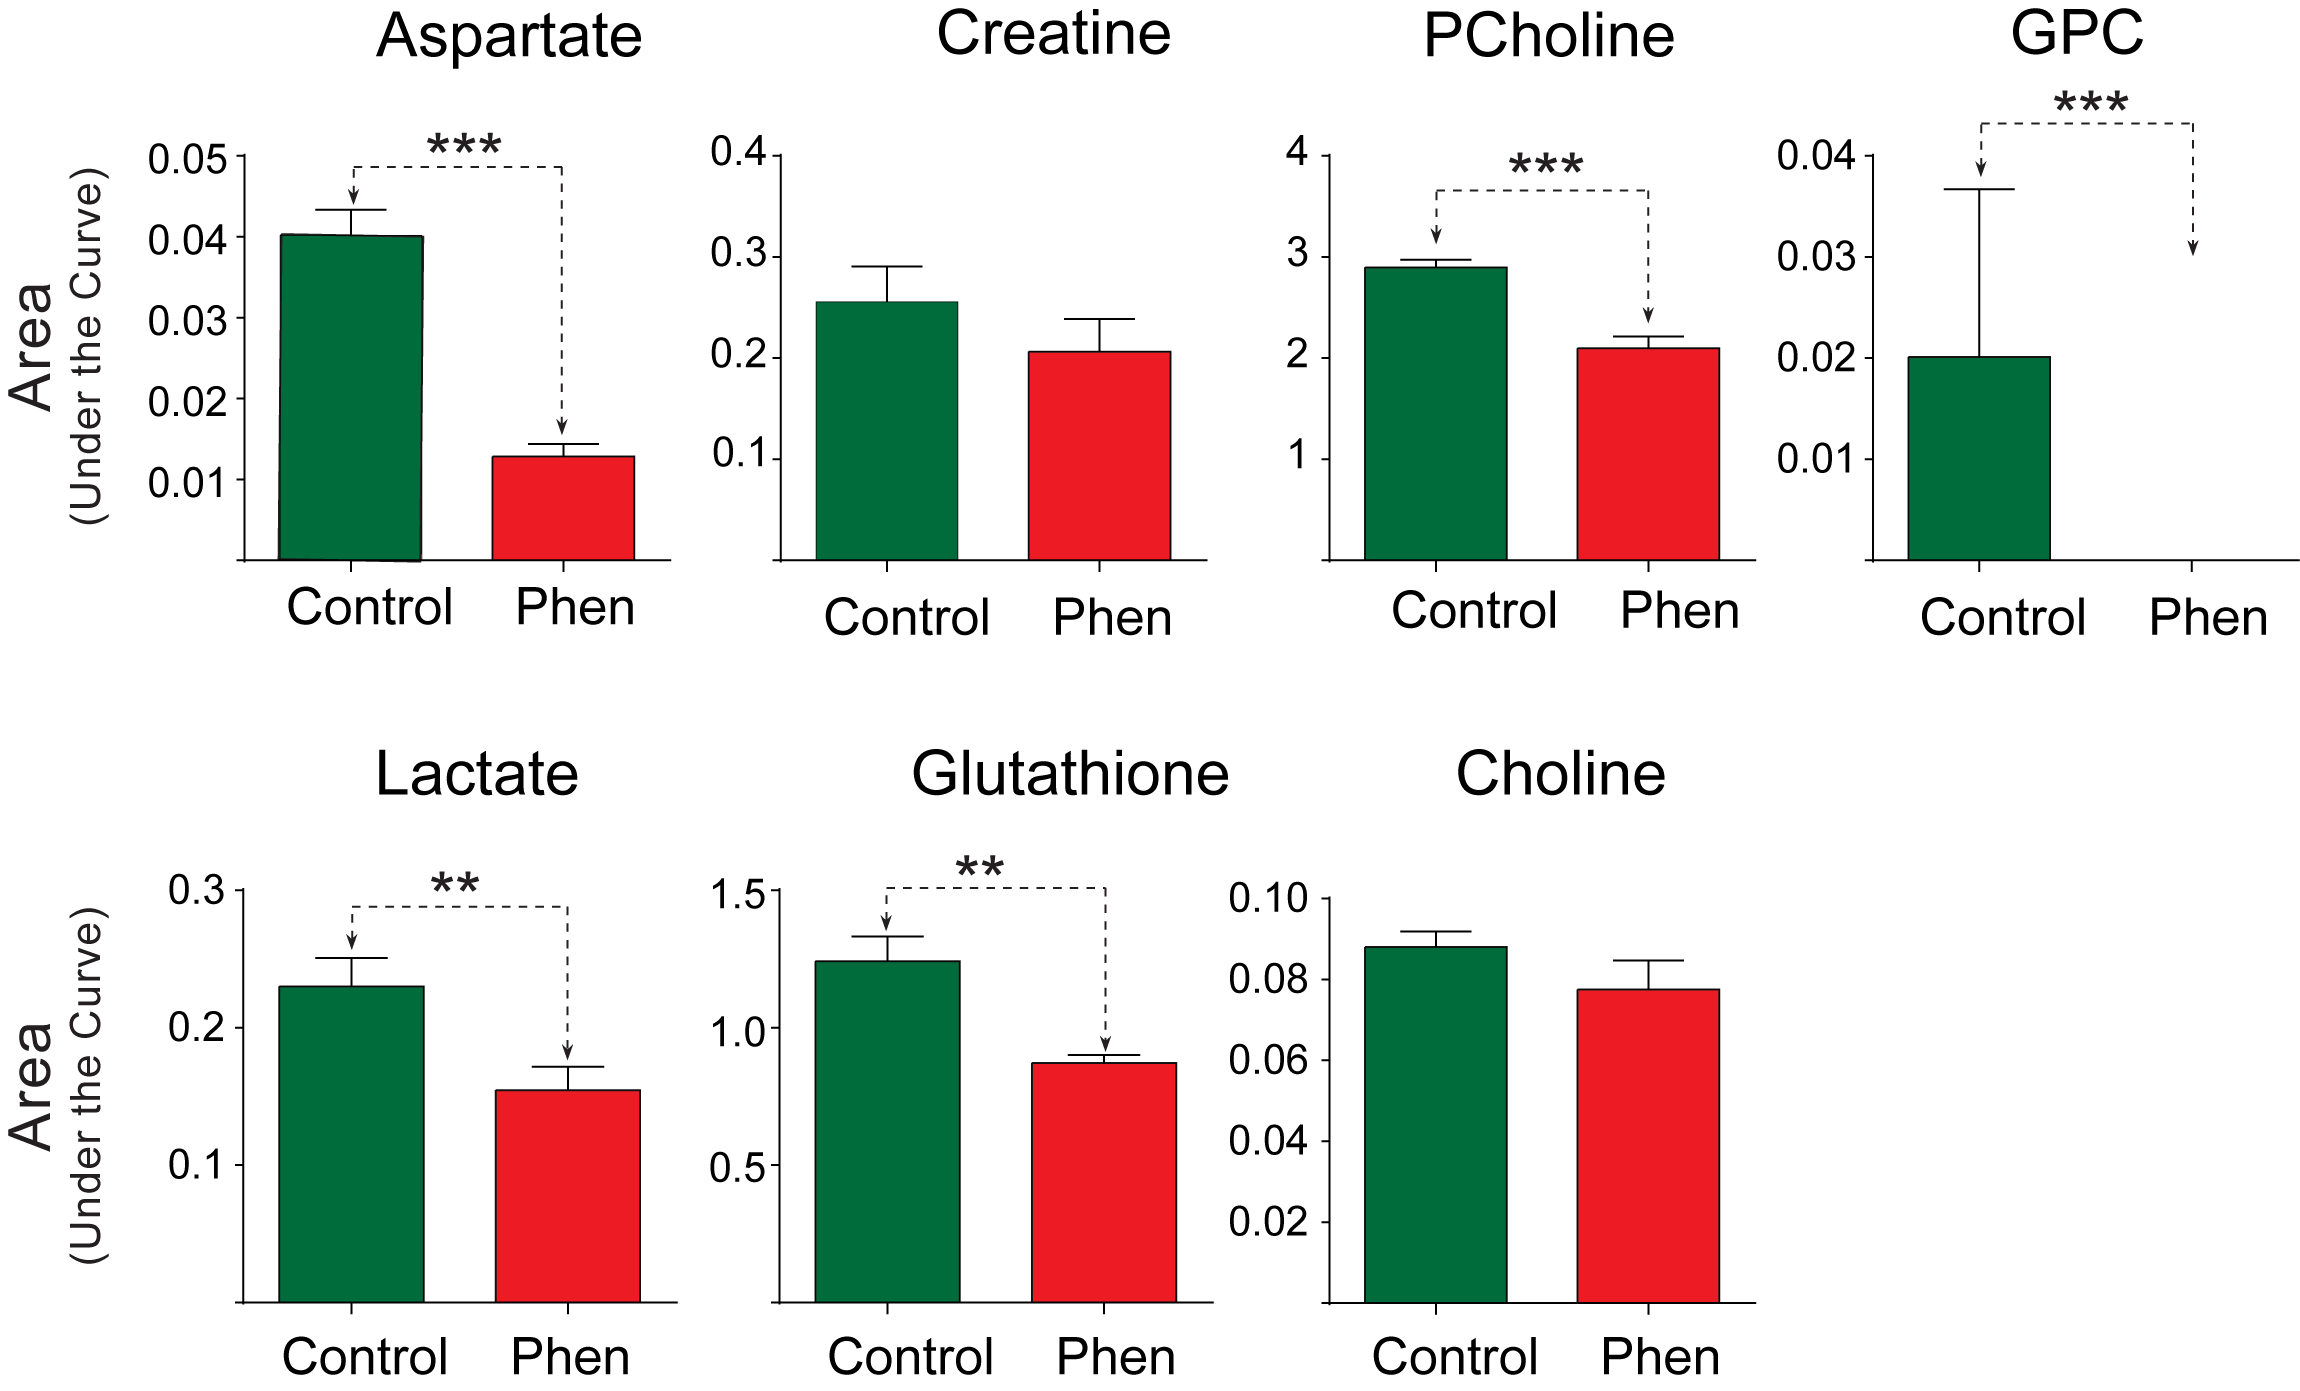
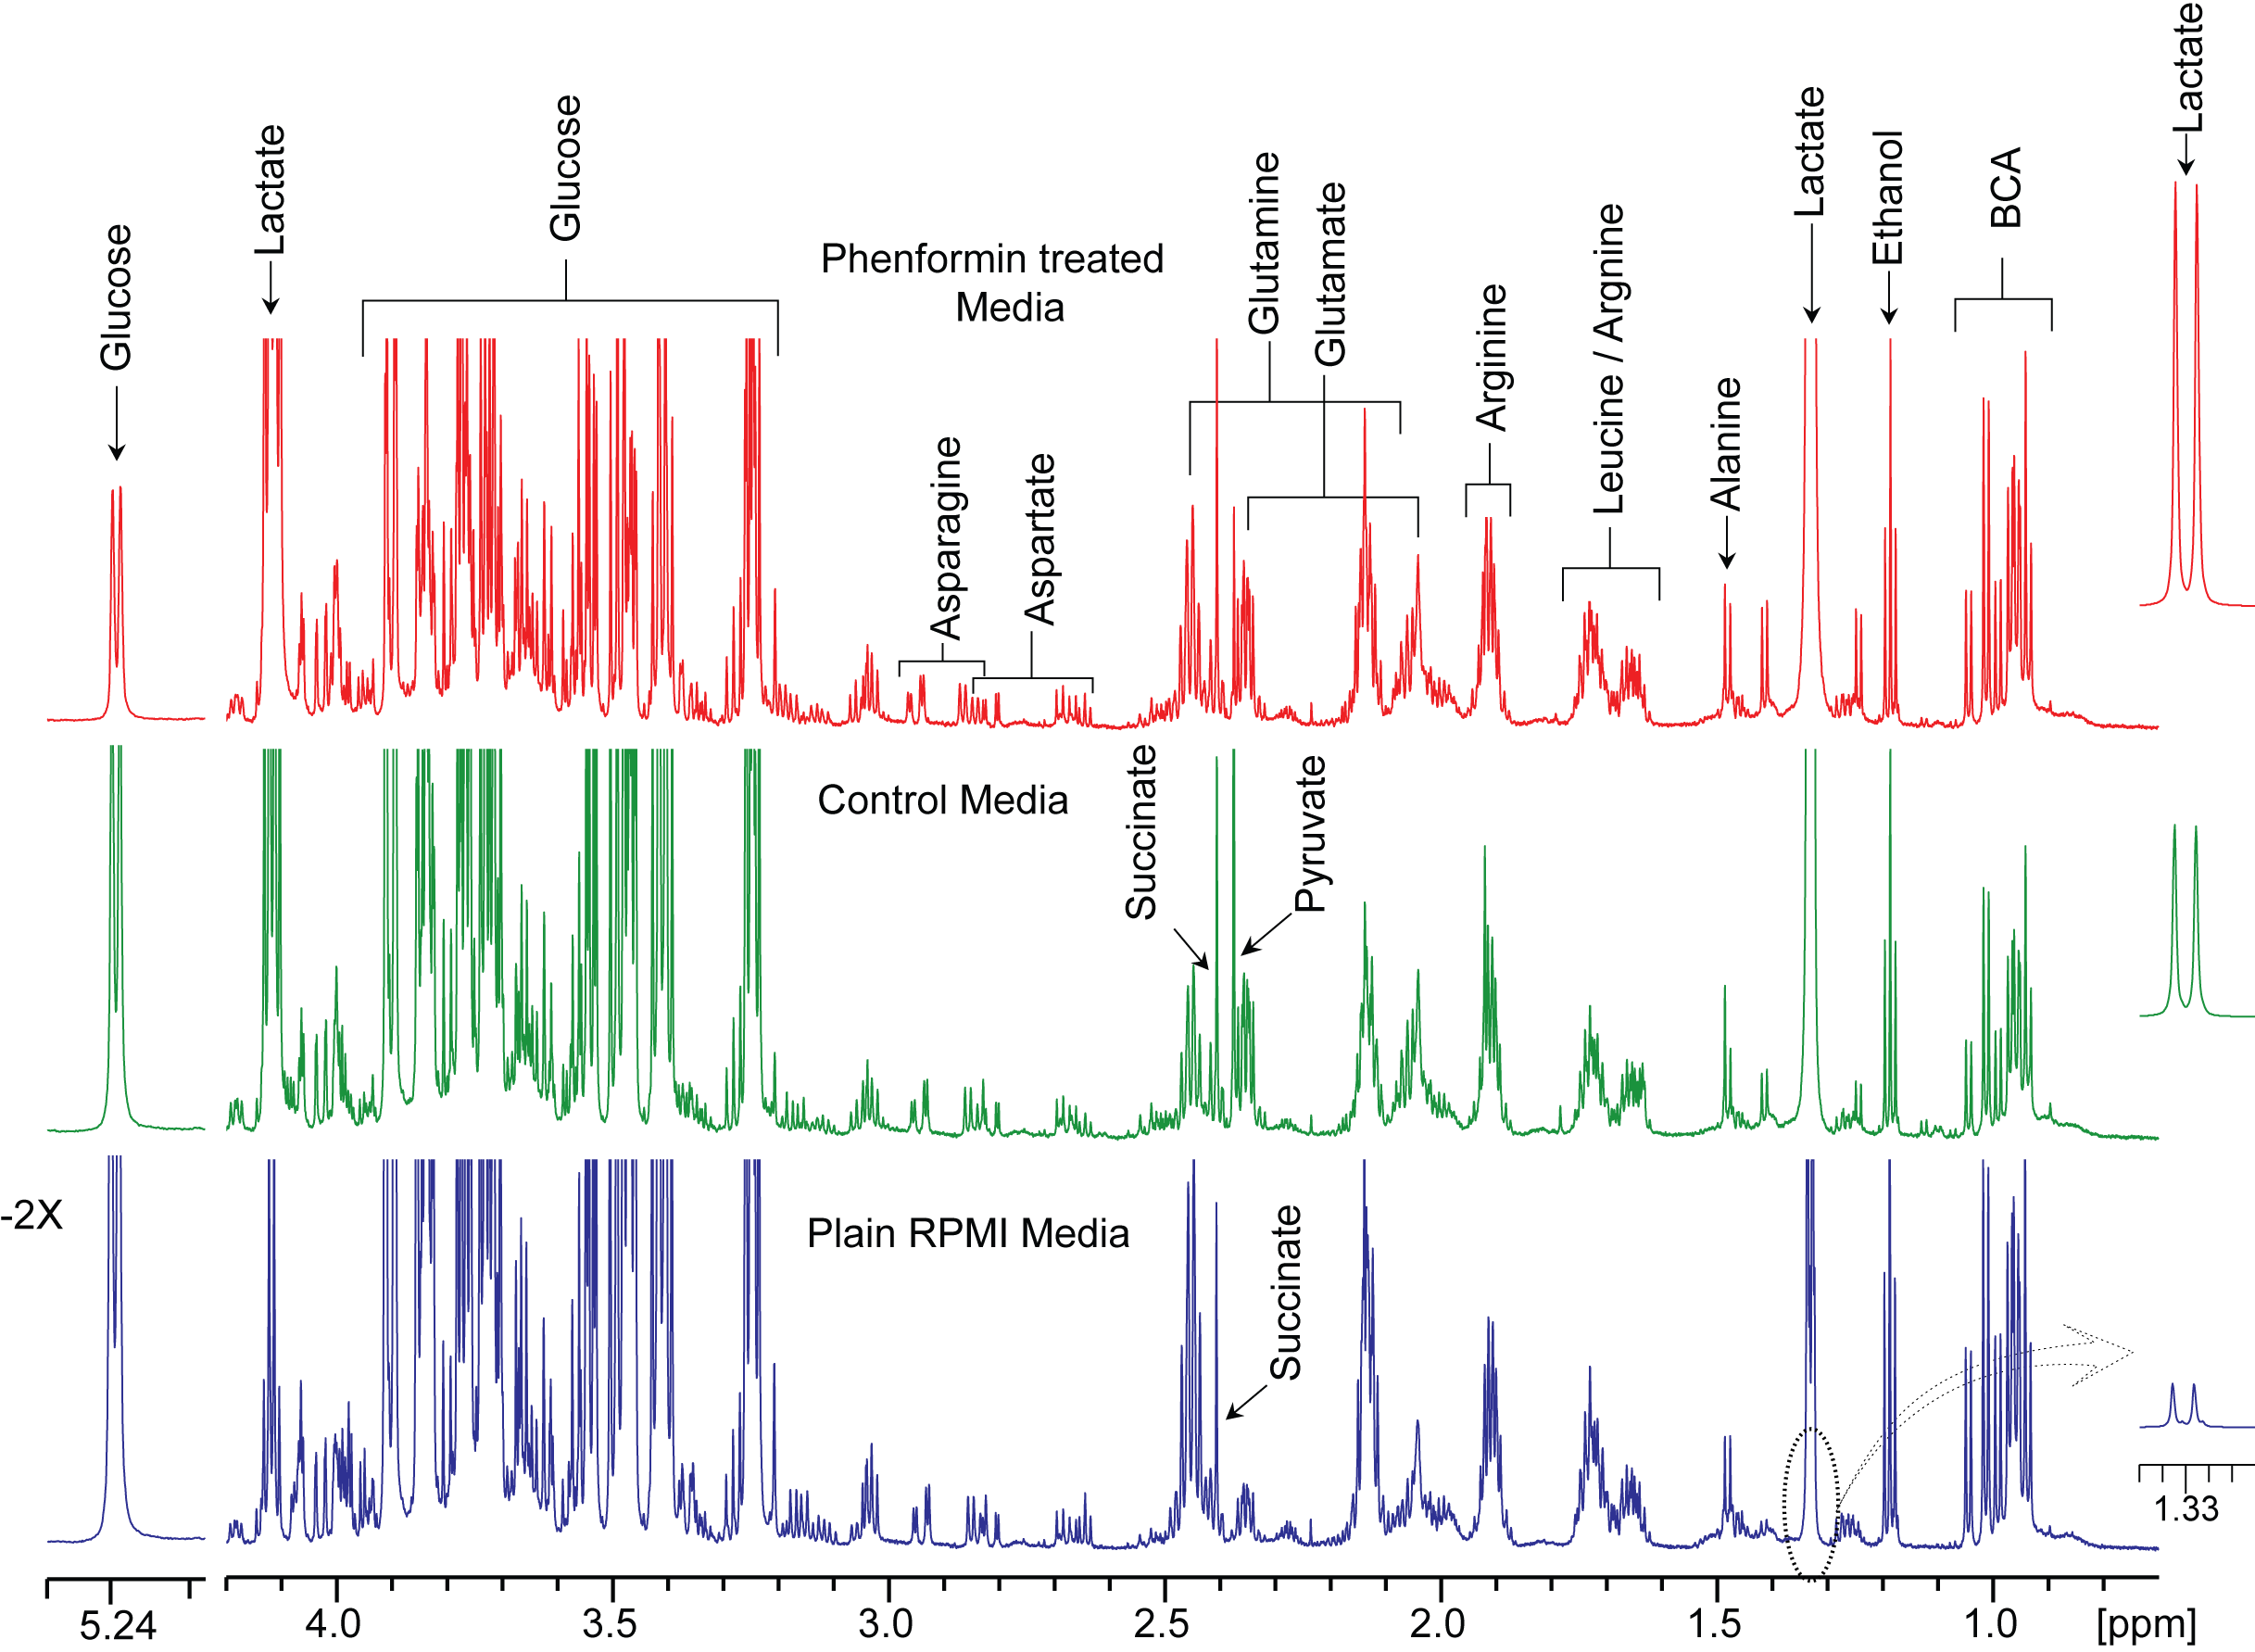
Phenformin treatment of A549 cells for 16 hours resulted in a substantial decrease of aspartate levels in cell extracts (Figures 1 and 2) as well as significant decreases in phosphocholine, glycerophosphocholine, lactate and glutathione (Figure 1 & 2). Increased levels of choline-containing metabolites, such phosphocholine and glycerophosphocholine have been reported in many cancer tissue types, including lung, brain, and breast 5, suggesting that maintaining levels of these metabolites could provide survival benefit for these tumor cells. Although aspartate levels in cell media were unchanged by phenformin treatment (Figure 3 & 4), a significant utilization of glucose utilization from media and release of lactate into media was observed following phenformin treatment. It is known that the presence of pyruvate in media makes cells less sensitive to metformin2, and while the RPMI media we used did not contain pyruvate, large amounts of pyruvate were released into media by untreated A549 cells but not phenformin-treated cells. These results provide how phenformin affects cancer cell metabolism and demonstrates the potential for 1H MRS profiling to study molecular targets of phenformin.Acknowledgements
This work was partially supported by NIH R01 CA193365, NIH P50CA013175 and NIH P30CA06973References
1.Molina, J. R et al. Mayo Clinic proceedings 2008, 83 (5), 584-594.
2.Gui, Dan Y et. al. Cell Metabolism 2016, 24 (5), 716-727.
3.Miskimins, W. K. et. al. PloS one 2014, 9 (1), e85576.
4.Van, Q. N. et. al. Biochem. Biophys. Res. Commun. 2003, 301 (4), 952-9.
5.Glunde, K et. al. Nat Rev Cancer 2011, 11 (12), 835-848.
Figures