5600
Interrogating Liver Metabolic Stress due to Cancer-Induced Cachexia1JHU ICMIC Program, Division of Cancer Imaging Research, The Russell H. Morgan Department of Radiology and Radiological Science, The Johns Hopkins University School of Medicine, Baltimore, MD, United States, 2MD Anderson Cancer Center, The University of Texas, Houston, TX, United States, 3Sidney Kimmel Comprehensive Cancer Center, The Johns Hopkins University School of Medicine, Baltimore, United States
Synopsis
Cachexia is a poorly understood metabolic syndrome characterized by cancer-induced tissue wasting and weight loss. Cachexia occurs with the highest frequency and severity in pancreatic ductal adenocarcinoma (PDAC). To further understand this syndrome, here we used 1H MRS to analyze liver metabolites in mice with and without cachexia-inducing PDAC. We detected profound liver weight loss in cachectic mice. 1H MR spectra identified significant depletion of lactate, glucose and glutathione in cachectic mice that provide new insights into the syndrome and may present novel strategies to prevent or reduce cachexia-induced weight loss and the morbidity and mortality associated with the syndrome.
Introduction:
Cancer-induced cachexia accounts for approximately 20% of all cancer deaths [1]. In pancreatic cancer, the syndrome affects nearly 80% of patients [2, 3]. The extreme weight loss due to cachexia results in a particularly poor quality of life causing profound weakness, listlessness, and inability to function. In pancreatic cancer especially, where resection is not possible for a majority of patients, palliation with chemotherapy is the only option of prolonging life, and cachexia results in lower tolerance to chemotherapy. Cachectic patients experience a wide range of symptoms affecting the function of several organs such as muscle, liver, brain, and heart, that decrease quality of life and worsens prognosis. A major characteristic of cachexia is the accelerated skeletal muscle and fat storage wasting causing nutrient mobilization both directly as lipid and amino acids, and indirectly as glucose derived from the exploitation of liver gluconeogenesis that reaches the tumor through the bloodstream [4]. Patients with cachexia develop a wide range of metabolic stress from increased proteins and fat tissue burning resulting in increased energy expenditure. Previously, we have reported the initial characterization of a myoblast optical imaging reporter that allowed real-time longitudinal monitoring of the early onset of cancer induced wasting and measured plasma metabolic changes associated with PDAC-induced cachexia [5]. Here, for the first time, we have performed high-resolution quantitative 1H magnetic resonance spectroscopy (MRS) of liver tissue obtained from normal, noncachectic and cachectic mice bearing PDAC that are cachectic (Pa04C) and noncachectic (Panc1). A significant reduction in liver weight and significant changes in 1H MRS derived metabolite profiles were detected with cachexia.Methods:
The human pancreatic cancer cell line, Panc1, was obtained from ATCC. The human pancreatic cancer cell line, Pa04C, was provided by Dr. Maitra [6]. The dual fluorescence vector construct was generated using standard molecular biology protocols and details are described in our previous report [5]. Six to 8 week old male severe combined immunodeficient mice were inoculated in the right flank with cancer cells (5 × 10⁶) and in the right hind leg muscle with reporter myoblasts (2 × 10⁶). Live animal optical imaging was done using a Xenogen IVIS® Spectrum (PerkinElmer) optical scanner. Once the mice were sacrificed, liver were harvested, freeze clamped and stored in -80°C until 1H MRS analysis. Dual phase solvent extraction was performed on liver tissue. The water phase was separated, freeze dried, reconstituted in D2O PBS and transfer to a 5mm NMR tube for spectral acquisition. All 1H MR spectra were acquired on an Avance III 750 MHz (17.6T) Bruker NMR spectrometer equipped with a 5 mm broad band inverse (BBI) probe. 1H MR spectra with water suppression were acquired using a single pulse sequence with the following experimental parameters: spectral width of 15495.86 Hz, data points of 64 K, 90° flip angle, relaxation delay 10 sec, acquisition time 2.11 sec, 64 scans with 8 dummy scans, receiver gain 80.6. Spectral acquisition, processing and quantification were performed using TOPSPIN 2.1 software and statistical analysis was performed using The UnscramblerX 10.Results and Discussion:
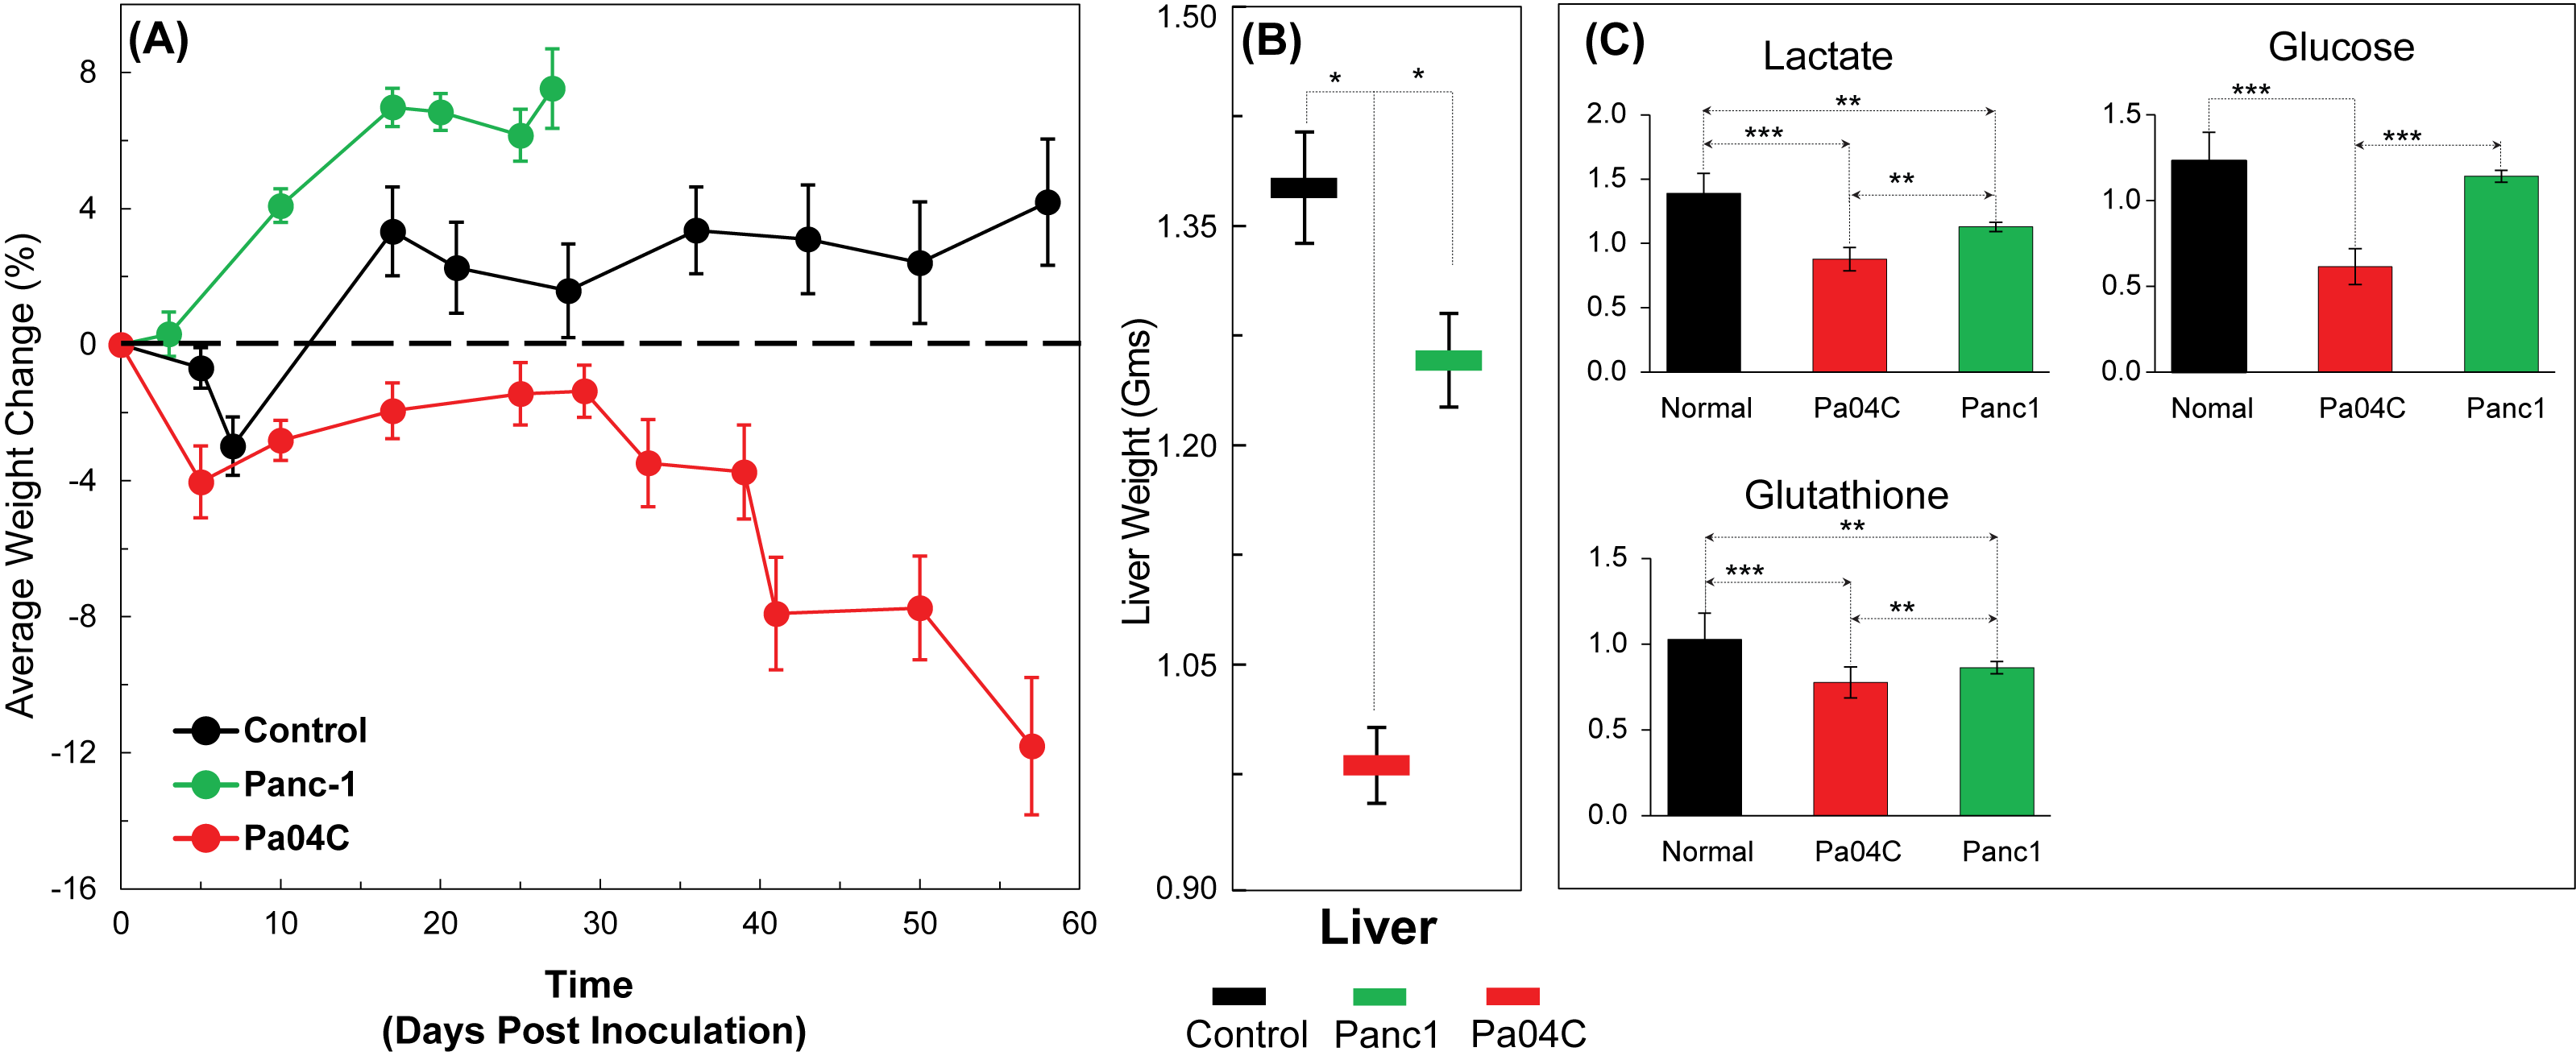
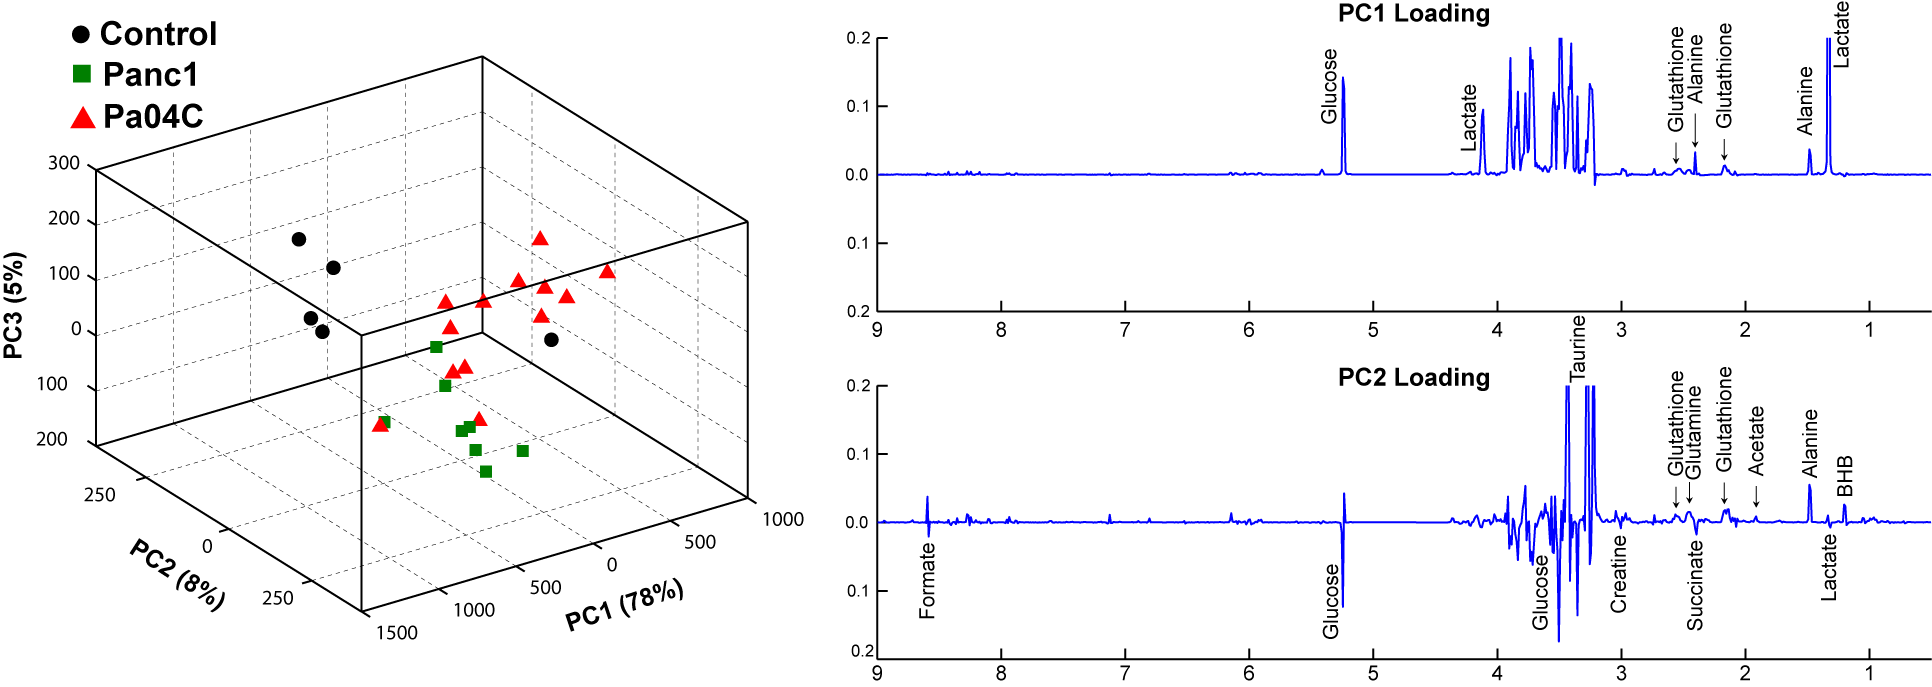
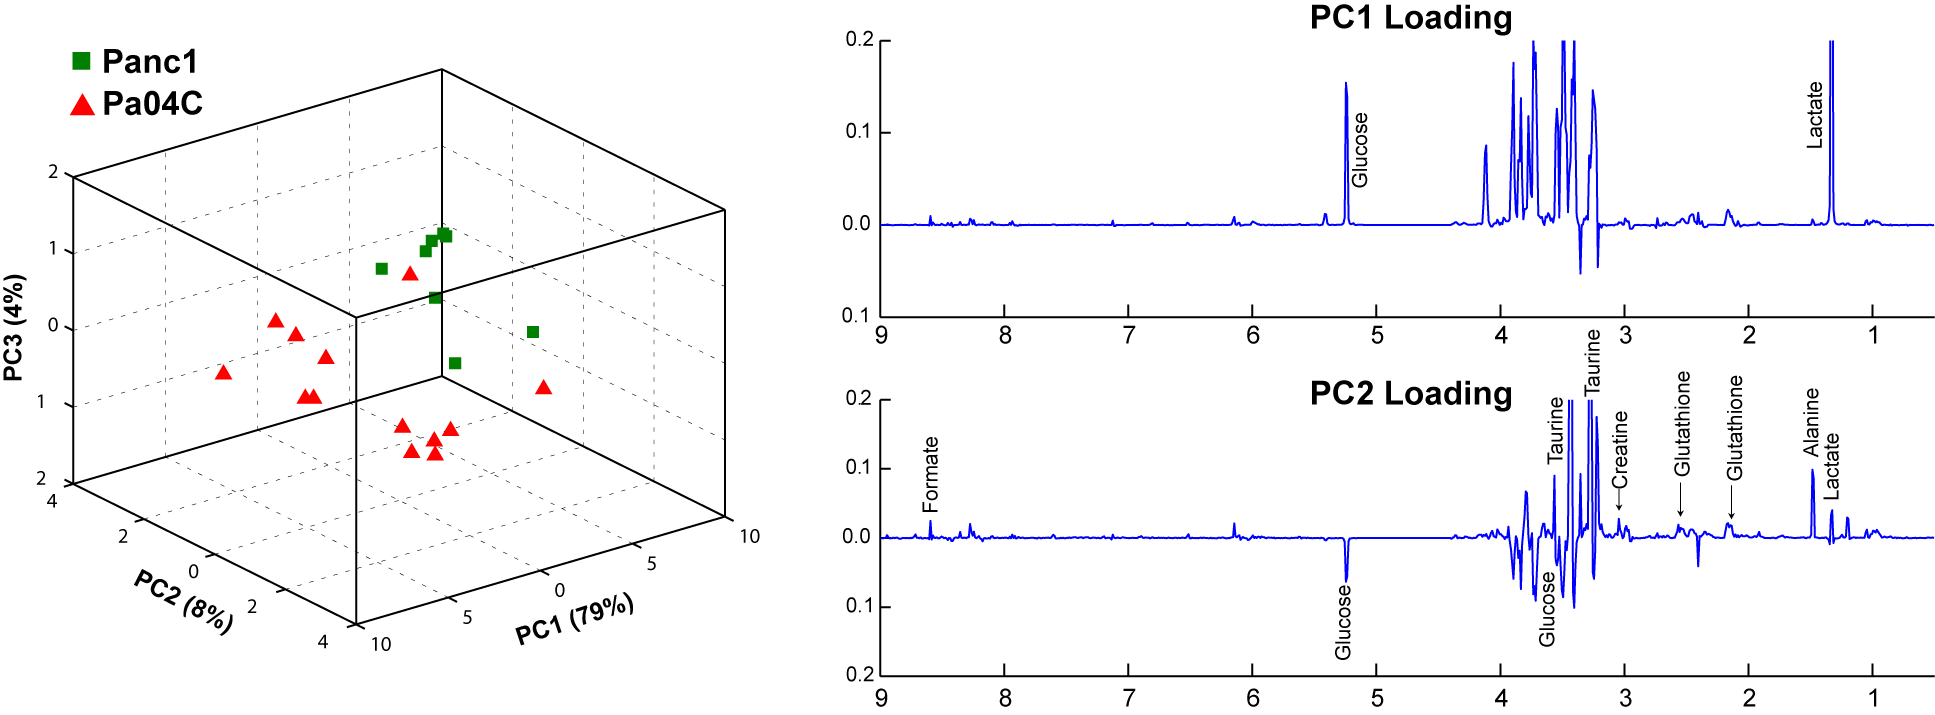
As anticipated, mice with cachexia-inducing Pa04C tumors showed significant weight loss with time (Figure 1A). For the first time we found that livers from Pa04C tumor bearing mice showed a profound weight loss as well (Figure 1B); although Panc1 tumor bearing mice showed some liver weight loss this was not as profound as observed with Pa04C tumors. Significant decreases in lactate, glucose and glutathione were observed in cachectic mouse livers compared to noncachectic mouse livers, and livers from healthy control mice (Figure 1C). Principal component analysis (PCA) of 1H MR spectra revealed that glucose, lactate and glutathione mainly contributed to the classification (Figures 2 and 3). The significant decrease of these metabolites in cachectic livers may reflect increased utilization of glucose, lactate and glutathione by the tumor or other organs during the cachexia cascade [4]. These results provide new insights into changes in liver metabolism during cachexia, and support investigating metabolic strategies such as supplementing glutathione or glucose to reduce cachexia associated morbidity.Acknowledgements
This work was supported by NIH R01 CA193365, NIH P50CA013175 and NIH P30CA06973. We thank Dr. Marie-France Penet for useful discussions.References
1.Argiles JM et. al., Nature reviews Cancer 2014, 14(11):754-762.
2.Fearon KC et. al., HPB (Oxford) 2010, 12(5):323-324.
3.Ozola ZI et. al., Pancreatology 2015, 15(1):19-24.
4.Porporato PE, Oncogenesis 2016, 5:e200.
5.Winnard PT et. al., Cancer Research 2015, 15;76(6):1441-1450.
6.Penet MF et. al., Clinical Cancer Research 2015, 21(2):386-395.
Figures