5599
High-resolution 1H MRS human plasma profiling of pancreatic ductal adenocarcinoma1JHU ICMIC Program, Division of Cancer Imaging Research, The Russell H. Morgan Department of Radiology and Radiological Science, The Johns Hopkins University School of Medicine, Baltimore, MD, United States, 2Departments of Pathology and Medicine, The Sol Goldman Pancreatic Cancer Research Center, The Johns Hopkins University School of Medicine, Baltimore, MD, United States, 3Sidney Kimmel Comprehensive Cancer Center, The Johns Hopkins University School of Medicine, Baltimore, MD, United States
Synopsis
The dismally poor 5 year survival rate of less than 6% in pancreatic ductal adenocarcinoma (PDAC) increases to ~50% with early stage PDAC making early detection critically important. Metabolic characterization of patient plasma samples provides a unique opportunity to identify biomarkers to assist in routine screening to detect of PDAC. Here, in a preliminary study, we have characterized the metabolic profiles of plasma samples from normal, benign, and PDAC patients. Even with a limited sample we identified a significant increase in β-hydroxybutyrate, acetate, acetoacetate, lactate and pyruvate in PDAC compared to normal plasma.
Introduction:
Early detection of pancreatic ductal carcinoma (PDAC) is critically important because by the time PDAC is detected almost 80% of patients are surgically unresectable [1]. While imaging with CT, MRI and ultrasound is making significant inroads in PDAC detection, the costs associated with imaging impose a barrier for routine screening. Plasma based detection of PDAC would provide a relatively inexpensive and easy method for routine screening for the purpose of early detection. Metabolic profiling of plasma samples using high resolution 1H MRS provides an opportunity to assist in the detection of PDAC. Here we characterized the plasma metabolome of normal subjects, subjects with benign pancreatic disease, and subjects with PDAC to evaluate the ability of 1H MRS to identify metabolic changes in plasma associated with PDAC.Methods:
Plasma from patients with PDAC (n=4), patients with benign pancreatic disease (n=2) and from healthy control subjects (n=4) were included in this study. Final diagnosis was established by histopathological evaluation of surgical specimens. For 1H MRS analysis, plasma samples were thawed and homogenized using a vortex mixer. Then 300 μL of D2O phosphate buffer saline (NaCl 0.9% in 90% D2O) was added to 300 μL of plasma. After centrifugation (12000 rpm, 5 min), 550 μL of each sample was transferred to 5 mm NMR tubes.
High-resolution 1H MRS was performed on an Avance III 750 MHz Bruker MR spectrometer equipped with a 5 mm broad band inverse probe. The Carr-Purcell-Meiboom-Gill (CPMG) pulse sequence with water suppression [PRESET-90°-(d-180-d)n-Aq] was performed to remove short T2 components arising due to the presence of proteins as well as to obtain a better baseline in the spectra [2]. 1H MR spectra were referenced to the methyl resonance of acetate at 1.91 ppm. The acetate peak was selected to calibrate the chemical shift because of its insensitive chemical shift change due to pH variations.[3]
Results and Discussion:
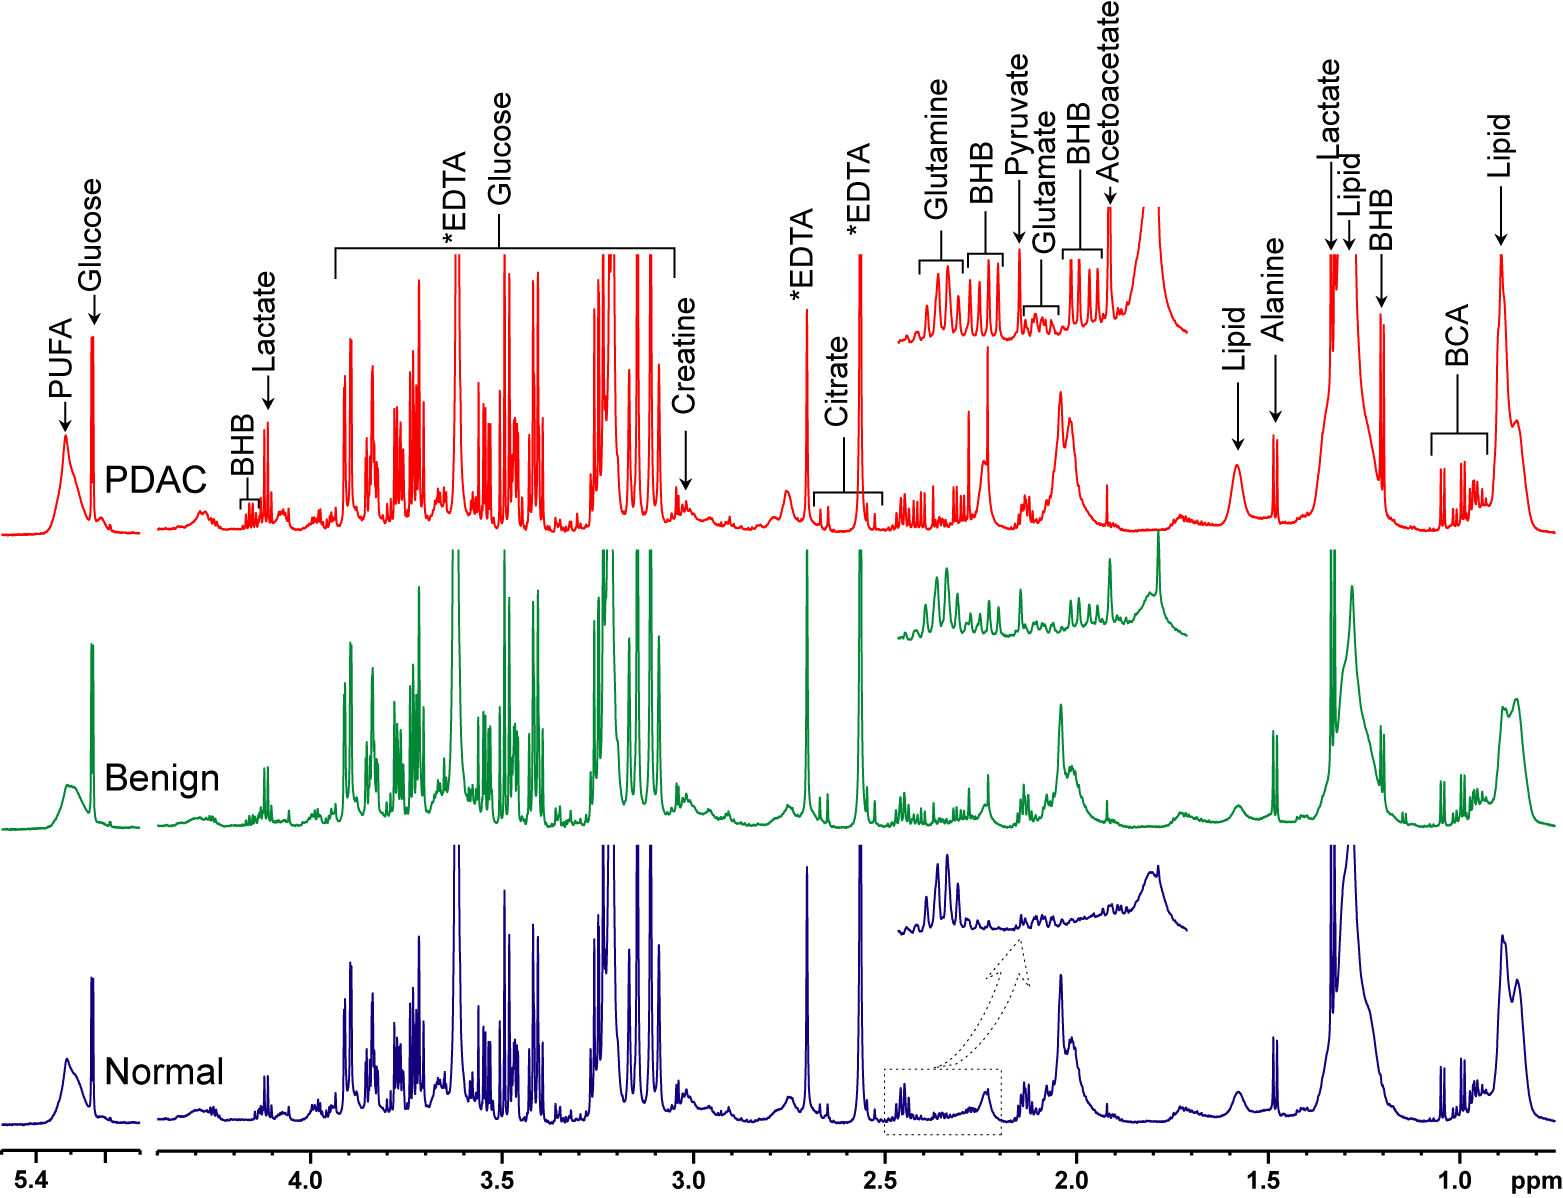
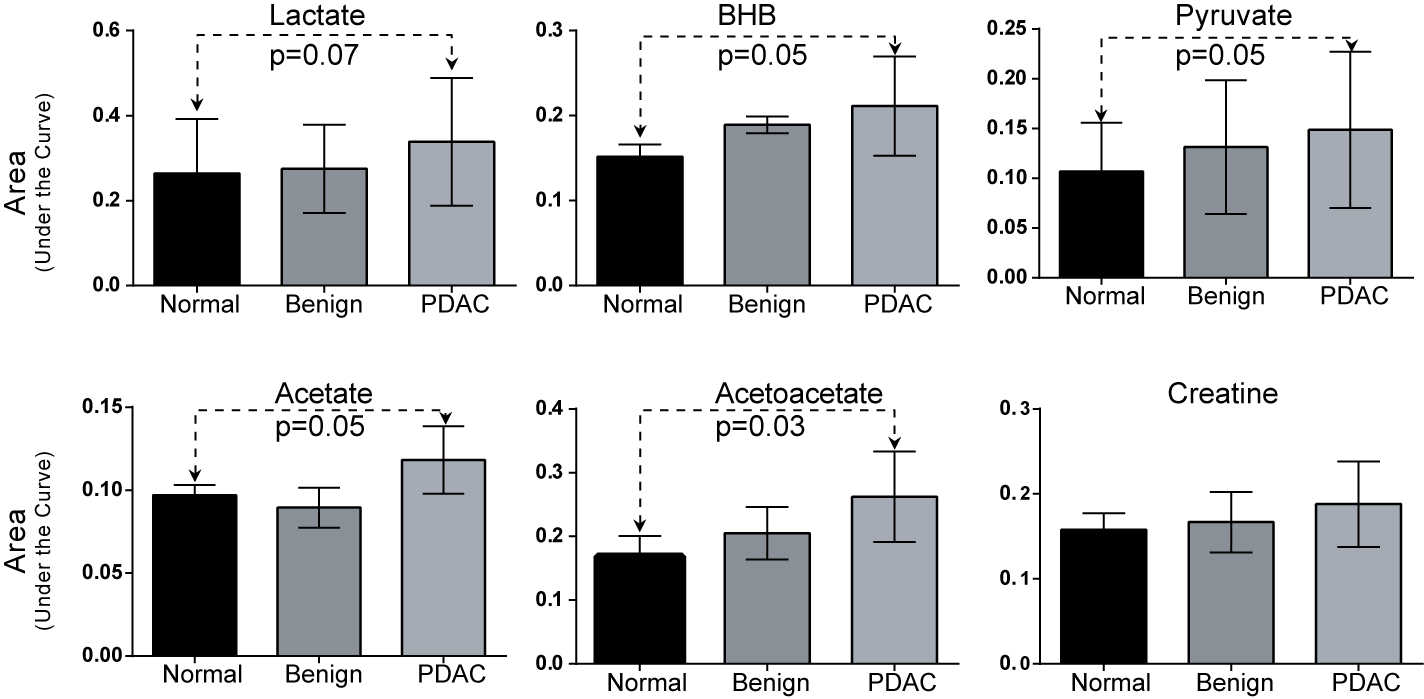
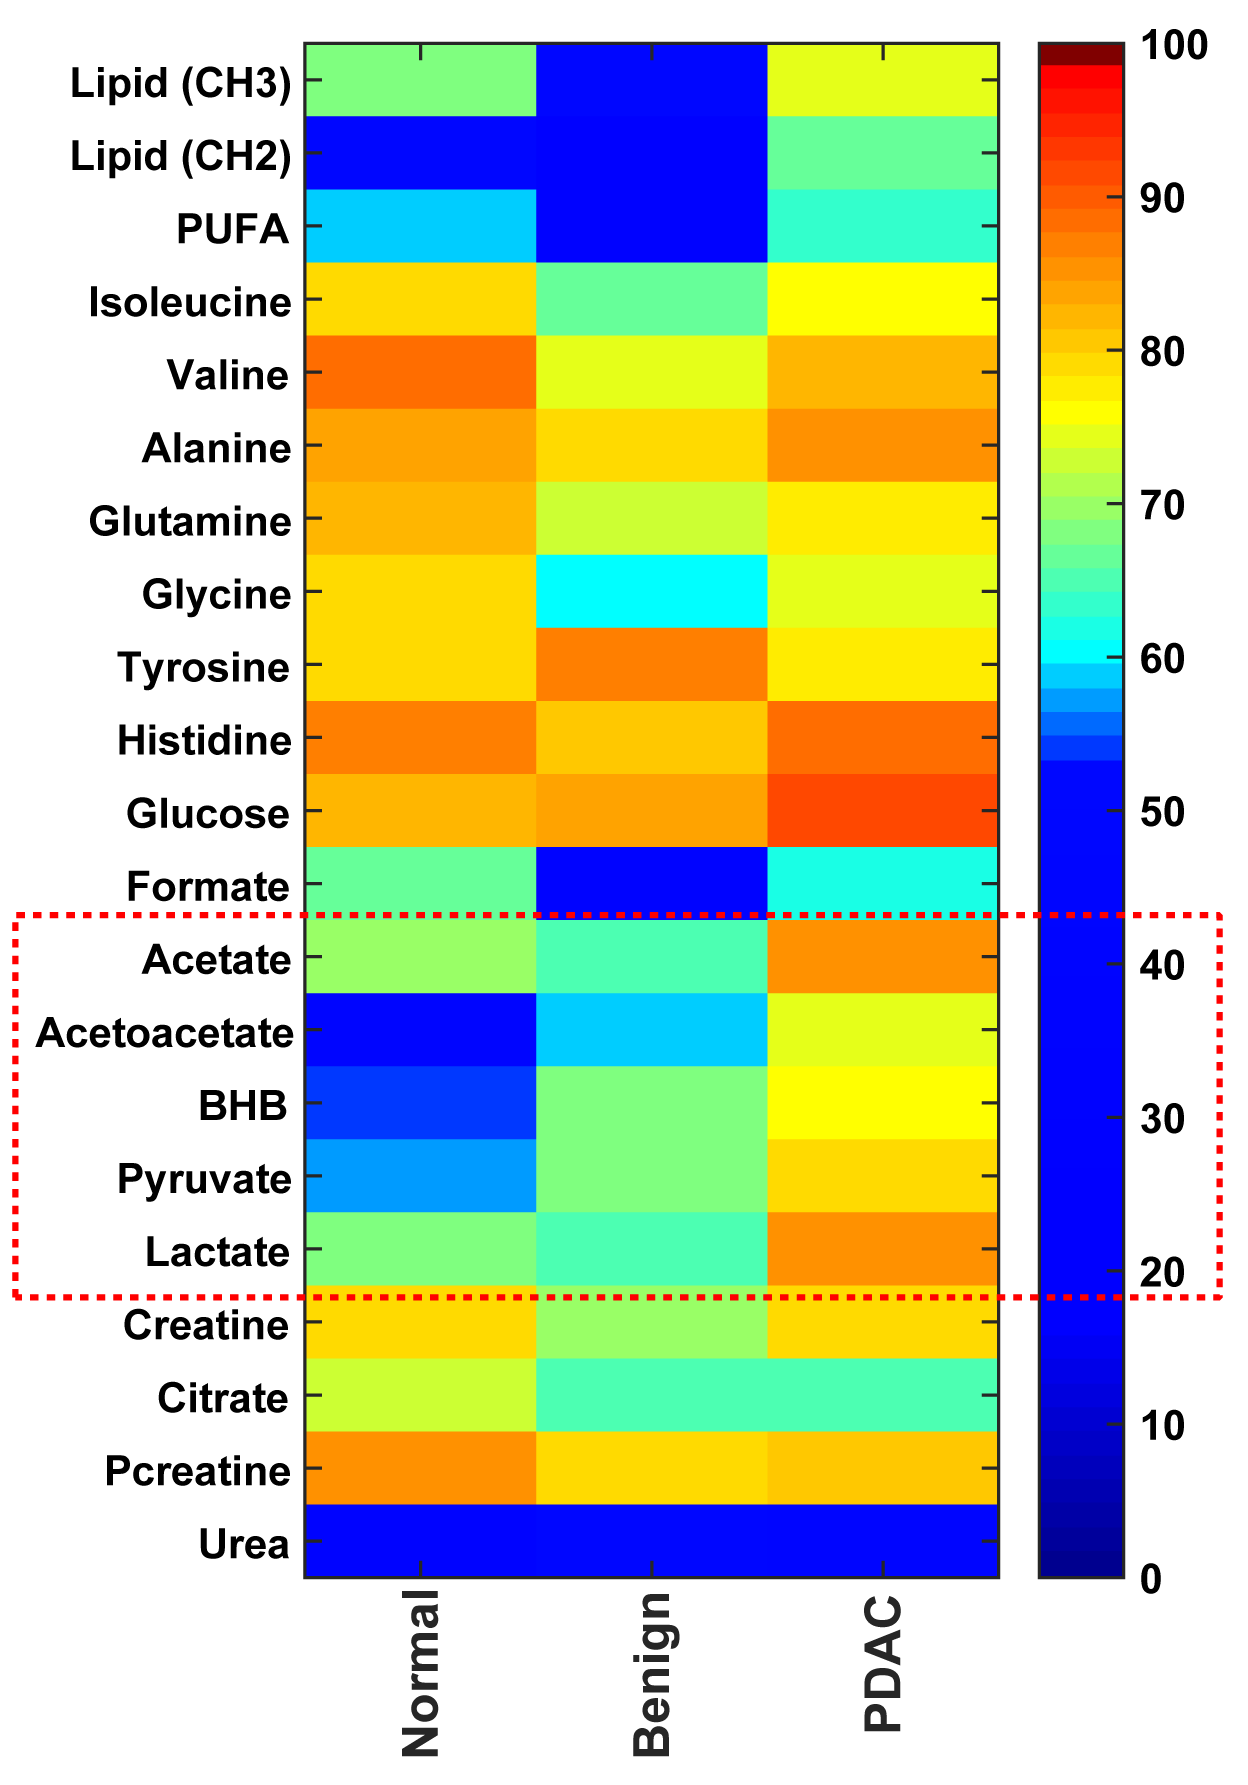
Representative 1H MRS spectra from the three groups are displayed in Figure 1. As shown in Figure 2, even with a small sample size clear differences were identified in metabolites such as lactate, pyruvate, β-hydroxybutyrate, acetate and acetoacetate in plasma from PDAC subjects compared to normal subjects. A heat map displaying metabolite patterns in plasma from normal, benign and PDAC subjects is shown in Figure 3. The increase of lactate and pyruvate detected in plasma may reflect altered glucose metabolism occurring in PDAC. β-hydroxybutyrate, acetate and acetoacetate are involved in ketone body synthesis and may reflect altered ketone body metabolism occurring in PDAC.
In a recent study, higher levels of ketone bodies and lactate were detected in the serum of rats with 7,12-dimethylben(a)anthracen (DMBA)-induced pancreatic intraepithelial neoplasia (PanIN) compared to plasma [4]. Interestingly, with progression to PDAC several of these metabolites decreased [4]. Our data support further investigation of 1H MRS of human plasma to detect PDAC in combination with techniques such as circulating tumor cell phenotyping [5].
Acknowledgements
This work was supported by NIH R01 CA193365.References
1. Kotteas E et al., Journal of cancer research and clinical oncology. 2016;142(8):1795-805;
2.Van QN et al., Biochemical and biophysical research communications. 2003;301(4):952-9;
3. Cruz T et al., Metabolites. 2014;4(1):115-28. PMCID: 4018676;
4. Lin X et al., Mol. BioSyst. 2016, 12:2883-2982;
5. Poruk KE et al., Annals of Surgery. 2016, ISSN:0003-4932/14/26105-0821.
Figures