5598
High-resolution MRS characterization of malignant ascites in two different models of ovarian cancer1JHU ICMIC Program, Division of Cancer Imaging Research, The Russell H. Morgan Department of Radiology and Radiological Science, The Johns Hopkins University School of Medicine, Baltimore, MD, United States, 2Pathology, The Johns Hopkins University School of Medicine, 3Sidney Kimmel Comprehensive Cancer Center, The Johns Hopkins University School of Medicine
Synopsis
Malignant ascites occurs in approximately 37% of terminal ovarian cancer patients. It significantly contributes to poor quality of life and mortality. Advances in understanding malignant ascites formation and finding new therapeutic options are urgently needed. High-resolution proton magnetic resonance spectroscopy provides opportunities to characterize biofluid metabolites and can be easily translated to the clinic. Here, we are investigating the metabolic profile of ascites obtained in two different experimental models of ovarian cancer. To further understand the differences observed between both models, we completed our study by analyzing the metabolic profiles of those cells in culture and their corresponding conditioned media.
Introduction
Ovarian cancer continues to be a leading cause of death from gynecological malignancies in the US, and ranks fifth as a cause of cancer-related deaths among women, with 22,280 new cases detected every year leading to 14,240 deaths [1]. Build-up of malignant ascites occurs in more than one third of ovarian cancer patients and significantly contributes to poor quality of life and mortality [2, 3]. Almost all patients at recurrence develop ascites [3]. The most common symptoms related to malignant ascites include abdominal distension, anorexia, dyspnea, insomnia, fatigue, respiratory distress, low capacity of walking, pain, lower limb discomfort and edema. For most patients, the primary purpose of treatment is to relieve the symptoms of malignant ascites and improve quality of life. Repeated drainage can improve the condition by removing a large amount of fluid but causes protein loss and hypovolemia, resulting in circulatory system issues. Moreover ascites recurs usually in a short period of time. Repeated drainage may also increase the risk of intestinal problems such as intestinal perforation and peritonitis [2]. Advances in understanding malignant ascites formation and finding new therapeutic options are urgently needed. High-resolution proton magnetic resonance spectroscopy (1H MRS) has been described as extremely useful in detecting endogenous metabolites to diagnose cancer and monitor anticancer therapy, by providing a detailed overview of metabolic pathways in a single measurement in cells, tumor biopsies or fluids [4]. The technique can be easily translated to the clinic, and provides unique opportunities to characterize metabolic composition of ascitic fluid. Malignant ascites constitutes a dynamic reservoir of survival factors, including cytokines, chemokines, growth factors, and extracellular matrix fragments, which individually and in a combined fashion affect tumor cell growth and progression through different cellular mechanisms [3]. In the present study, we are using two ovarian cancer cell lines, the murine ID8-vascular endothelial growth factor (VEGF)-Defb29 cell line and the human OVCAR3 cell line. Implanted orthotopically, these two ovarian cancer models are characterized by different profile of ascites formation. The mouse cell line ID8-VEGF-Defb29 induces large volumes of ascites, often more than 10 mL, while the human OVCAR3 cell line induces ascites less frequently and at smaller volumes, usually less than 0.2 mL. We applied high-resolution 1H MRS to compare the metabolic composition of both ascitic fluids. To better understand the differences observed, we characterized the metabolism of these ovarian cancer cells in culture by analyzing cell lysates and conditioned culture media with 1H MRS to advance our understanding of cancer cell metabolic reprogramming in malignant ascites formation and the role of the tumor microenvironment in ascites formation and composition. MRS derived biomarkers detected in ascitic fluid could help ovarian cancer diagnosis, and expand our understanding of the biochemical and metabolic changes associated with ovarian cancer.Methods
Two ovarian cancer cell lines were used in the present study, the human OVCAR3 and the mouse ID8-VEGF-Defb29 [5] cell lines. The ascitic fluids were obtained from orthotopic implanted OVCAR3 and ID8-VEGF-Defb29 tumor bearing SCID and C57BL6 mice. High-resolution proton MRS was performed on an Avance III 750 MHz Bruker MR spectrometer equipped with a 5 mm broad band inverse probe. Carr-Purcell-Meiboom-Gill (CPMG) pulse sequence with water suppression was performed to remove short T2 components arising due to the presence of proteins as well as to obtain a better baseline in the spectra [6]. The 1H MR spectra were referenced to the methyl resonance of acetate at 1.91 ppm. The acetate peak was selected to calibrate the chemical shift because of its lesser chemical shift drift due to pH variations.[7]Results and Discussion
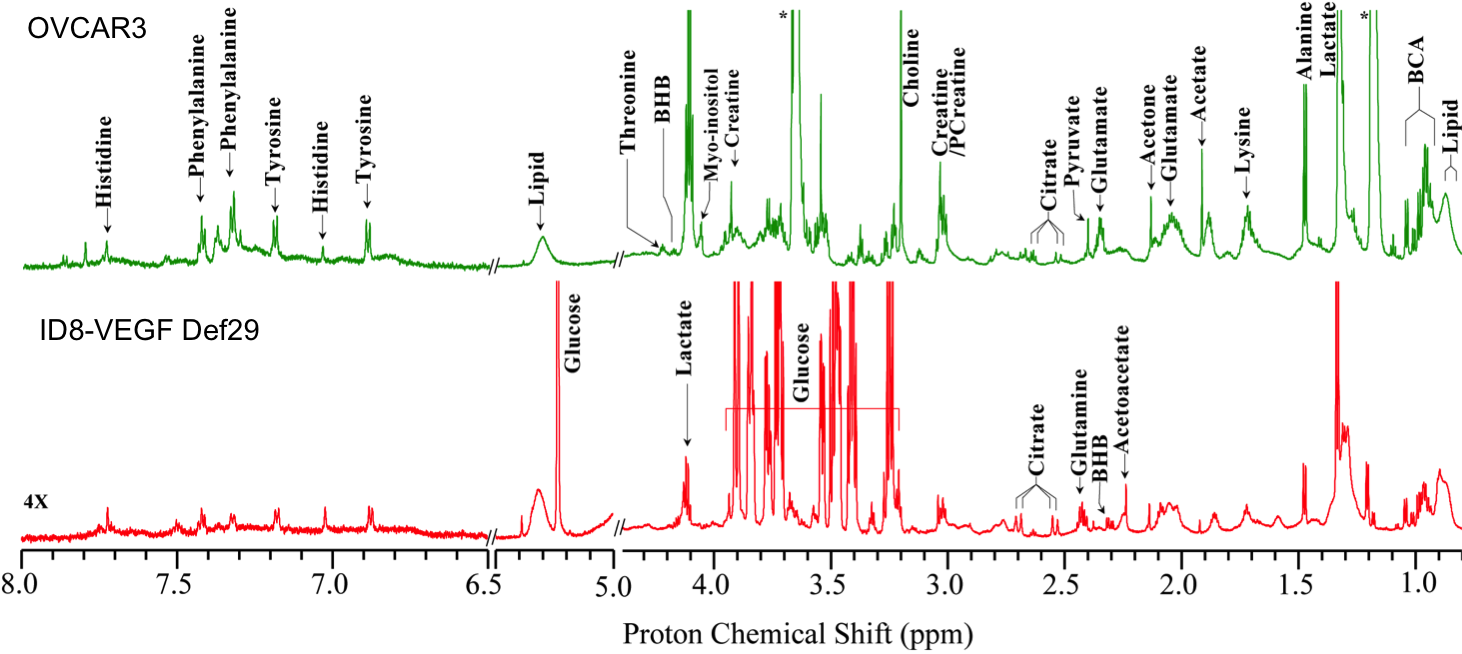
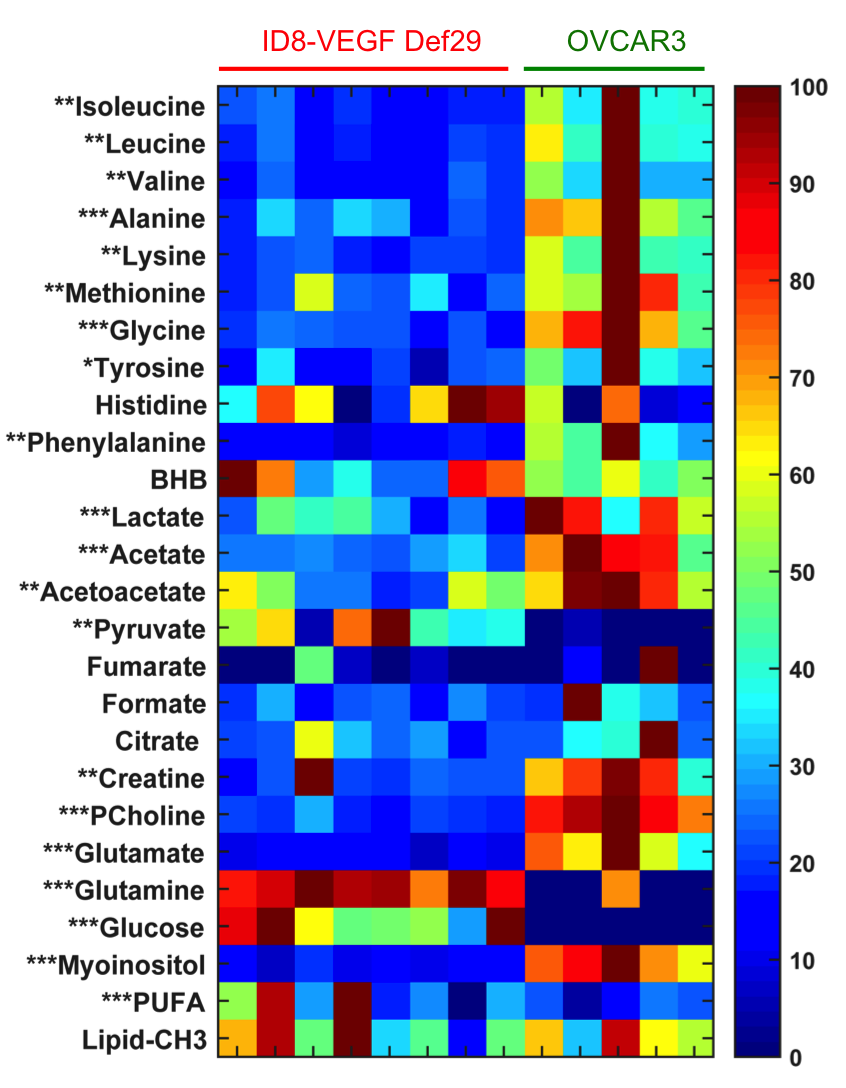
The two tumor models used in this study induced different ascitic profiles. While OVCAR3 tumor bearing mice developed small viscous volume of ascites, ID8-VEGF-Defb29 induced higher volumes. Representative spectra of ascitic fluids are shown in Figure 1. ID8-VEGF-Defb29 ascitic fluids were characterized by higher levels of glutamine, glucose, poly-unsaturated fatty acids (PUFA) and pyruvate compared to the OVCAR3 fluids, while all the other metabolites, including glutamate, lactate, myo-inositol, choline and acetate, were lower in ID8-VEGF-Defb29 ascitic fluids (Figure 2). To determine if the differences observed in the ascitic fluids were only due to a different metabolism of the cancer cells, we investigated their metabolism in vitro. We analyzed the metabolites present in the conditioned cell culture media, and in the cells. We observed differences in OVCAR3 and ID8-VEGF-Defb29 cells metabolism in vitro. The ascites composition differed between both ovarian cancer cell lines, without replicating the differences observed in vitro cells and conditioned media analysis. Figure 3 is a Venn diagram of the different metabolites present in the cells, media and ascites in the ID8-VEGF-Defb29 model, showing differences in the metabolites present in those 3 compartments, and highlighting the one in common. We identified 4 biomarkers, BHB, lipids, maleic acid and citrate, that were present in the ascitic fluid of both experimental models, and absent in the cells or media. Ascites MRS derived biomarkers could help in ovarian cancer diagnosis, and enhance our understanding of the biochemical and metabolic changes associated with ovarian cancer, and with ascites formation. Further investigations are necessary to better understand these differences. This study is a first step in profiling ovarian cancer biofluids, and can be extended to the analysis of serum and urine to provide information about changes in metabolite profiles, about ascites formation and to identify potential new biomarkers.Acknowledgements
This work was supported by grants from the HERA Foundation, the Tina's Wish Foundation, by NIH P50CA013175 and NIH P30CA06973.References
1. Siegel RL, et al. CA Cancer J Clin. 2016;66(1):7-30. 2. Kipps E, et al. Nature reviews Cancer. 2013;13(4):273-82. 3. Ahmed N, et al. Front Oncol. 2013;3:256. 4. Serkova NJ, et al. Bioanalysis. 2012;4(3):321-41. 5. Conejo-Garcia JR, et al. Nature medicine. 2004;10(9):950-8. 6. Van QN, et al. BBRC. 2003;301(4):952-9. 7. Cruz T, et al. Metabolites. 2014;4(1):115-28.
Figures