5596
Lactate and lipid provide identifying biomarkers for good quality sperm by 1H MRS1Academic Unit of Reproductive & Developmental Medicine, University of Sheffield, Sheffield, United Kingdom, 2Academic Unit of Radiology, University of Sheffield, Sheffield, United Kingdom
Synopsis
1H MRS was used to examine good and poor sperm populations to identify biomarker differences between them. Spectra were binned to 0.02ppm and two-way ANOVA with Bonferroni correction, Wilcoxon match rank test and ROC curve analyses were used to find bins with significant differences between good and poor sperm. All three statistical methods identified the bins at 1.24-1.32ppm which correlates with overlapping lipid and lactate peaks. Differences in these peaks may result from metabolic differences between the two sperm populations and this may give a useful insight into the pathology of sperm dysfunction.
Background
One in 5 young men have
poor semen quality which may affect their ability to conceive1. Comparing
metabolomes of good and poor sperm may reveal
insights into normal and abnormal spermatogenesis2. Studying the
metabolome of spermatozoa is challenging as they compose a small portion of the
ejaculate and seminal fluid contains high concentrations of many metabolites associated
with sperm3. We have developed a protocol to thoroughly wash spermatozoa
from seminal fluid. The aim of this study is to use 1H Magnetic
Resonance Spectroscopy (MRS) to identify potential biomarkers for good and poor
sperm produced by the same man that might then be applied to infertility
research.
Methods
Twenty semen samples (>25x106 spermatozoa, >39% progressive motility) were obtained from men attending for diagnostic semen analysis as part of infertility investigations. All gave informed consent (with NHS ethical approval). Briefly, 1ml of each sample was layered on top of a 40-80% Percoll gradient (in PBS) and centrifuged at 300g for 20 min. This separated sperm into either a high motility, good fraction found in the pellet or a low motility, poor fraction trapped at the 40% and 80% Percoll interface. Both populations were collected, washed in copious PBS (~3:1 volume of PBS to recovered sperm solution) and centrifuged at 500g for 10 min. These pellets were recovered and resuspended in PBS (1-2ml) before a final centrifugation at 500g for 20 min. Final pellets resuspended in 450µl of PBS.
For 1H MRS, 380µl sperm samples were placed in 5mm water susceptibility matched Shigemi tubes with 20µl D2O. Samples were examined at 37°C on a 9.4T MR spectrometer to acquire spectra using a 1H excitation-sculpting solvent suppression sequence (SW=20ppm, NEX=1024, AQ=0.5s, TR=4s). Spectra were phase and baseline corrected using Bruker Topspin V2.1 before identification of metabolite peaks. Custom Matlab software fitted the baseline to subtract any residual water peak and binned the spectra to 0.02ppm (0.52-8.98ppm, 387 bins with rounding). Binned spectral integrals were normalized to cell count and tested for significant difference between good and poor samples by three methods. Firstly, two-way ANOVA with a Bonferroni correction with (p ≤0.05) as significant. Secondly, Wilcoxon matched-pairs signed rank test, (p ≤2x10⁻⁴) was taken as significant as this corresponded well with observable peak regions and eliminated regions of noise. Finally ROC curves were generated to examine the specificity and sensitivity of each bin being able to identify if a sample was good or poor, p≤0.0001 and Area Under the Curve (AUC) ≥0.85.
Results
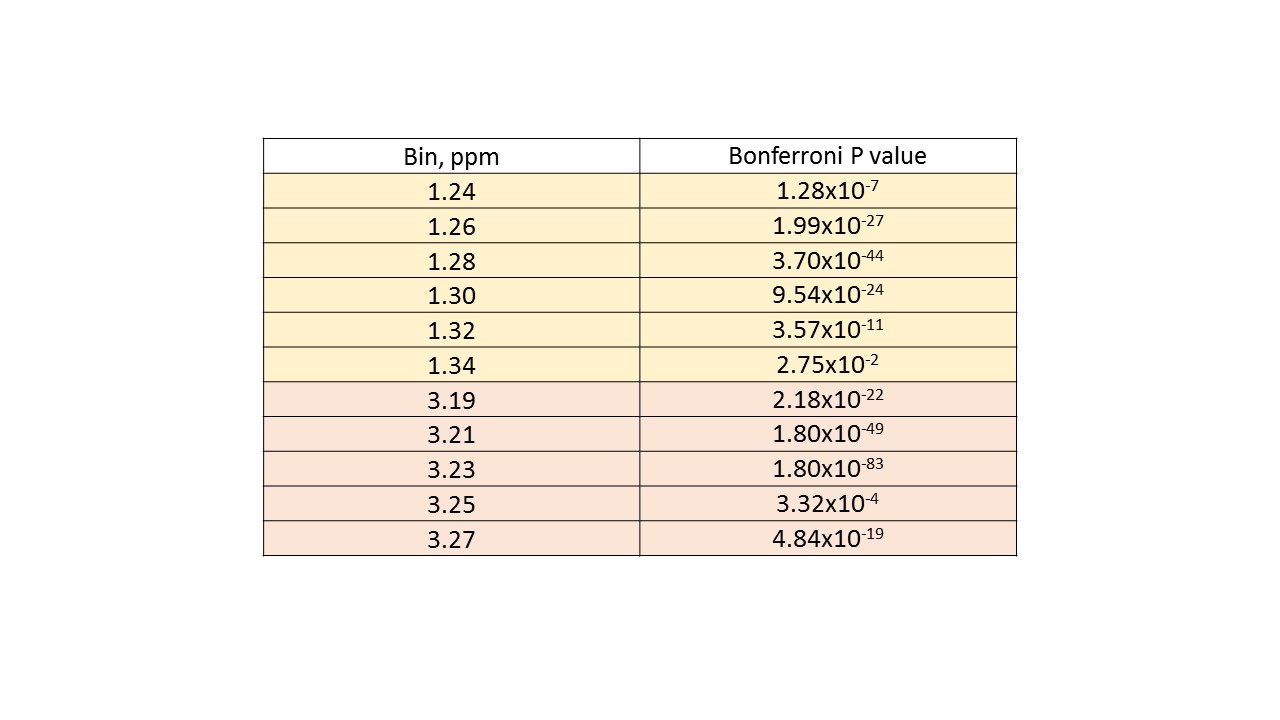
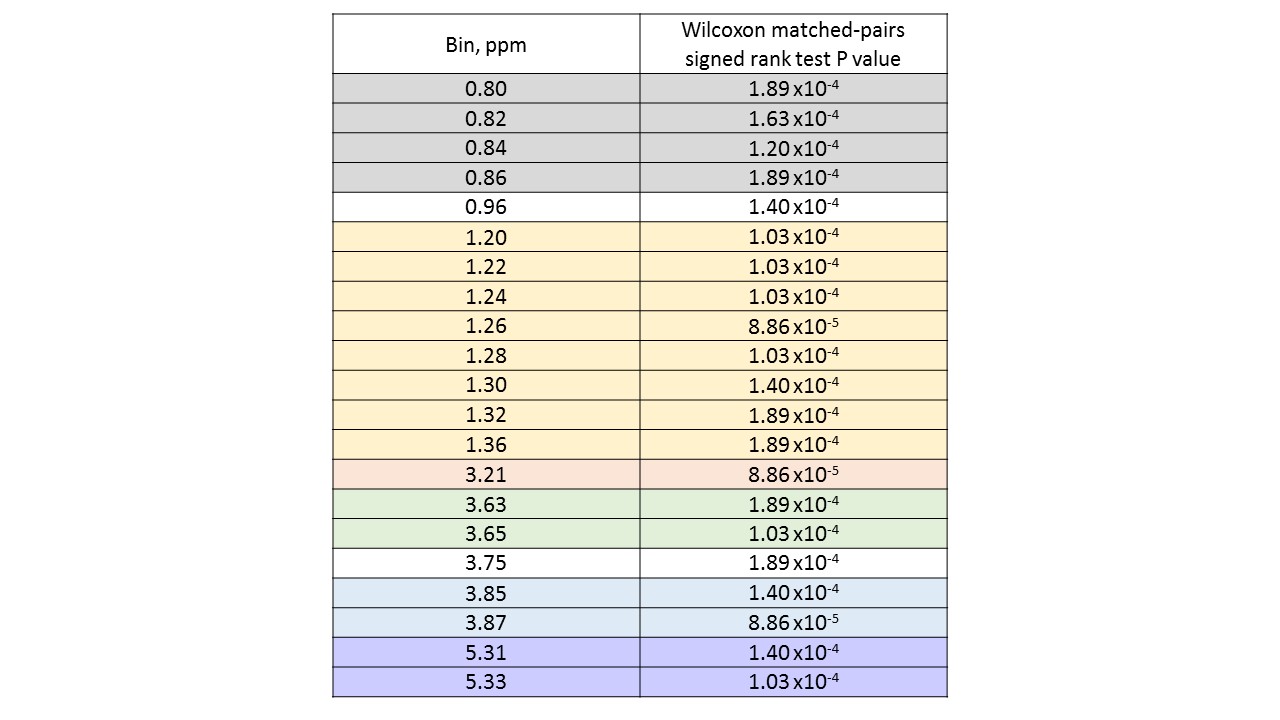
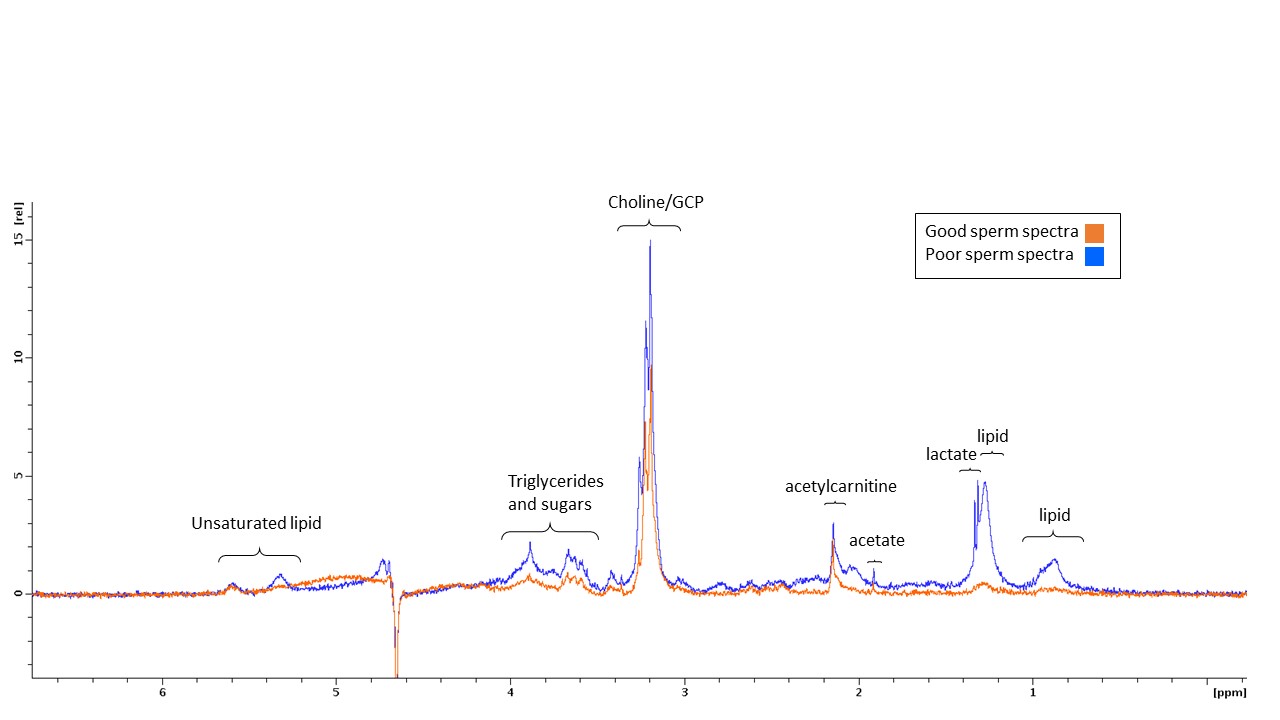
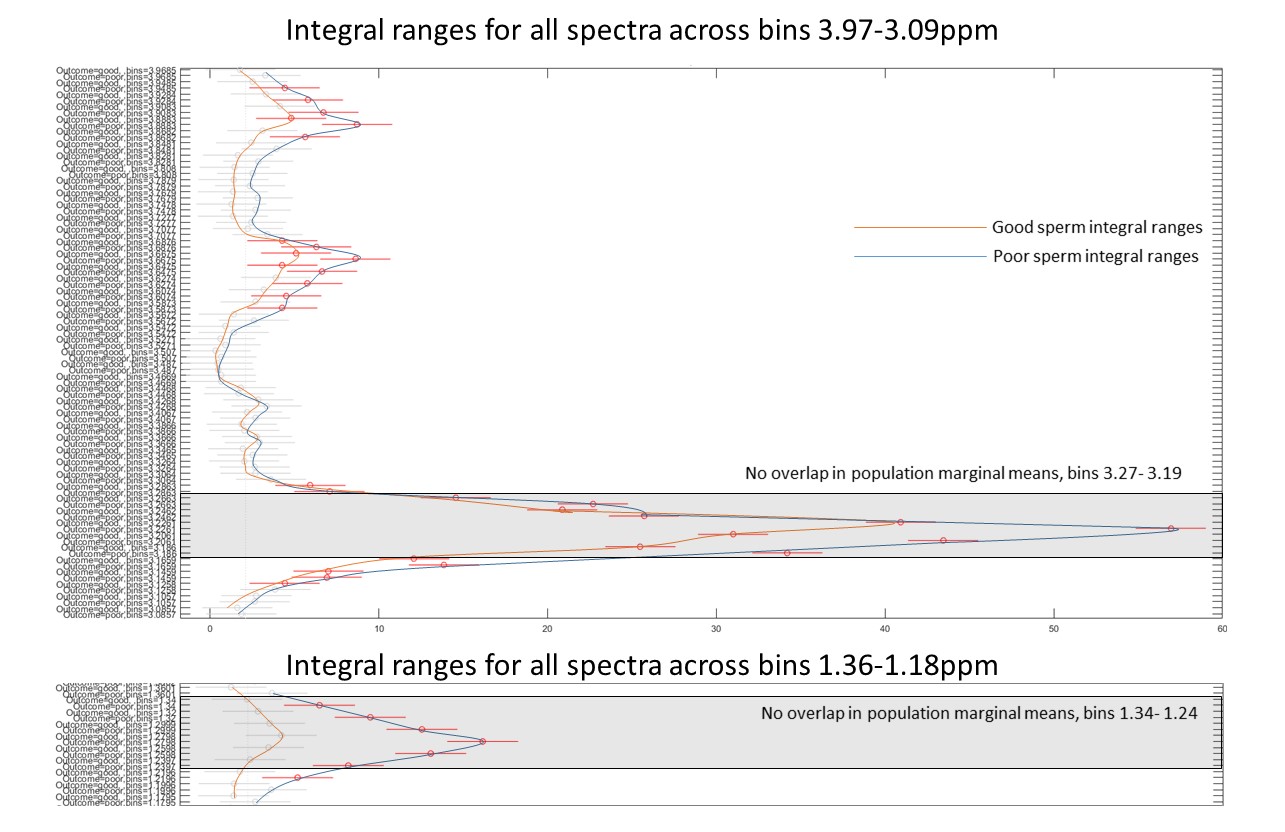
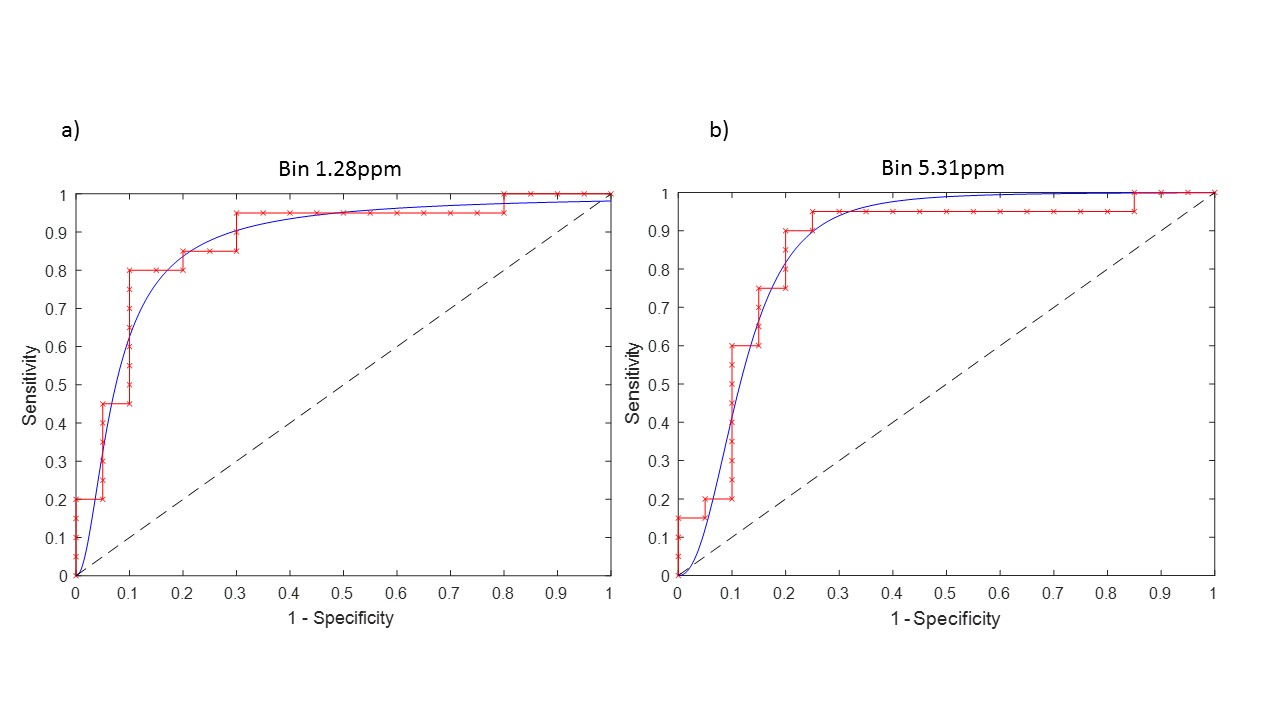
Several peaks were identified including, lipids, acetate, acetylcarnitine, choline and glycerophosphocholine (GCP) and some triglyceride and sugars. Interestingly, these peaks visually appeared to be at higher concentration in poor sperm (Figure 1). The majority of metabolites identified seemed to be fat soluble compounds. Two-way ANOVA was not statistically significant between means for all bins or overall between good and poor sperm. Therefore a multivariate comparison between individual bins was done which identified 11 bins as significantly different between good and poor sperm (Bonferroni corrected for multiple comparisons, Figure 2) and they corresponded with the lactate/lipid peak at 1.24-1.34ppm and choline/GCP at 3.19-3.27ppm (Table 1). Wilcoxon matched-pairs signed rank test identified some of the bins found by the multivariate comparison but also found several bins in other peaks for unsaturated lipids, triglycerides and sugars (Table 2). Finally, ROC analysis identified bins at 1.22-1.38ppm (AUC 0.853-0.874) and 5.29-5.31ppm (AUC 0.862-0.874) correlating with the lactate-lipid peaks and unsaturated lipids that could specify good from poor samples (Figure 3).Discussion
All three statistical analyses highlighted significant differences for the bins in the lactate/lipid peaks, therefore, we propose these peaks show the most consistent difference between good and poor sperm. Increase in lactate in poor sperm may represent that these sperm utilize glycolysis more than good sperm.
Interestingly the choline/GCP peak bins 3.19-3.27ppm was clearly identified by multivariate comparison, but not by the other methods. Conversely, the unsaturated lipid peaks were found by ROC and Wilcoxon analysis, but not by multivariate comparison. As identified peaks were mostly fat-soluble compounds indicates that these metabolites are core parts of sperm structure. However, this may suggest that water-soluble metabolites are being lost from sperm during the extra washing steps. Similarly, since the poor sperm population generally have more morphological defects associated with them4, the difference in spectra may reflect ultrastructural differences in sperm structure (e.g. cytoplasmic droplets).
Overall, differences in these peaks may result from metabolic differences between the two sperm populations and this may give a useful insight into the pathology of sperm dysfunction.
Acknowledgements
The authors would like to thank the Medical Research Council (grant MR/M010473/1) for funding this project.
We are also grateful to the Andrology department at the Jessop Wing, Sheffield for help with recruitment.
References
1) Andersen A, Jensen T, Carlsen E, et al. High frequency of sub-optimal semen quality in an unselected population of young men. Hum Reprod. 2000;15(2):366-372.
2) Calvert S, Reynolds S, Paley M, et al. Increased metabolites in lower quality sperm suggest altered metabolism and increased cytoplasm compared to higher quality sperm. The 24th Annual Meeting and Exhibition of the International Society for Magnetic Resonance in Medicine (ISMRM 2016), Singapore. In Conference Proceedings, 2016; program no. 906.
3) Owen D and Katz D. A review of the physical and chemical properties of human semen and the formulation of a semen simulant. J Androl. 2005;26(4):459-469.
4) Aitken R and West K. Analysis of the relationship between reactive oxygen species production and leucocyte infiltration in fractions of human semen separated on Percoll gradients. Int J Androl. 1990;13(6):433–51.
Figures