5595
Unique molecular signatures to distinguish immunotherapy responding and resistant cell lines in melanoma by NMR spectroscopy and MR hyperpolarization1Department of cancer systems imaging, University of Texas M D Anderson Cancer Center, Houston, TX, United States, 2Department of Immunology, University of Texas M D Anderson Cancer Center, Houston, TX, United States
Synopsis
The cancer immunotherapy has brought new ray of hope in cancer patients with its capability of curing cancer with less side effects. However not all patients responds to therapy. In this study we have employed Nuclear Magnetic Spectroscopy (NMR) and in vivo hyperpolarized 1-13C pyruvate magnetic resonance spectroscopy (MRS) to differentiate immunotherapy responding from immunotherapy resisting melanoma.
Purpose
Cancer immunotherapy is employed by blocking the two negative regulatory proteins of T-cell activation known as cytotoxic T-lymphocyte associated protein-4 (CTLA4) and programmed death-1 (PD1). The immunotherapy is successful in treating cancer patients of melanoma however not all patients responds. The overarching purpose of our study is to image immunotherapy responding and resistant patients at metabolic level to distinguish.Methods
We have employed a two prong strategy to assess immunotherapy response; a) in vitro high resolution Nuclear Magnetic Resonance (NMR) spectroscopy and b) in vivo hyperpolarized 1-13C pyruvate magnetic resonance spectroscopy (MRS) in live mice model1. The standard one dimensional (1D) 1H NMR with water suppression sequence was used to acquire the data on a melanoma cell line responsive to immunotherapy (B16/BL6 TMT) and a corresponding immunotherapy resistant cell line (B16/BL6 3I F4). The data was processed in Topspin 3.1 and resonances are identified using Chenomx, human metabolic database (HMDB), 2D [1H-1H] TOCSY and 2D [1H-13C] HSQC2-3. All the data were acquired on Bruker spectrometer operating at 600 MHz proton resonance frequency equipped with triple resonance TXI (1H , 13C, 15N) cryogenically cooled probe. The dissolution DNP (Hypersense) operating at 3T is employed to hyperpolarize 1-13C pyruvate. The 13C magnetic resonance spectrum of hyperpolarized 1-13C pyruvate acquired on intact, live immunocompetent mice models with melanoma tumor implanted in flank at 7T Bruker MRI scanner.Results
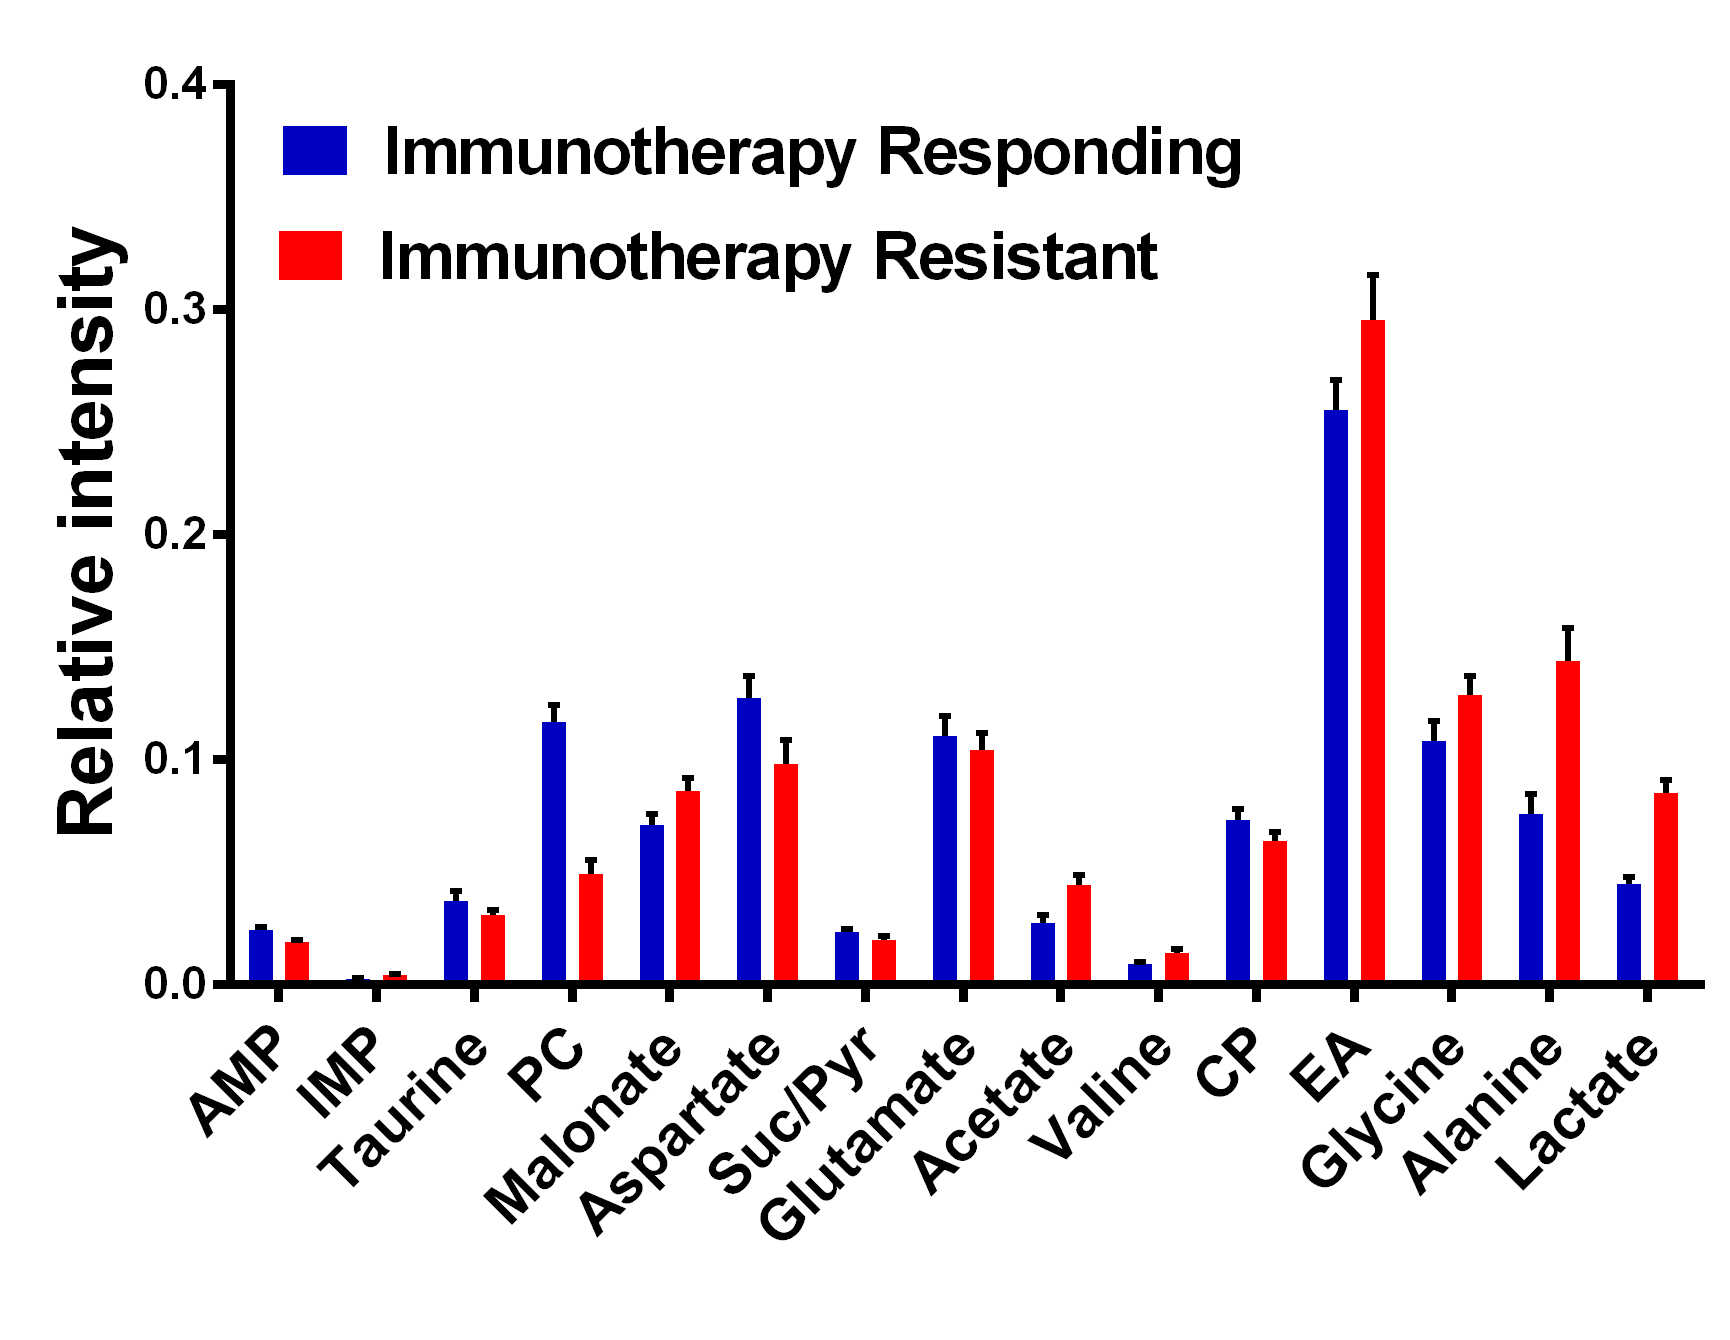
The analysis of 1D 1H NMR revealed distinct difference in metabolic activity in two different melanoma cell lines; immunotherapy responsive and resistant (number of samples TMT= 8, 3I F4= 8). The metabolites lactate (P = 0.03), alanine (P < 0.001) and phosphocholine (P < 0.001) were altered significantly in the two individual cell lines (Figure 1). The real time dynamic hyperpolarized MRS on injection of 1-13C pyruvate reveals downregulation of conversion of pyruvate to lactate in immunotherapy resistant mice compared to mice responding to immunotherapy (Table I).Discussion
NMR data suggests upregulation of lactate and alanine in immunotherapy resistant cell lines compared to immunotherapy responding ones. However, phosphocholine is downregulated in immunotherapy resistant cell lines but upregulated in responding ones. This shows that immunotherapy responding cells mainly utilizes the end products of glycolysis to generate phospholipids leading to increased phosphocholine synthesis and decreased lactate production2. There were four categories of mice used in the dynamic metabolomics study 1) immunotherapy responding treated with immunotherapy (anti PD-1 and anti-CTLA4); 2) immunotherapy responding untreated 3) immunotherapy resistant treated and 4) immunotherapy resistant untreated. The hyperpolarized 1-13C pyruvate dynamics in melanoma bearing mice suggests decreased ‘Warburg effect’ in immunotherapy responding mice compared to untreated immunotherapy responding one. The same trend continued in immunotherapy resistant treated and untreated category. However, immunotherapy resistant mice treated with immunotherapy exhibited low Warburg effect. We are expanding this study to validate this exciting preliminary results.Conclusion
1H NMR and hyperpolarized 13C MRS were successfully employed to define the metabolic differences in immunotherapy responding and non-responding cell lines and in vivo animal models of melanoma. Altered concentrations of lactate, alanine and phosphocholine were observed and studies are currently underway to understand the mechanistic basis of this metabolic adaptation and employ these differences are potential imaging biomarkers of immunotherapy resistance in the clinic.Acknowledgements
1) We would like to thank the department of cancer systems imaging, MD Anderson cancer center CCSG-funded NMR core facility (CA016672) and MRI facilities are highly acknowledged.
2) The research has been funded in part by MD Anderson Institutional Research Grants , MD Anderson Institutional Startup, Brain SPORE Developmental Research Award and Koch Foundation.
References
1. Albers, M. J.; Bok, R.; Chen, A. P.; Cunningham, C. H.; Zierhut, M. L.; Zhang, V. Y.; Kohler, S. J.; Tropp, J.; Hurd, R. E.; Yen, Y.-F.; Nelson, S. J.; Vigneron, D. B.; Kurhanewicz, J., Hyperpolarized (13)C Lactate, Pyruvate, and Alanine: Noninvasive Biomarkers for Prostate Cancer Detection and Grading. Cancer research 2008, 68 (20), 8607-8615.
2. Armitage, E. G.; Southam, A. D., Monitoring cancer prognosis, diagnosis and treatment efficacy using metabolomics and lipidomics. Metabolomics 2016, 12 (9), 146.
3. Salzillo TC, Hu J, Nguyen L, Pudakalakatti S, et al. (2016) Interrogating metabolism in brain cancer (Book Chapter). Mag Reson Imag Clin in North America 2016 4:687-703.
Figures