5582
Evaluation of SMS sequence on the AIMD MRI model validation1CRMD-Hardware Development, St Jude Medical, Sylmar, CA, United States, 2St. Jude Medical
Synopsis
Impacts of SMS imaging technique on the AIMD design, transfer function measurement, model calculation and system validation were thoroughly analyzed. The RF frequency broadening from the SMS imaging sequence has minimal impacts to the existing device design and test methodology.
Background introduction
Simultaneous Multi-Slice (SMS) imaging technique has been rapidly developed in recent years to speed up the MRI scanner image acquisition. This technique selects multiple slices through parallel spatial excitation in the RF frequencies. It reduces the scanning time, improves the temporal resolution and is frequently used in brain imaging protocols.
Generally, patients with active implantable medical devices (AIMDs) may be at risk of harm from excessive RF heating and/or injection voltage during an MRI scan. The E-field tangential (Etan) to the lead body is converted to heating or voltage through the system transfer function as described in ISO/TS 10974[1]. Due to the RF frequency broadening and simultaneous multiband excitation by SMS sequence, there is a need to evaluate any potential impact to the transfer function (TF) measurement, in vivo Etan simulations and response of the AIMD.
Aspects of evaluation
In this study, the following aspects are evaluated:
1. Analyze the SMS pulse induced frequency broadening through short time Fourier transformation (STFT). Evaluate the broadening limit set by the existing scanners’ receiver bandwidth (rBW).
2. Determine the impact to the measured TF by comparing the test results of 64MHz and 64.5MHz.
3. Evaluate any impact to FDTD Etan results by varying ± 1MHz around 64MHz along different lead pathways in human body model.
4. Evaluate the AIMD’s MRI filter response over 1MHz range around 64MHz with a realistic feedthru capacitor. This gives confidence on the MRI noise rejection in the existing filter design.
Results and Discussions
1. Analyze the multiband frequency broadening in SMS pulses
The frequency broadening is studied by performing STFT on the SMS sequence code developed by Peter Koopmans[2]. The impacting factors to the frequency broadening are mainly from RF detuning frequency, pulse duration and multiband factor. To simulate a worst case scenario, 20 RF bands were selected with 1ms pulse duration. As shown in Figure 1, the short duration SMS signal results in the RF excitation frequency to a ±220kHz broadening. While for the current 1.5T MRI scanners, the typical rBW is ±150kHz[3]. This sets the upper limit of the broadening in the SMS sequences.
2. Compare TF test results at 64MHz and 64.5MHz
The amount of heating or injection voltage contributed from Etan can be predicted by using a TF associated with the lead type, length and soak state. For example, the temperature rise due to RF heating is determined as
∆T=|∫_0^LEtan(\tau)\times TF(\tau)d\tau|^{2}
Where TF(\tau) is the experimentally measured. A generic lead electrode TF was measured with RF excitation at 64MHz and 64.5MHz. As shown in Figure 2, the percentage variations of TF are shown in the magnitude and phase plots. Due to the lead design and its responses to RF frequency, a maximum 2% variation is observed in the TF for these two different frequencies.
3. Evaluate the modeled Etan at 64±1MHz
As shown in Figure 3, the Etan results of 10 Tachy pathways in an adult male model are simulated with SEMCAD X FDTD solver at 64MHz±1MHz MRI RF coil (70cm bore diameter, 60cm coil length). The percentage difference of the Etan magnitude and phase were shown in Figure 4. Over the 10 pathways calculated, the maximum Δ% of averaged Etan magnitude is 2.6% from the original result at 64MHz.
4. Evaluate the MRI filter design
The proximal end of the lead is attached to the AIMD active channel through a sealed feedthru. The MRI RF induced Etan generates a voltage at AIMD header. The header voltage injected to the device may cause unintended stimulation, loss of therapy and/or device malfunction. To mitigate the RF hazard, a filter may be used to attenuate the 64MHz injection. An existing design is simulated and the filter response is shown in Figure 5. Across the frequency range, the relative suppression ratio varies by 0.15dB with the center suppression at 64MHz.
Conclusion
SMS sequence is studied using STFT for the frequency broadening effect. A ±220kHz could be generated through the SMS sequence in the RF transmitter, but the current scanner design of rBW sets an upper limit to the SMS sequences. In the worst case scenario, a 2% variation in the AIMD TF is observed from the tests. The Etan variation is also calculated to be within 2.6% of the result at 64MHz. The variation in RF induced heating is an averaged effect through the integration of TF and Etan. The evaluation gives less than 2% change after including a 1MHz SMS frequency broadening. In terms of SMS impact to the RF injection voltage, the existing design is not sensitive to the SMS sequence.Acknowledgements
Y.D. would like to thank the support from the CRMD division, particularly Dorab Sethna, Lillian Boodaghians and Yash Vardhan Tiwari for the many helpful discussions. Shiloh Sison thanks Dr. Benedikt Poser for the email exchanges and discussions on the SMS technique.References
1.ISO10974, Assessment of the safety of magnetic resonance imaging for patients with an active implantable medical device.
2. Markus Barth, et al. Simultaneous Multislice (SMS) Imaging Techniques, Magnetic Resonance in Medicine 75:63-81 (2016).
3.Philips Achieva 1.5T specification sheet
Figures
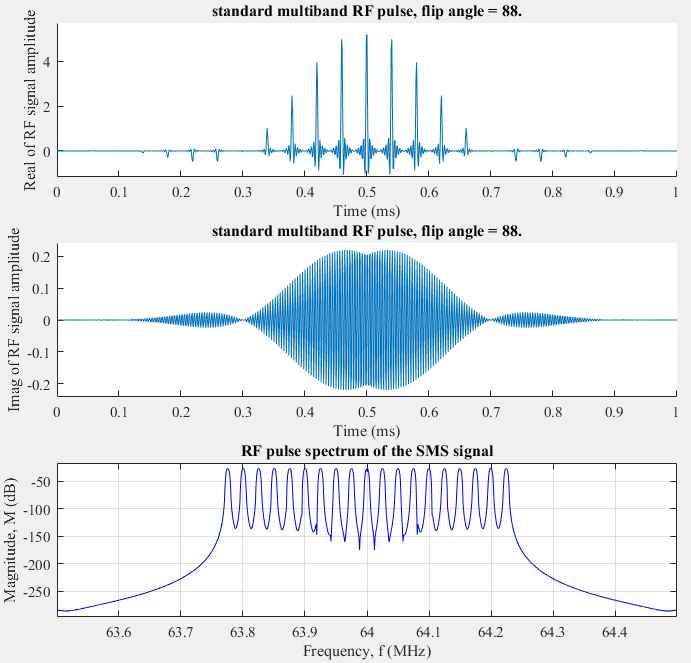
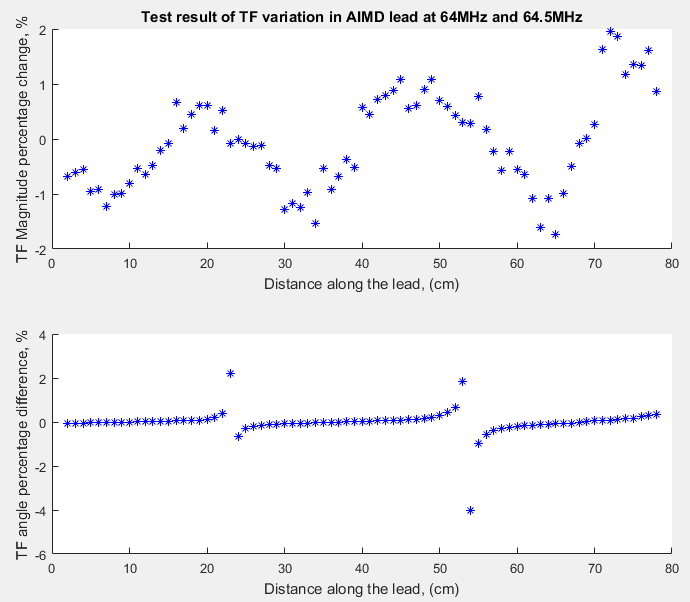
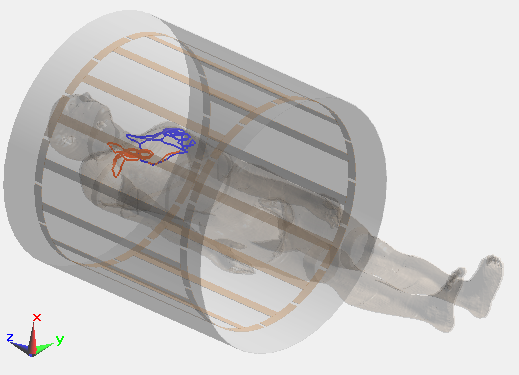
Figure 3. Typical MRI scanner and AIMD lead setup in SEMCAD FDTD modeling. Different pathways are shown in orange and blue.
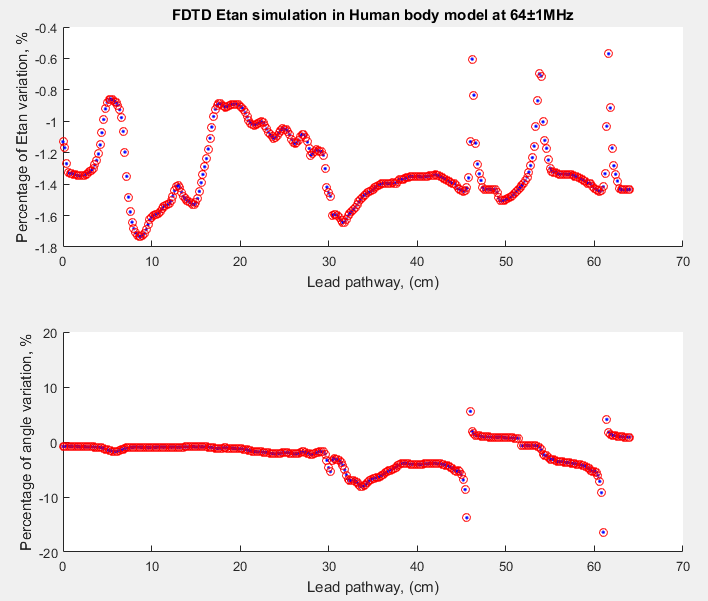
Figure 4. FDTD simulation result of Etan magnitude and phase with excitation frequencies at 64±1MHz. (a) shows the percentage error change in the Etan magnitude, blue is 63MHz, red is 65MHz; (b) shows the percentage angle change.
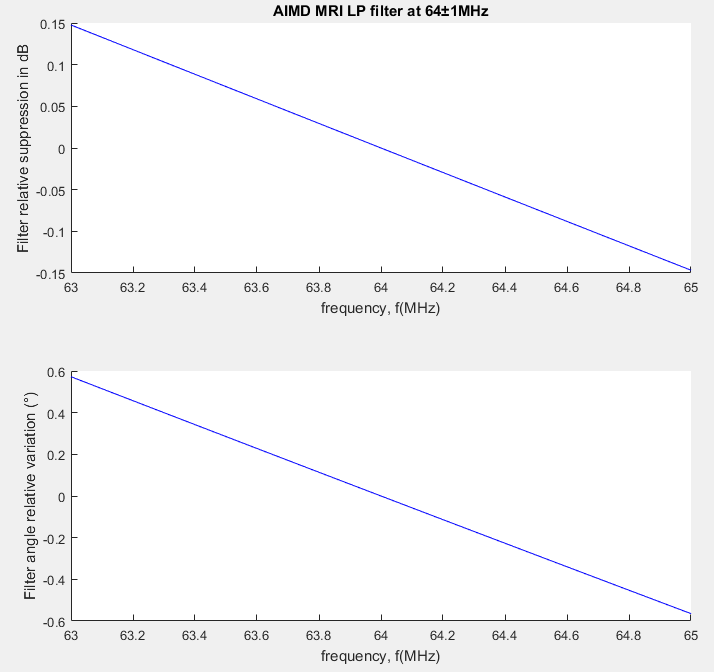
Figure 5. Typical design of AIMD MRI low pass filter shows relative suppression ratio at 64±1MHz. In the design, the feedthru cap is also modeled in the spice simulation.