5580
Optimization of the order and spacing of the sequences to reduce the maximum SAR-induced temperature reached during an MRI examination1Radiology, Center for Advanced Imaging Innovation and Research (CAI2R), New York University, New York, NY, United States, 2Radiology, Bernard and Irene Schwartz Center for Biomedical Imaging, New York University, New York, NY, United States
Synopsis
We demonstrate that the maximum SAR-induced temperature in an examination can be lowered with strategic ordering of the sequences in the exam. Using numerical simulations, here we optimize the order of and time between sequences in a spine exam to minimize the maximum temperature reached in a human body model without increasing the duration of the exam. The optimized sequence has a maximum temperature 0.63 C lower than the original.
Purpose
To reduce maximum temperature induced with RF energy in a subject by sorting the sequences and optimizing the time gaps between each sequence.Introduction
Absorption of RF power through the MRI exam can result in tissues heating, which can cause discomfort in the patient and eventually tissue damage. To ensure safety, the IEC has provided guidelines where Specific Absorption Rate (SAR) and temperature are limited1. Temperature is conditioned by many parameters: material properties, physiological responses and RF exposure duration. In fact, the order of the sequences through the exam affects temperature because the rate of temperature increase is high during sequences with the highest SAR. Time gaps between sequences also affect temperature because, when no SAR is applied, thermal conduction and blood perfusion allow tissues to cool before absorbing heat from successive sequences. Hence, the same sequences in an MRI exam can provide different temperature distribution and maximum temperature in the patient according to the order of the sequences and the time between each sequence. In this work we explore the possibility to reduce the maximum temperature without affecting the duration of the exam by optimizing the order and duration of time between each sequence.Methods
Temperature in the human body can be estimated with the Pennes’ bioheat equation2,
$$\rho{c}\frac{\partial{T}}{\partial{t}}=\nabla\cdot(k\nabla{T})-W\rho_{bl}c_{bl}(T-T_{bl})+Q+\rho{SAR}\;\;(1)$$
where T is temperature, W is rate of perfusion by blood, k is thermal conductivity, ρ is tissue mass density, c is tissue heat capacity, Q is rate of metabolism, and the subscript bl denotes values for blood. Perfusion was allowed to vary according to the model3:
$$W(r)=\begin{cases}W_{0}(r)&T(r)\leq39^{\,\circ}C\\W_{0}(r)(1+S_{B}(T(r)-39))&39^{\,\circ}C<T(r)<44^{\,\circ}C\\W_{0}(r)(1+5S_{B})&T(r)\geq44^{\,\circ}C\end{cases}\;\;(2)$$
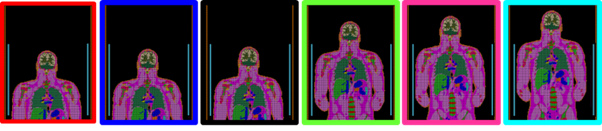
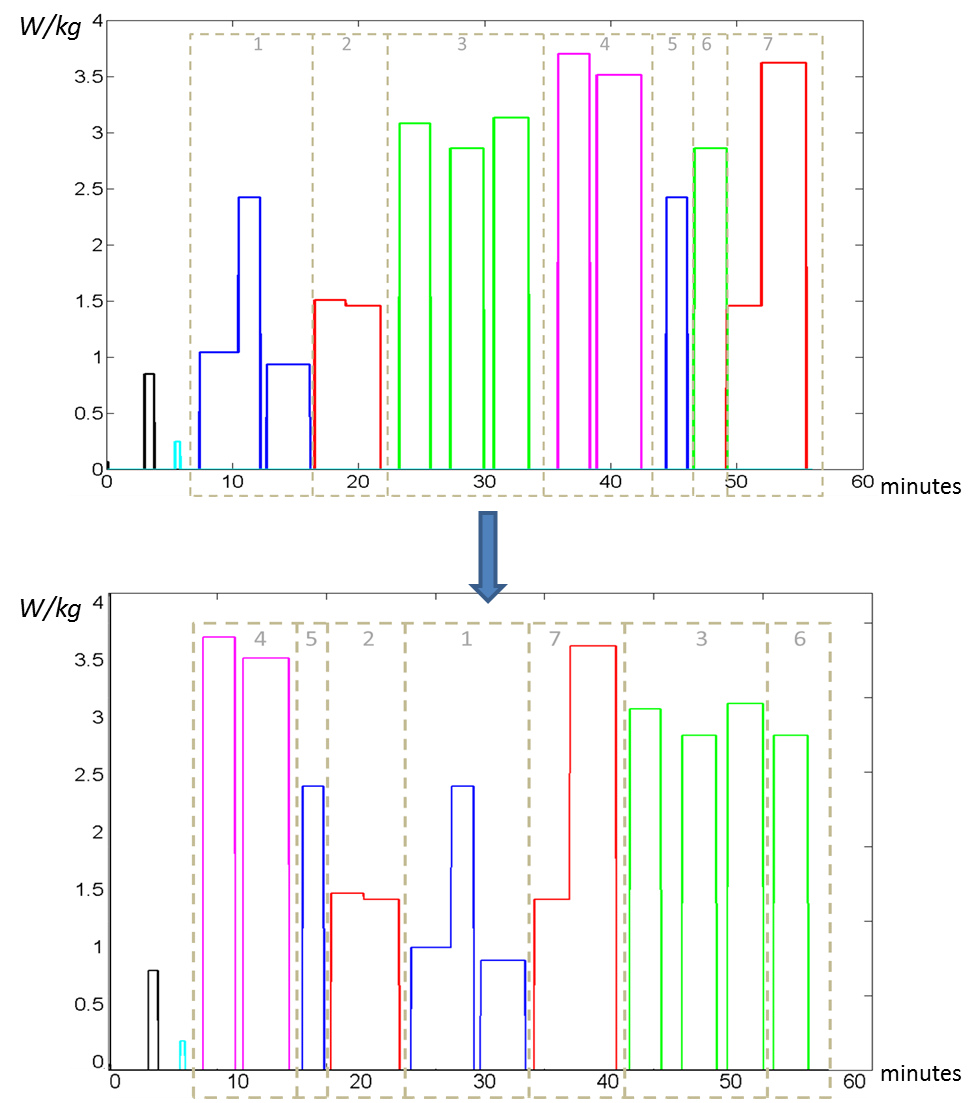
where SB is a parameter equal to 0.8. We have considered the power levels of the MRI exam presented previously4, where the patient was placed in 6 different positions (Fig. 1). Except the first 3 sequences (Low-SAR localizers) which need to be performed at the beginning of the exam, the other sequences have been assigned to 7 groups where each group is composed of successive sequences performed in the same position of the patient so that, in the following sorting process, the time to move the table to different positions is minimized as well. The 7 blocks were ordered according to all the possible permutations (Fig. 2), and for each combination the temperature through all the exam was computed. The temperature computation was performed with a fast method based on the combination of the convolution of temperature responses with the use of a spatial filter to include the variations of the local perfusion4. The order of sequences that minimizes the temperature was further optimized by adjusting the time sequences without increasing the duration of the exam. This optimization has been performed with the Matlab function fminunc, and each iteration has been evaluated with the fast temperature computation method.
Results and Discussion
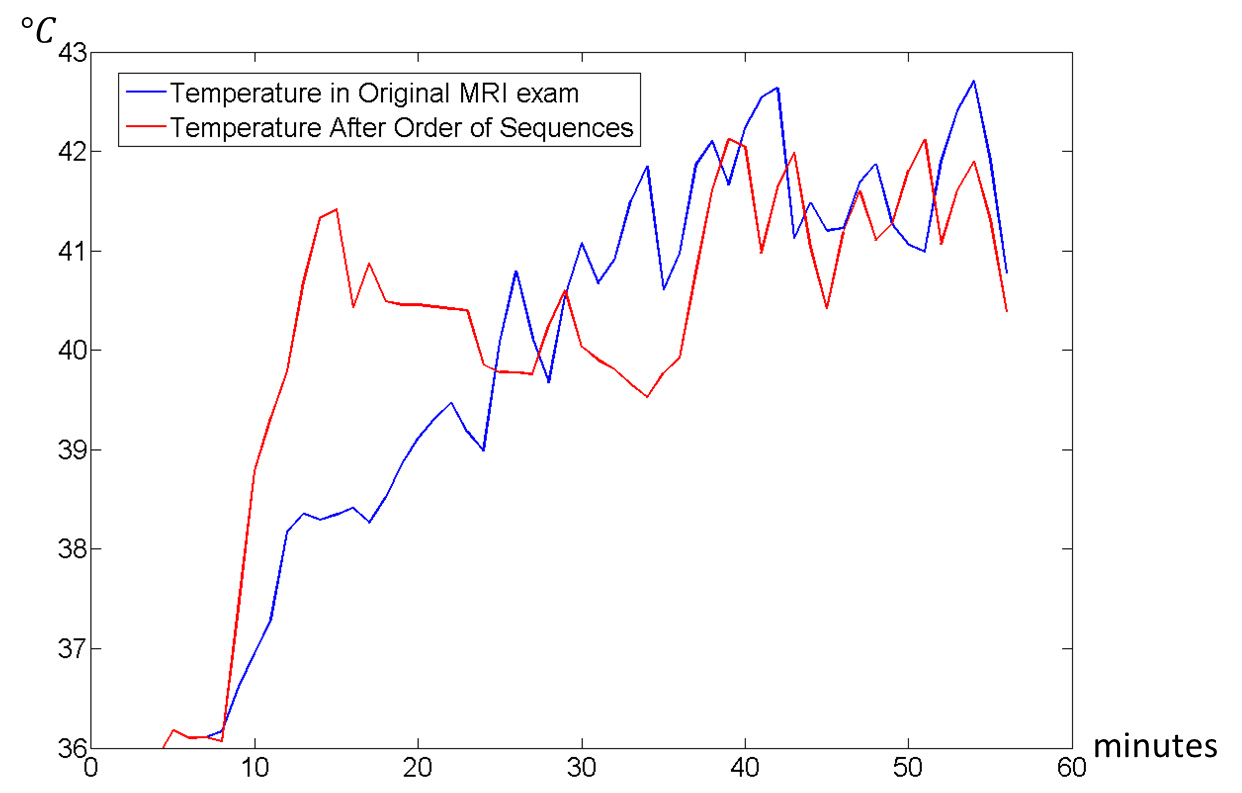
Fig. 2 and Fig. 3 show, respectively, the order of sequences and the timecourse of temperature before and after optimization. Without any optimization, the maximum temperature obtained during the exam is equal to 42.71°C. After the minimization of the temperature considering only the permutation of the blocks the maximum temperature is equal to 42.12°C, while the maximum temperature considering also the optimization of the time gaps between each sequence is equal to 42.08° C. Thus, the optimized sequence has a maximum temperature 0.63°C lower than the original. In this case a more significant reduction in temperature is obtained with the reordering of the sequences, while the optimization of the time gaps has a small overall effect. As expected, the optimization based on permutations split the highest SAR sequences positioning them at the beginning and at the end of the exam. Hence, to limit maximum temperature, the succession of the sequences can be designed so that low SAR sequences can be performed in the middle of the exam so that, after the application of some of the very high SAR sequences, temperature can decrease due to perfusion and thermal conduction before the application of the rest of the high SAR sequences. In this case we target a minimal temperature reached, but an algorithm to minimize thermal dose5 could also be applied.Acknowledgements
We are grateful to the NIH for funding through P41 EB017183.References
1. International Electrotechnical Commission. International standard, medical equipment – part 2: particular requirements for the safety of magnetic resonance equipment for medical diagnosis, 2ndrevision. Geneva: International Electrotechnical Commission; 2002. 601-2-33.
2. Pennes HH. Analysis of tissue and arterial blood temperature in the resting human forearm. Journal of applied physiology. 1948; 93-122.
3. Wang Z, Collins CM. Consideration of Physiological Response in Numerical Models of Temperature During MRI of the Human Head. J Magn Reson Imaging. 2008; 28:1303–1308.
4. Carluccio G, Bruno M, Collins CM. Predicting long-term temperature increase for time-dependent SAR levels with a single short-term temperature response. Magnetic resonance in medicine, 2016; 75:2195–2203.
5. Yarmolenko PS, Jung Moon E, Landon C, Manzoor A,
Hochman DW, Viglianti B, Dewhirst MW Thresholds for thermal damage to normal
tissues: an update. International Journal of Hyperthermia. 2011; 27(4),
320-343.
Figures