5579
Assessment of specific absorption rate and energy deposition in over 14,000 clinical MRI examination at 1.5 and 3 Tesla scanners1Department of Radiology, Northwestern University, Chicago, IL, United States, 2Athinoula A. Martinos Center for Biomedical Imaging, Boston, MA, United States, 3Department of Biomedical Engineering, McCormick School of Engineering, Chicago, IL, United States, 4Siemens Medical Solutions, Boston, MA, United States
Synopsis
Although SAR value is an important factor in device heating, but this study also provides information about the other factors like the total amount of delivered RF energy, time period of RF delivery and most importantly the pause between pulse sequences should be considered
Introduction
MRI is considered the imaging modality of choice in many clinical situations. Unfortunately, MRI is currently contraindicated for a large number of patients who have implanted devices such as pacemakers, deep brain stimulators. Considering the advancing age of the population, increasing number of patients with implanted devices, and increasing availability of MRI, there will be increasing demand to use the diagnostic power of MRI in this patient group. The main associated risks with performing MRI arise from the interaction between the implanted device system and electromagnetic energy deposition. Radiofrequency energy absorption may lead to heating in biologic tissue (1). Moreover, presence of conductive implants in the body raises the concern of RF heating in leads and tissues surrounding such devices. Thermal injury and the subsequent formation of fibrosis may result in increasing capture thresholds, and deterioration of device function (2). Specific absorption rate (SAR), is the dosimetric term used to characterize the thermogenic aspects of the electromagnetic field. Since a single SAR measure cannot sufficiently predict device heating, specific energy dose (SED) defined as the amount of RF energy deposited in an object has also been used. Based on the previous studies, whole body SAR is not very well-associated with the risk to patients with implanted devices, thus in this large study, we aimed to determine the average whole body and local SAR and SED values in patients undergoing different types of MRI exams as a first step to inform risks to patients in the MRI environment.Methods
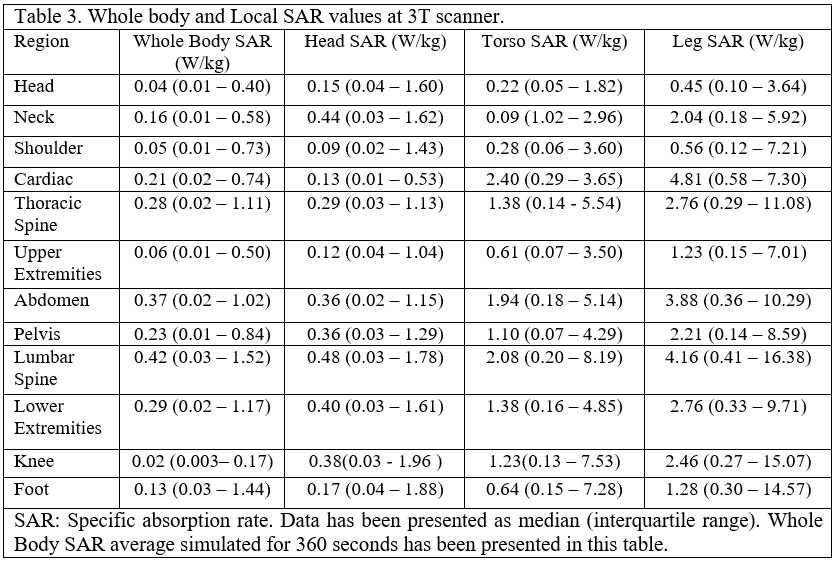
In this retrospective IRB approved study, log files from 22,421 MRI scans performed on 1.5 and 3T scanners (Avanto, Skyra, Siemens, Erlangen, Germany) at our institution between September 2015 and September 2016 were recorded and SAR and SED for 1,076,938 pulse sequences were extracted from these log files. We obtained the MRI scanned region through a query of the enterprise data warehouse at Northwestern Memorial Hospital for the entire study period, successfully matching the scanned region with 14,153 log files. The log-file for each patient was comprehensively parsed to extract SAR, SED, and scan duration times and the pause between each sequence. In the log files, whole body and local SAR values were calculated for 10 and 360 second intervals. For 3T scanners, local SAR values were calculated for head, torso and leg regions. Due to non-normally distributed data based on Kolmogorov–Smirnov testing, results are presented as a median with interquartile ranges (IQR).Results
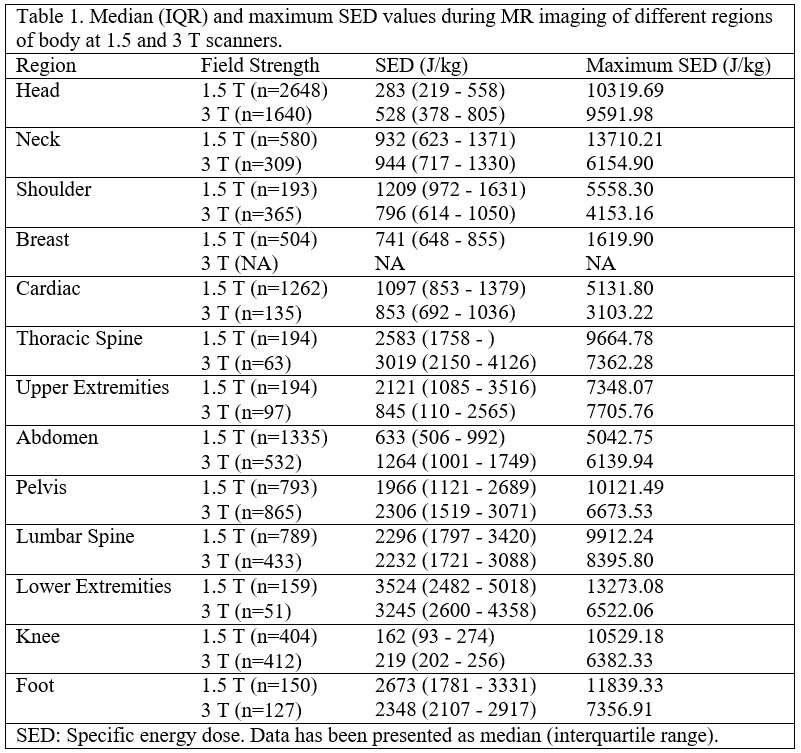
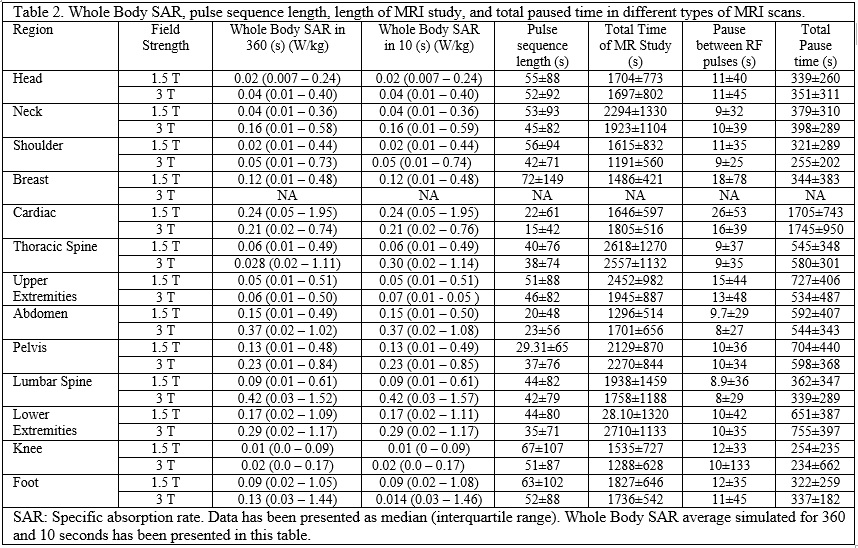
Generally, 3T scans had higher SAR and SED values compared with 1.5T scans when comparing the same region of scan between two scanners (p<0.001) (Table 1). The length of each pulse sequence in 3T scanners were shorter and thus the length of the MRI study was shorter. MRI of the thoracic and lumbar spine had the highest SAR and SED values compared with other types of MRI scans (Table 2). The average whole body SAR value simulated for 360 and 10 seconds have been summarized for different types of MRI scan (Table 2). On Average, between each sequence there was a 12 second pause. Total paused time for different types of MRI scan was about 20%±5% of total length of MRI scan, however, for cardiac MRI, the total length of MRI was similar to the total dead time (Table 2). Analysis of the local SAR showed that during lower extremity MRI studies rate of RF energy deposition in the torso is 50% of the rate of RF energy delivered in lower limb.Discussion
Our findings provide a comprehensive insight into the expected RF-exposure seen across a variety of routine clinical exams and can be used in numerical simulations that aim to predict clinically relevant device heating. The large number of subjects enrolled in this study provides a realistic time interval between each sequence and thus implanted device heating/cooling can be evaluated more accurately. Although SAR value is an important factor in device heating, other factors like the total amount of delivered RF energy, time period of RF delivery and most importantly the pause between pulse sequences should be considered (2). Estimating the exact amount of regional SAR and SED on different implanted devices during different type of MRI scans would provide more information for physicians and MRI technologists to perform MRI safely in patients with implanted devices.Conclusion
Our results provide a comprehensive insight into the expected RF-exposure seen across a variety of routine clinical exams. Educating physicians and MRI techs regarding these values may assist with protocol optimization and investigating device-related complications occurring during or after an MRI exam.Acknowledgements
No acknowledgement found.References
(1) Roguin A, Zviman MM, Meininger GR, Rodrigues ER, Dickfeld TM, Bluemke DA, et al. Modern pacemaker and implantable cardioverter/defibrillator systems can be magnetic resonance imaging safe: in vitro and in vivo assessment of safety and function at 1.5 T. Circulation 2004 Aug 3;110(5):475-82.
(2) Nazarian S, Roguin A, Zviman MM, Lardo AC, Dickfeld TL, Calkins H, et al. Clinical utility and safety of a protocol for noncardiac and cardiac magnetic resonance imaging of patients with permanent pacemakers and implantable-cardioverter defibrillators at 1.5 tesla. Circulation 2006 Sep 19;114(12):1277-84.
Figures