5576
RF Heating Studies on Anesthetized Swine Using Fractionated Dipole Antennas at 10.5 T1University of Minnesota-Center for Magnetic Resonance Research, Minneapolis, MN, United States, 2Athinoula A. Martinos Center for Biomedical Imaging, Department of Radiology, Massachusetts General Hospital and Harvard Medical School, MA, United States, 3Medical Image Analysis and Biometry Laboratory, Universidad Rey Juan Carlos, Madrid, Spain, 4Boston Children's Hospital, Harvard Medical School, MA, United States
Synopsis
We measured temperature increase (ΔT) in anesthetized swine using fluoroscopic probes and compared our results to the simulated solutions obtained from digital models of the same swine. For our studies, we used a 4 channel fractionated dipole array that is placed on the neck/upper back region. Electromagnetic and thermal simulations were performed along with in vivo experiments with different RF excitation patterns at 10.5 T.
INTRODUCTION
Ultra-high field (UHF) Magnetic Resonance Imaging (MRI) yields higher signal to noise ratio (SNR), and increased sensitivity1,2 than conventional MRI. Despite of these advantages, various safety issues limit the clinical use of these systems. Radio-frequency (RF) heating is one of those major safety issues. Previous studies have evaluated the thermal effects of RF heating with simulations and experiments3,4. As a result, diverse engineering solutions were proposed to control and mitigate Specific Absorption Rate (SAR) 5,6 and temperature rise in UHF applications7.
In-vivo validation of simulation tools and models is crucial to assess the RF heating risks accurately. In this work, we conducted RF heating experiments at 447 MHz (i.e. 10.5 T proton Larmor frequency) on anesthetized animals in a controlled RF safety lab environment. We measured temperature in anesthetized swine using fluoroscopic probes and compared our results to the simulated solutions obtained from a digital model of the same swine. For our studies, we used a 4 channel fractionated dipole array that is placed on the neck/upper back region. Electromagnetic and thermal simulations were performed along with in-vivo experiments with different RF excitation patterns at 10.5 T.
METHODS
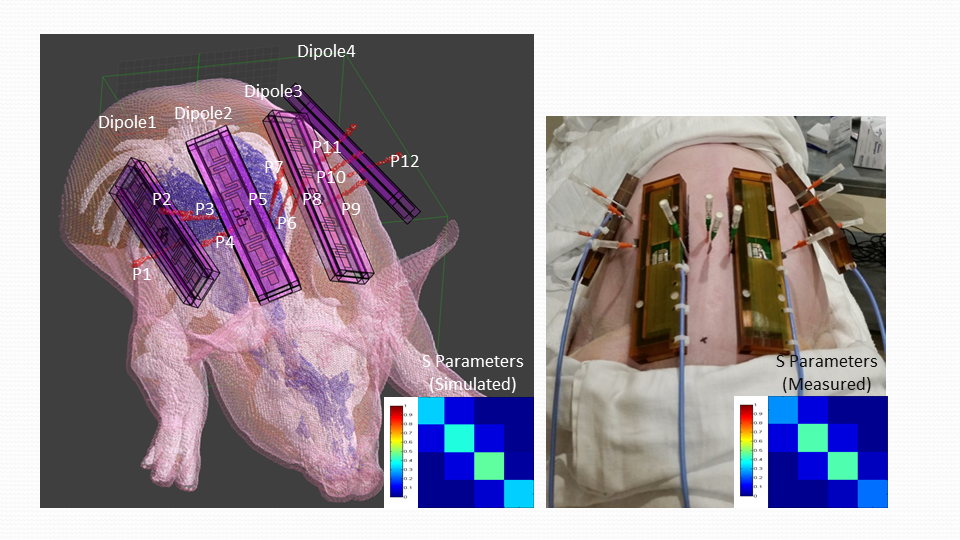
RF heating experiments were performed on 3 swine (Yorkshire-cross). All experiments were conducted in accordance with a UMN IACUC approved protocol (ID: 1408-31748A ). We placed 4 dipoles8 on the animal’s neck-back region and fixed in their locations by using a double sided adhesive tape (3M, Maplewood, US).Then 12 fluoroscopic temperature probes were placed in the swine’s neck and upper back at depths varying between 2 cm and 4 cm in the vicinity of the dipole elements. To drive the 4 dipole elements, a custom built transmit array system was used for the heating experiments. A computer was used to control the phase and gain levels and to generate the desired RF excitation patterns. After the RF heating experiments euthanasia was performed and the swine was transferred to a CT scanner without moving the coils and probes from their locations on the swine. The swine was scanned to obtain axial images of the swine, probes and coil elements.CT images were automatically segmented to obtain different tissue types including fat, muscle, bone, skin and inner air. Similarly, thermal probes and the dielectric material of the dipole blocks were also segmented from the same images.The segmented images were converted to voxel models (.raw) and its associated descriptor files (.txt), and uploaded them in the EM simulation software (Sim4Life v2.2, ZMT, Zurich, Switzerland). We performed EM simulations using harmonic signal analysis of the software (the coil coupling is also taken into account in our EM simulations).Thermal simulations were performed using Sim4Life which has a thermal solver based on the Penne’s Bio-heat equation
RESULTS
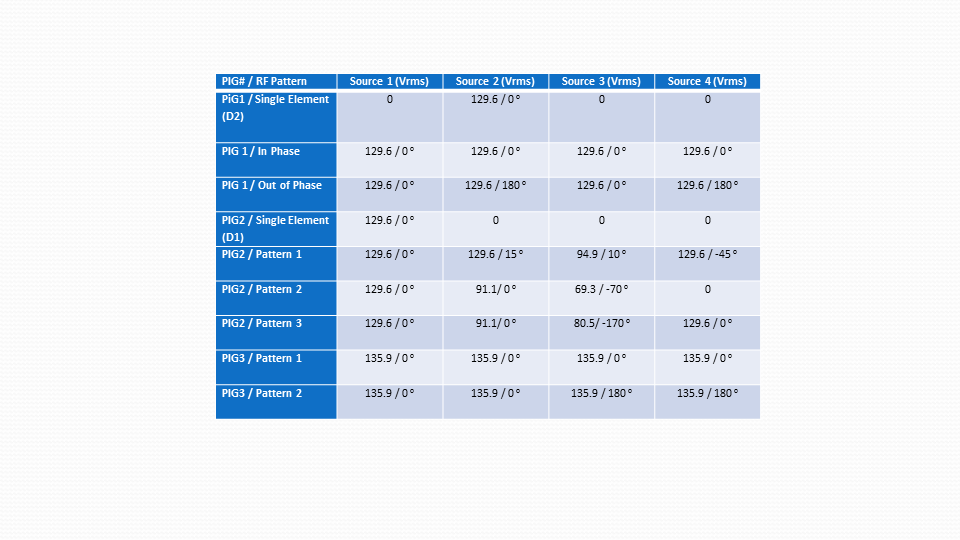
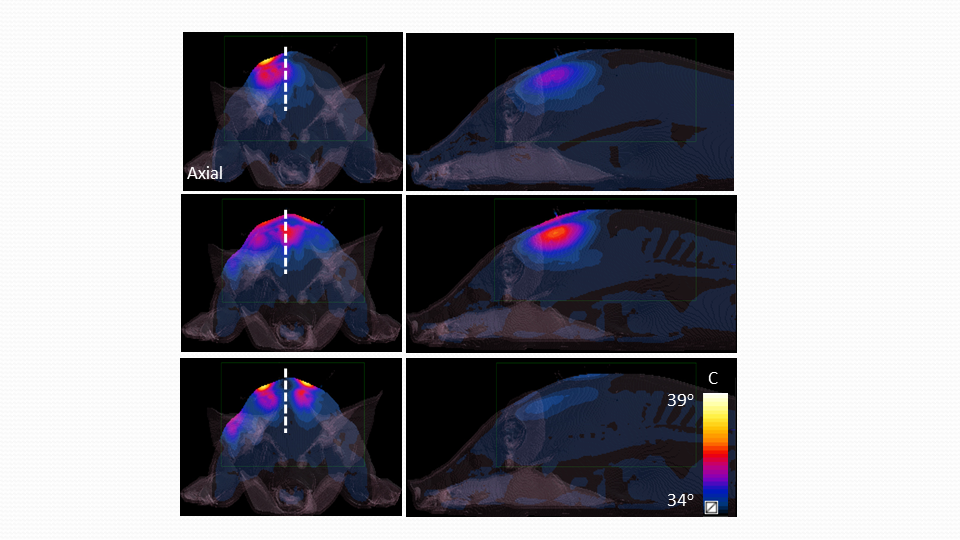
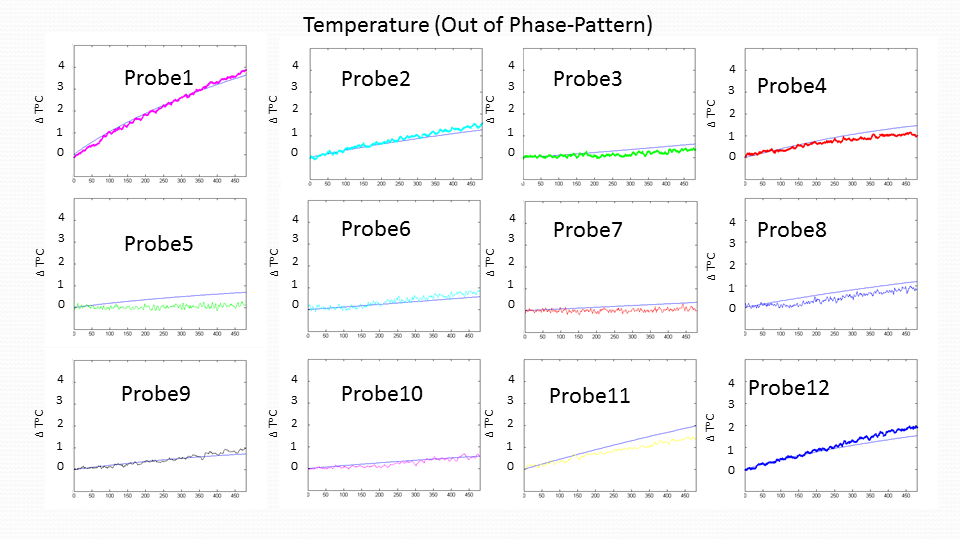
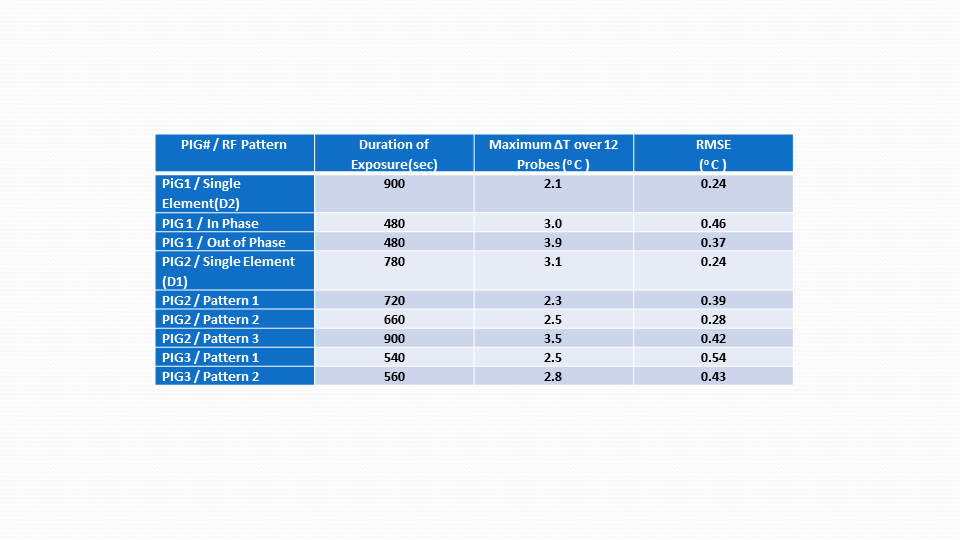
Figure 1 shows the CT based anatomical swine model in Sim4Life. It also shows the S parameter matrices obtained from experiments and simulations.Figure 2 shows the amplitudes and phases that were used to generate different excitation patterns. Figure 3 shows the temperature distribution (axial/sagittal planes) in swine 1 resulting from the 3 different excitation patterns ( 1)single element,2) in-phase pattern and 3)out of phase pattern). Pattern 1 was applied for 900 seconds whereas pattern 2 and pattern 3 were applied for 480 seconds. Maximum temperature increase (measured by the probes) with patterns 1 through 3 were 2.1oC, 3.0oC and 3.9oC respectively. A sagittal temperature map passing between dipoles 2 and 3 shows the resulting distribution due to pattern 2 and 3. Note that the destructive interference of electric fields in pattern 3 resulted in decreased temperature between the elements. Similarly, pattern 2 caused constructive interference of the electric fields resulting in higher temperatures between the dipoles. Figure 4 shows the time variation of the temperature at the 12 probe locations obtained with excitation pattern 3 (the out-of-phase pattern). Plots show both the simulated and experimental data. A close match between the temperature curves can be observed. Finally Figure 5 shows the Maximum ∆T (among all 12 probe locations) at the end of different excitations. The root mean square errors in ∆T obtained by simulations and experiments are also presented for each excitation pattern.DISCUSSION & CONCLUSION
We performed RF heating experiments and simulations with anesthetized swine using dipole arrays at 10.5 T. We used various phase and amplitude patterns to generate different RF excitation patterns. Simulated temperature curves were in agreement with the measured data. Root mean square error (RMSE) between simulated and measured maximum temperature rise is calculated as 0.37 o C (averaged over all experiments).Acknowledgements
Grant Support: P41 EB015894, S10 RR029672, K99EB021173
References
1)Metzger GJ, Snyder C, Akgun C, Vaughan T, Ugurbil K, Van de Moortele PF. Local B1+ shimming for prostate imaging with transceiver arrays at 7T based on subject-dependent transmit phase measurements. Magn Reson Med 2008;59(2):396-409.
2) Vaughan T, DelaBarre L, Snyder C, Tian J, Akgun C, Shrivastava D, Liu W, Olson C, Adriany G, Strupp J, Andersen P, Gopinath A, van de Moortele PF, Garwood M, Ugurbil K. 9.4T human MRI: preliminary results. Magn Reson Med 2006;56(6):1274-1282.
3) Shrivastava D, Hanson T, Schlentz R, Gallaghar W, Snyder C, Delabarre L, Prakash S, Iaizzo P, Vaughan JT. Radiofrequency heating at 9.4T: in vivo temperature measurement results in swine. Magn Reson Med 2008;59(1):73-78.
4) Murbach M, Neufeld E, Capstick M, Kainz W, Brunner DO, Samaras T, Pruessmann KP, Kuster N. Thermal tissue damage model analyzed for different whole-body SAR and scan durations for standard MR body coils. Magn Reson Med 2014;71(1):421-431.
5) Guerin B, Gebhardt M, Cauley S, Adalsteinsson E, Wald LL. Local specific absorption rate (SAR), global SAR, transmitter power, and excitation accuracy trade-offs in low flip-angle parallel transmit pulse design. Magn Reson Med 2014;71(4):1446-1457.
6) Eryaman Y, Guerin B, Keil B, Mareyam A, Herraiz JL, Kosior RK, Martin A, Torrado-Carvajal A, Malpica N, Hernandez-Tamames JA, Schiavi E, Adalsteinsson E, Wald LL. SAR reduction in 7T C-spine imaging using a "dark modes" transmit array strategy. Magn Reson Med 2015;73(4):1533-1539.
7) Boulant N, Wu X, Adriany G, Schmitter S, Ugurbil K, Van de Moortele PF. Direct control of the temperature rise in parallel transmission by means of temperature virtual observation points: Simulations at 10.5 Tesla. Magn Reson Med 2016;75(1):249-256.
8)Ertürk, M. A., Wu, X., Eryaman, Y., Van de Moortele, P.-F., Auerbach, E. J., Lagore, R. L., DelaBarre, L., Vaughan, J. T., Ugurbil, K., Adriany, G. and Metzger, G. J. (2016), Toward imaging the body at 10.5 tesla. Magn. Reson. Med.. doi:10.1002/mrm.26487
Figures