5573
Strong enhancement of relaxivity of gadolinium contrast agent in solution with intracellular viscosity: Quantitative estimation of the deposited contrast agent in the brain1Graduate School of Health Sciences, Hokkaido University, Sapporo, Japan, 2Department of Medical Radiation Technology, Teine Keijinkai Hospital, Sapporo, Japan, 3Faculty of Health Sciences, Hokkaido University, Sapporo, Japan
Synopsis
High T1-weighted signal appears in brain of patients who have experienced MRI examinations using gadolinium contrast agent several times. The relaxation effect of gadolinium contrast agent strongly depends on the viscosity of the solution, and the average viscosity in the cell is higher than that of the free water. However, the relaxation effect of the gadolinium contrast agent in the cell has been unknown. In this study, we investigated the longitudinal relaxivity of it – concentration dependence of longitudinal relaxation rate in solution with intracellular viscosity. The intracellular viscosity strongly enhances the longitudinal relaxivity of the gadolinium contrast agent.
Purpose
High T1-weighted signal appears in brain of patients who have experienced MRI examinations using gadolinium (Gd) contrast agent several times [1]. This evidence indicates the deposition of the Gd contrast agent in the brain and has raised safety concern of repeated MRI examinations with Gd contrast agent. Estimation of the deposited contents of Gd contrast agent in the brain cell is important to discuss the safety of the MRI examination with Gd contrast agent. The Bloembergen-Purcell-Pound theory tells us that the relaxation effect of paramagnetic substance as well as Gd contrast agent strongly depends on the viscosity of the solution, and the average viscosity in the cell is a few tens to a hundred times higher than that of the free water. However, the relaxation time shortening effect of the Gd contrast agent in the cell has been unknown. In this study, we investigated the longitudinal relaxivity of the Gd contrast agent –concentration dependence of longitudinal relaxation rate (R1)– in solution with intracellular viscosity.Materials and Methods
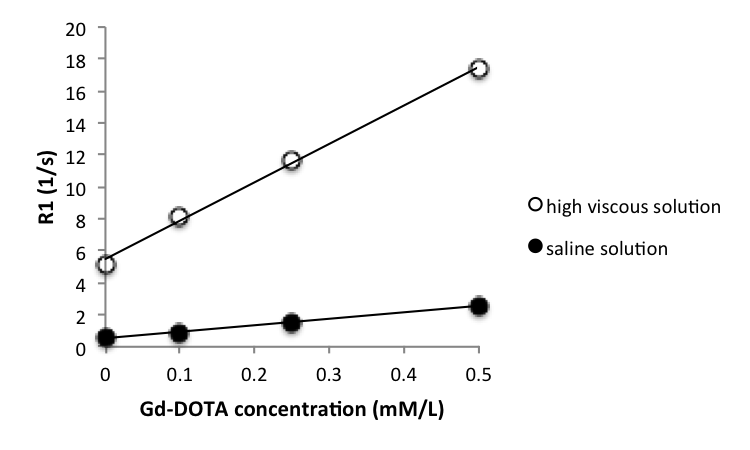
Bottle phantoms of saline solution (1 cP: extracellular mimetic solution) and high viscous solution (60 cP: intracellular mimetic solution)[2] made by mixing glycerol (80% w/w) in saline were prepared and Gd-DOTA (Gadoterate meglumine; Dotarem, Guerbet USA, Bloomington, IN) was doped with different concentrations: 0, 0.1, 0.25, and 0.5 mM/L for each solution. To measure the R1 values at room temperature (24℃), IR-SE imaging of the phantoms was performed in a 1.5-T MRI (Magnetom Aera, Siemens Healthineers) with a built-in body coil; TR was 5000 ms, TE was 6.5 ms, TIs were varied from 30 to 4000 ms. In particular, we employed a wide band width (590 Hz/pixel) to include all chemical shifts of water and glycerin. The R1 values were derived by analyzing the obtained signal intensities at respective TIs using the least mean square method with iteration of the assumed MR signal of infinite TI. The longitudinal relaxivities of the Gd-DOTA in saline and high viscous solution were obtained from the Gd-DOTA concentration dependence of R1 in each solution.Results and Discussion
The R1 values in both saline solution and high viscous solution were linearly correlated (r2 = 0.99) with Gd-DOTA concentration (Fig. 1). The longitudinal relaxivity of Gd-DOTA in saline solution was 4.1 s-1・mM・L-1 which almost agrees with the reported values 3 to 5 s-1・mM・L-1 [3]. On the other hand, the longitudinal relaxivity in high viscous solution increased to 24 s-1・mM・L-1. This evidence indicates that r1 in the cell is approximately 6 times larger than that in the extracellular fluid. The signal intensity (S) in T1-weighted imaging is written as
$$$S=PD・(1 - e^{-R_1・TR})\;\;\;\;\;\;\;\;\;\;\;\;\;\;\;\;\;\;\;\;\;\;\;\;\;\;\;\;\;\;\;\;\;\;\;\;\;\;\;\;\;\;\;\;\;\;\;\;\;\;\;\;\;\;\;\;\;\;\;\;\;\;\;\;\;\;\;\;\;\;\;\;\;\;\;\;\;\;\;\;\;\;\;\;\;\;\;\;\;\;\;\;\;\;\;\;\;\;\;\;\;\;\;\;\;\;\;\;\;\;\;\;\;\;\;\;\;\;\;\;\;\;\;\;\;\;\;\;\;\;\;\;\;\;\;\;\;\;\;\;\;\;\;\;\;\;\;\;\;\;\;\;\;\;\;(1),$$$
where PD is the proton density and R1 is the averaged longitudinal relaxation rate. For simplicity, Eq. 1 sets a proportional constant as 1 and discarded the shortening effect of Gd contrast agent because of the short TE of T1-weighted imaging. Providing that the contrast agent deposits in the cell and the consequent signal change occurs only in the cell, the signal change (ΔS) is given by
$$$ΔS=PD_c・TR・e^{-R_{1c}・TR}・ΔR_1\;\;\;\;\;\;\;\;\;\;\;\;\;\;\;\;\;\;\;\;\;\;\;\;\;\;\;\;\;\;\;\;\;\;\;\;\;\;\;\;\;\;\;\;\;\;\;\;\;\;\;\;\;\;\;\;\;\;\;\;\;\;\;\;\;\;\;\;\;\;\;\;\;\;\;\;\;\;\;\;\;\;\;\;\;\;\;\;\;\;\;\;\;\;\;\;\;\;\;\;\;\;\;\;\;\;\;\;\;\;\;\;\;\;\;\;\;\;\;\;\;\;\;\;\;\;\;\;\;\;\;\;\;\;\;\;\;\;\;\;\;\;\;\;\;\;(2),$$$
where PDc and R1c represent the proton density the longitudinal relaxation rate of the cell, respectively. The R1 change (ΔR1) is the product of r1 and the concentration changes of contrast agent (Δ[Gd]);
$$$ΔR_1=r_1・Δ[Gd]\;\;\;\;\;\;\;\;\;\;\;\;\;\;\;\;\;\;\;\;\;\;\;\;\;\;\;\;\;\;\;\;\;\;\;\;\;\;\;\;\;\;\;\;\;\;\;\;\;\;\;\;\;\;\;\;\;\;\;\;\;\;\;\;\;\;\;\;\;\;\;\;\;\;\;\;\;\;\;\;\;\;\;\;\;\;\;\;\;\;\;\;\;\;\;\;\;\;\;\;\;\;\;\;\;\;\;\;\;\;\;\;\;\;\;\;\;\;\;\;\;\;\;\;\;\;\;\;\;\;\;\;\;\;\;\;\;\;\;\;\;\;\;\;\;\;\;\;\;\;\;\;\;\;\;\;\;\;\;\;\;\;(3),$$$
From Eqs. 1-3, the signal change rate is written as
$$$\frac{ΔS}{S}=\frac{PD_c・TR・e^{-R_{1c}・TR}}{PD・(1 - e^{-R_1・TR})}・r_1・Δ[Gd]\;\;\;\;\;\;\;\;\;\;\;\;\;\;\;\;\;\;\;\;\;\;\;\;\;\;\;\;\;\;\;\;\;\;\;\;\;\;\;\;\;\;\;\;\;\;\;\;\;\;\;\;\;\;\;\;\;\;\;\;\;\;\;\;\;\;\;\;\;\;\;\;\;\;\;\;\;\;\;\;\;\;\;\;\;\;\;\;\;\;\;\;\;\;\;\;\;\;\;\;\;\;\;\;\;\;\;\;\;\;\;\;\;\;\;\;\;\;\;\;\;\;\;\;\;\;\;\;\;\;\;\;\;\;\;\;\;\;\;\;\;\;\;(4),$$$
The right side of Eq. 4 is calculated as follows by using following values; TR = 450 ms [1], PDc/PD = 0.8, R1c = 2 [1/s], R1 = 1 [1/s], r1 is our obtained value of 24 s-1・mM・L-1 in the intracellular mimetic solution.
$$$\frac{ΔS}{S}=9.7・Δ[Gd]\;\;\;\;\;\;\;\;\;\;\;\;\;\;\;\;\;\;\;\;\;\;\;\;\;\;\;\;\;\;\;\;\;\;\;\;\;\;\;\;\;\;\;\;\;\;\;\;\;\;\;\;\;\;\;\;\;\;\;\;\;\;\;\;\;\;\;\;\;\;\;\;\;\;\;\;\;\;\;\;\;\;\;\;\;\;\;\;\;\;\;\;\;\;\;\;\;\;\;\;\;\;\;\;\;\;\;\;\;\;\;\;\;\;\;\;\;\;\;\;\;\;\;\;\;\;\;\;\;\;\;\;\;\;\;\;\;\;\;\;\;\;\;\;\;\;\;\;\;\;\;\;\;\;\;\;\;\;\;\;\;\;(5),$$$
A maximal increase in T1-weighted brain imaging of a patient who had experienced several MR examinations with administration of Gd contrast agent was approximately 20% [1]. The deposited concentration of contrast agent is estimated as 21 nM・L-1 from Eq. 4. Supposing that the volume of the high intensity area is 1 mL, the deposited contents of the contrast agent in that area could be estimated as approximately 3 ppm of a normal dose of Gd contrast agent in an MR examination. When not taking account into the cellular relaxivity (Eq. 4), the deposited value would be overestimated from the simple signal change of R1 in a voxel with a low r1 of the saline solution.
Conclusion
The intracellular viscosity strongly enhances the longitudinal relaxivity of Gd contrast agent.Acknowledgements
References
1. Kanda T, Osawa M, Oba H, et al. Radiology. 2015 Jun;275(3):803-809
2. Kuimova MK, Botchway SW, Parker AW, et al. Nat Chem. 2009 Apr;1(1):69-73
3. Ye Z, Wu X, Tan M, et al. Contrast Media Mol Imaging 2013;8(3):220-228
Figures