5571
Impact of renal impairment on T1-weighted signal increase and gadolinium presence in the rat brain after multiple administrations of gadolinium based contrast agents1MR & CT Contrast Media Research, Bayer Pharma AG, Berlin, Germany
Synopsis
The impact of renal insufficiency on the T1-weighted signal intensity (SI) increase in the cerebellar nuclei (CN) and on the brain gadolinium concentration was evaluated by comparing 5/6-nephrectomized to healthy control rats. Eight weeks after repeated high-dose GBCA administrations a significantly higher CN/pons SI ratio compared to a saline control group was found for linear GBCAs. This was independent of the renal status. No altered SI ratios compared to the saline group were observed after administration of macrocyclic GBCAs. Inductive coupled plasma mass spectrometry revealed higher gadolinium concentrations for all GBCAs in the cerebellum of renally impaired rats.
Purpose
Increased signal intensity (SI) on unenhanced MRI and the presence of gadolinium (Gd) in certain brain regions has been reported after multiple administrations of gadolinium-based contrast agents (GBCAs) in patients with normal renal function.1-3 The potential impact of renal impairment on the SI in the cerebellar nuclei and the brain Gd concentration was systematically evaluated in this rat study.Methods
Renally impaired (5/6-nephrectomized) and healthy control Han-Wistar rats were injected with linear GBCAs (gadodiamide, gadobenate dimeglumine, gadopentetate dimeglumine), macrocyclic GBCAs (gadoterate meglumine, gadoteridol, gadobutrol) or saline. The animals (n=6 per group) received 8 intravenous injections over two weeks each at a dose of 1.8 mmol Gd/kg body weight. After a treatment-free period of 8 weeks the SI in cerebellar nuclei (CN) and pons were evaluated by T1-weighted MRI (three-dimensional turbo-spin echo: TR/TE = 500/19 ms; turbo-factor = 3; resolution = 0.3×0.3×0.8 mm) using a clinical 1.5T system equipped with a dedicated rat-head coil. For image analysis regions of interest were placed around the deep cerebellar nuclei (CN) and the pons and the respective SI ratio CN/pons was calculated. After MRI the animals were euthanized and samples from cerebellum were dissected to determine the Gd concentrations by inductive coupled plasma mass spectrometry (ICP-MS).Results
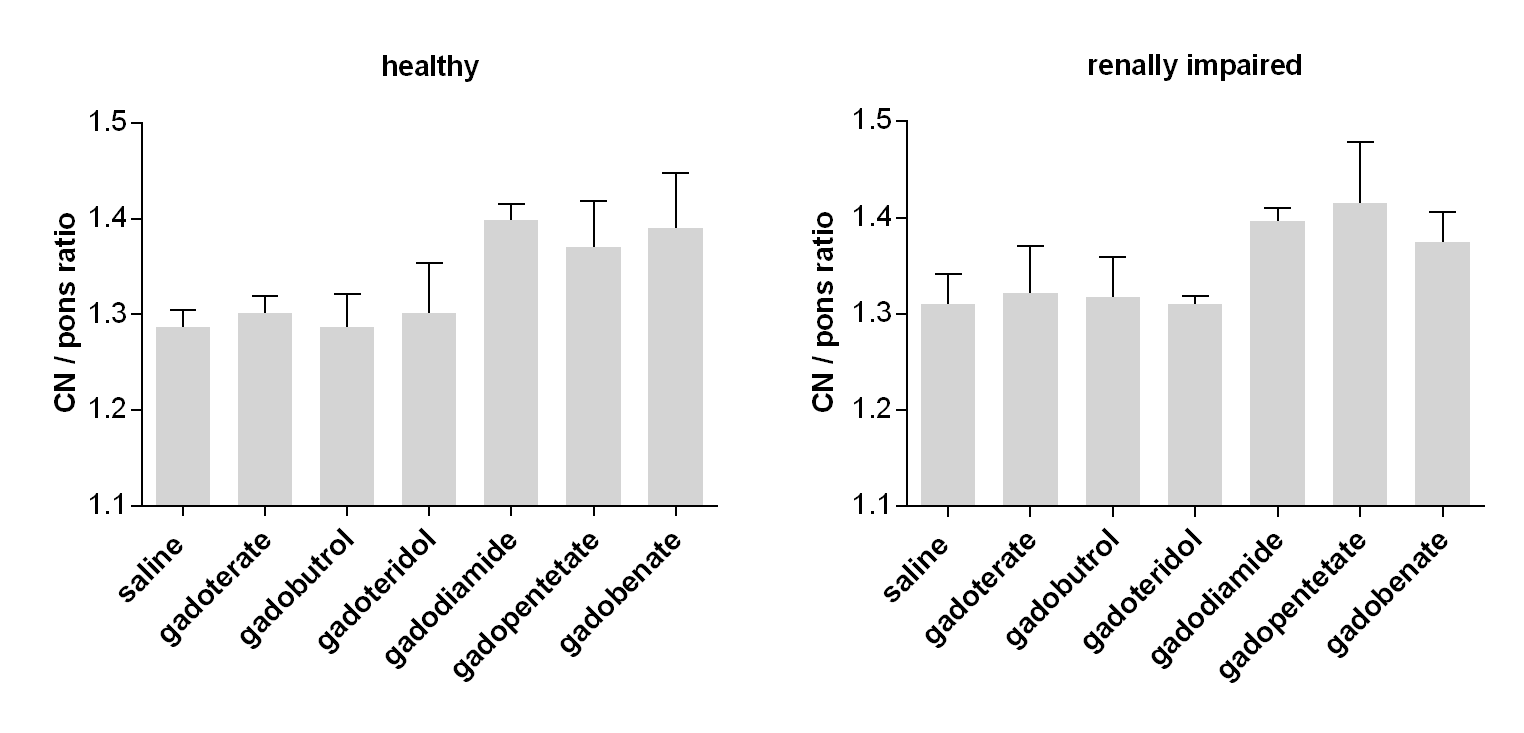
All groups that were administered with the linear GBCAs exhibited significantly higher CN/pons SI ratios compared to the saline group (Fig.1). No distinct difference was observed between healthy control and renally impaired animals. However, gadopentetate dimeglumine treated animals showed a trend for higher SI ratios for the animals with renal insufficiency (Fig.1). The rats treated with macrocyclic GBCAs showed no different CN/pons ratios compared to saline independently of the renal status.
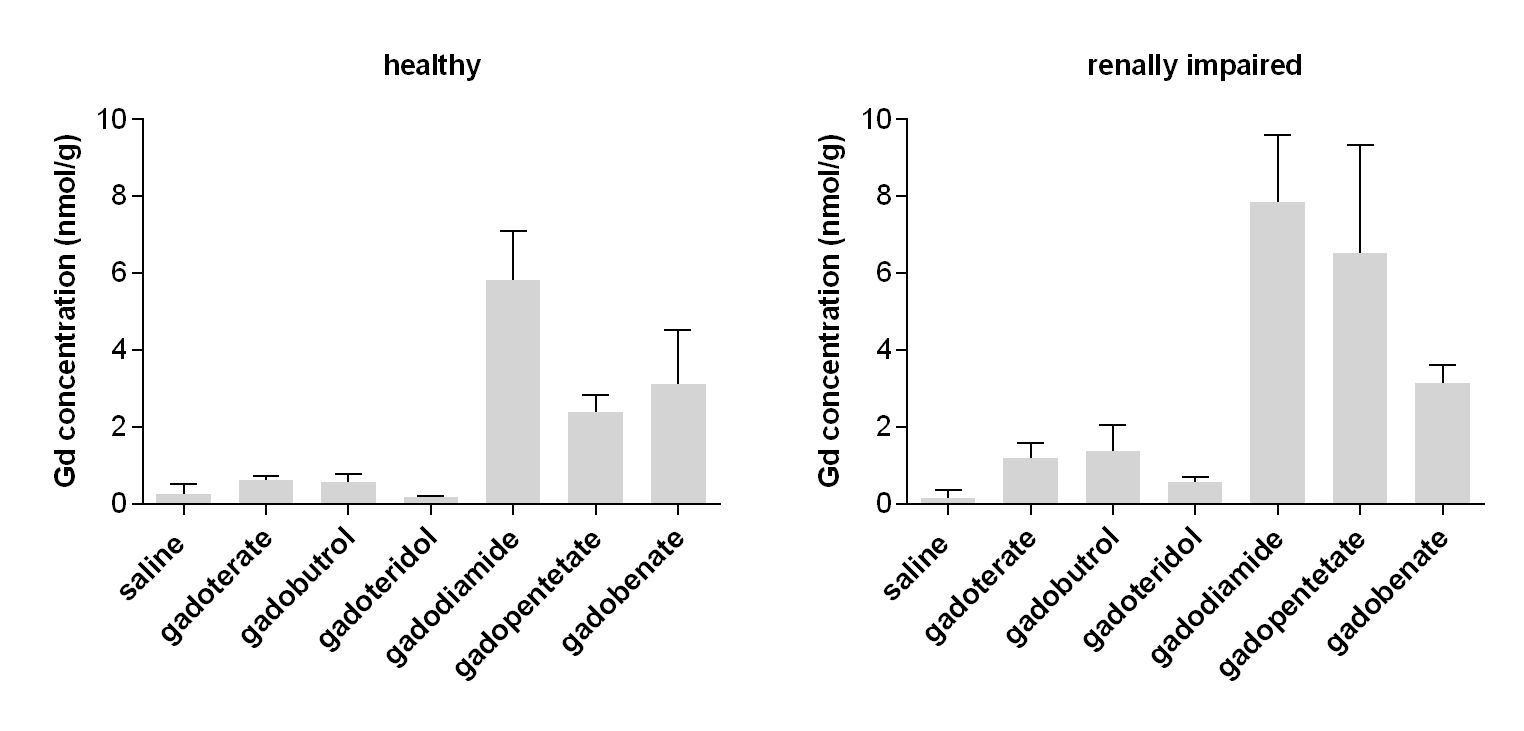
ICP-MS revealed higher Gd concentrations in the cerebellum for all exclusive renally excreted GBCAs in the animals with renal impairment compared to the animals with normal renal function (Fig.2). Substantially higher Gd concentrations were found after administration of linear compared to macrocyclic GBCAs. For healthy animals the highest Gd content in the cerebellum was found after administration of gadodiamide. Compared to the other linear GBCAs a twofold higher concentration was detected (Fig.2). However, in animals with renal insufficiency the Gd concentration for gadodiamide and gadopentetate dimeglumine treated animals were almost comparable. For gadobenate dimeglumine the Gd concentration in the cerebellum remained almost unchanged between healthy and renally impaired rats. However, this result is strongly biased by the different excretion profile between humans and rats. While in humans 3-5% of this agent is taken up by hepatocytes this rate is 50% in rats.4 Thus, in contrast to the other GBCAs investigated an effective hepatobiliary excretion pathway exists for gadobenate dimeglumine in rats.
Conclusion
Renal impairment does not clearly affect the T1-weighted SI increase 8 weeks after repeated high-dose GBCA administration in rats. However, the Gd concentration in cerebellum was moderately increased.Acknowledgements
No acknowledgement found.References
1. Kanda T, Ishii K, Kawaguchi H, et al. High signal intensity in the dentate nucleus and globus pallidus on unenhanced T1-weighted MR images: relationship with increasing cumulative dose of a gadolinium-based contrast material. Radiology. 2014;270:834-41.
2. Errante Y, Cirimele V, Mallio CA, et al. Progressive increase of T1 signal intensity of the dentate nucleus on unenhanced magnetic resonance images is associated with cumulative doses of intravenously administered gadodiamide in patients with normal renal function, suggesting dechelation. Invest Radiol. 2014;49:685-90.
3. Weberling LD, Kieslich PJ, Kickingereder P, et al. Increased Signal Intensity in the Dentate Nucleus on Unenhanced T1-Weighted Images After Gadobenate Dimeglumine Administration. Invest Radiol. 2015;50:743-8.
4. Lorusso V, Arbughi T, Tirone P, de Haen C. Pharmacokinetics and tissue distribution in animals of gadobenate ion, the magnetic resonance imaging contrast enhancing component of gadobenate dimeglumine 0.5 M solution for injection (MultiHance). J Comput Assist Tomogr. 1999;23 Suppl 1:S181-94.
Figures