5567
Gadolinium presence in the brain: Detection and quantification of gadolinium based contrast agents in the cerebrospinal fluid in rats1MR & CT Contrast Media Research, Bayer Pharma AG, Berlin, Germany, 2Institute of Vegetative Physiology, Charité, Berlin, Germany, 3Department of Radiology, Nagoya University Graduate School of Medicine, Nagoya, Japan
Synopsis
The infiltration of six marketed and one experimental gadolinium based contrast agents (GBCA) from blood into the cerebrospinal fluid (CSF) was evaluated in rats by repeated fluid attenuated (FLAIR) MRI up to 4h. Quantitative gadolinium measurements in CSF samples (4.5 and 24h) were performed by ICP-MS. No differences in penetration and distribution into the CSF were observed for the marketed GBCAs. FLAIR imaging demonstrates a kinetic from the inner CSF cavities to the subarachnoid space, suggesting an infiltration via the choroid plexus and a passive distribution with CSF flow. After 24h an almost complete GBCA clearance from CSF was observed.
Purpose
Increased signal intensity (SI) on unenhanced MRI in certain brain regions has been reported after repeated administrations of some gadolinium-based contrast agents (GBCAs).1-7 Autopsy studies verified the presence of gadolinium (Gd) in the enhanced brain structures and suggest a correlation between the Gd present and T1-weighted MRI signal increase.8,9 The pathway of GBCA entry into the brain and its distribution are unknown. One potential pathway – the infiltration of GBCAs from blood into the cerebrospinal fluid (CSF) – was systematically evaluated in this rat study.
Methods
Ninety-six healthy Han-Wistar rats were divided into a saline control and seven GBCA groups (12 animals per group). The animals received a single injection (1.8 mmol Gd/kg body weight, representing the 18-fold human standard dose) of one of three linear, multi-purpose GBCAs (gadodiamide, gadopentetate dimeglumine, gadobenate dimeglumine), one of three macrocyclic GBCAs (gadoterate meglumine, gadobutrol, gadoteridol) or the experimental macromolecular (17 kDa) agent gadomer.10 The infiltration and distribution in the CSF were investigated in six animals per group using repeated fluid-attenuated MRI at 1.5T (3D heavily T2-weighted FLAIR: TR/TE/TI = 9000/553/2250 ms; flip-angle = 180° (initial)/120°(echo train); turbo-factor = 79; spatial-resolution = 0.3 × 0.3 × 0.6 mm). For quantitative image analysis regions of interest were placed at different inner (3rd and 4th ventricle, aqueduct) and outer (subarachnoid space) CSF spaces to evaluate the kinetics over 4 h. Immediately after MRI (at 4.5 h p.i.) a CSF and a blood sample was obtained for analytical Gd quantification by inductively coupled plasma mass spectrometry (ICP-MS). In the remaining six animals per group CSF and blood samples were obtained 24 h p.i. without prior MRI.
Results
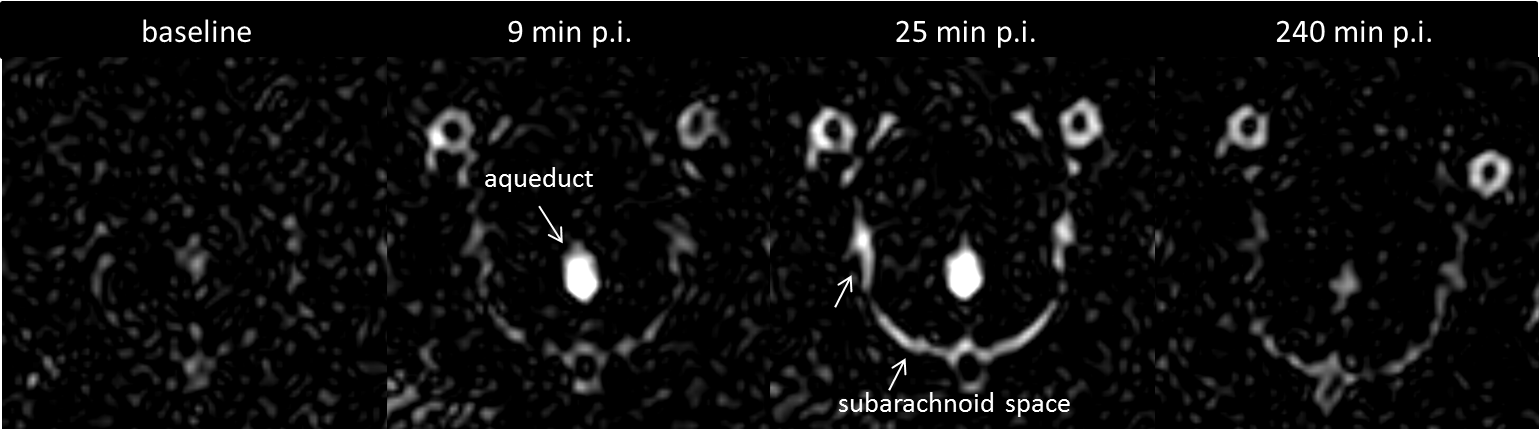
Enhanced SI of the CSF spaces was found in all FLAIR images after GBCA administration (Fig.1). Comparable SI levels with similar kinetics were observed for all GBCAs investigated. A rapid SI increase followed by a successive decline was found in the inner CSF cavities. The CSF signal in the subarachnoid space increased at a slower rate and the subsequent decline was less pronounced.
The Gd concentrations in the CSF and blood showed no substantial differences among the GBCAs. After 4.5 h, the concentration in the CSF (18.8-27.4 nmol/ml) was clearly higher than in blood (2.0-4.7 nmol/ml). After 24 h CSF was almost completely cleared (0.08-0.28 nmol/ml) and the Gd concentration was lower than in blood (0.29-0.76 nmol/ml). For the experimental agent gadomer clearly lower CSF Gd concentrations were found 4.5 h p.i. (5.5 nmol/ml).Discussion
This animal study shows that GBCAs can penetrate from blood into the CSF independent of their chemical structures or physiochemical properties like ionicity. Only the molecular size seems to be an important parameter as shown by the significantly lower CSF Gd concentration for the macromolecular gadomer. Dynamic FLAIR imaging demonstrates a GBCA distribution from the inner CSF spaces to the subarachnoid space. That suggests an infiltration of GBCA from blood into the CSF in the ventricles and a further distribution into the outer CSF spaces. The location of the GBCA infiltration is most likely the choroid plexus that represents the blood-CSF barrier and continuously secrets the CSF. The GBCA distribution and wash-out is driven by the CSF flow that is directed through the ventricles to the subarachnoid space.Conclusion
In contrast to the increased SI in some brain areas, no differences in infiltration and distribution into the CSF of healthy rats among the marketed, multi-purpose GBCAs exists. After 24 hours an almost complete GBCA clearance from CSF was observed.Acknowledgements
No acknowledgement found.References
1. Kanda T, Ishii K, Kawaguchi H, et al. High signal intensity in the dentate nucleus and globus pallidus on unenhanced T1-weighted MR images: relationship with increasing cumulative dose of a gadolinium-based contrast material. Radiology. 2014;270:834-41.
2. Errante Y, Cirimele V, Mallio CA, et al. Progressive increase of T1 signal intensity of the dentate nucleus on unenhanced magnetic resonance images is associated with cumulative doses of intravenously administered gadodiamide in patients with normal renal function, suggesting dechelation. Invest Radiol. 2014;49:685-90.
3. Kanda T, Osawa M, Oba H, et al. High Signal Intensity in Dentate Nucleus on Unenhanced T1-weighted MR Images: Association with Linear versus Macrocyclic Gadolinium Chelate Administration. Radiology. 2015;275:803-9.
4. Radbruch A, Weberling LD, Kieslich PJ, et al. Gadolinium retention in the dentate nucleus and globus pallidus is dependent on the class of contrast agent. Radiology. 2015;275:783-91.
5. Radbruch A, Weberling LD, Kieslich PJ, et al. High-Signal Intensity in the Dentate Nucleus and Globus Pallidus on Unenhanced T1-Weighted Images: Evaluation of the Macrocyclic Gadolinium-Based Contrast Agent Gadobutrol. Invest Radiol. 2015;50:805-10.
6. Weberling LD, Kieslich PJ, Kickingereder P, et al. Increased Signal Intensity in the Dentate Nucleus on Unenhanced T1-Weighted Images After Gadobenate Dimeglumine Administration. Invest Radiol. 2015;50:743-8.
7. Cao Y, Huang DQ, Shih G, Prince MR. Signal Change in the Dentate Nucleus on T1-Weighted MR Images After Multiple Administrations of Gadopentetate Dimeglumine Versus Gadobutrol. AJR Am J Roentgenol. 2016;206:414-9.
8. McDonald RJ, McDonald JS, Kallmes DF, et al. Intracranial Gadolinium Deposition after Contrast-enhanced MR Imaging. Radiology. 2015;275:772-82.
9. Kanda T, Fukusato T, Matsuda M, et al. Gadolinium-based Contrast Agent Accumulates in the Brain Even in Subjects without Severe Renal Dysfunction: Evaluation of Autopsy Brain Specimens with Inductively Coupled Plasma Mass Spectroscopy. Radiology. 2015;276:228-32.
10. Misselwitz B, Schmitt-Willich H, Ebert W, et al. Pharmacokinetics of Gadomer-17, a new dendritic magnetic resonance contrast agent. MAGMA. 2001;12:128-34.
Figures