5564
Characterization of Gadolinium Deposition in the Brain Manifest as T2-hypointensity and T1-hyperintensity Associated with Repeat Monthly Triple-Dose Gadopentetate Dimeglumine Administration for 2 years in the BECOME Trial1Radiology, University Hospitals Cleveland Medical Center, Cleveland, OH, United States, 2Case Western Reserve University School of Medicine, Cleveland, OH, United States, 3Department of Biomedical Engineering, Case Western Reserve University School of Medicine, Cleveland, OH, United States, 4Radiation Oncology, University Hospitals Cleveland Medical Center, Cleveland, OH, United States, 5Department of Neurology, Rutgers-New Jersey Medical School, Newark, NJ, United States, 6Neurology, Washington University School of Medicine, St. Louis, MO, United States
Synopsis
We characterize the brain parenchymal deposition of Gadolinium (Gd) in the dentate nucleus (DN) and globus pallidus (GP) in a cohort of 16 subjects with multiple sclerosis (MS), each of whom had systematically received one year of serial monthly triple dose Gd (3-dose Gd) and optional additional monthly exposure for a second year. Progressive increase in T1 signal and decrease in T2 signal is found in both the dentate nucleus and globus pallidus.
PURPOSE:
We characterize the brain parenchymal deposition of Gadolinium (Gd) in the dentate nucleus (DN) and globus pallidus (GP) in a cohort of 16 subjects with multiple sclerosis (MS), each of whom had systematically received one year of serial monthly triple dose Gd (3-dose Gd) and had optional additional monthly exposure for a second year. Progressive increase in T1 signal and decrease in T2 signal is found in both the dentate nucleus and globus pallidus.BACKGROUND:
Recently, Kanda et al and others have described a phenomenon of long term Gadolinium deposition in the dentate nucleus that manifest as hyperintensity on noncontrast T1 weighted images even months after intravenous Gd administration, a poorly understood phenomenon of unknown clinical significance1,2. To date, studies of Gd deposition have not presented data with controlled, consistent dosing. To further elucidate the characteristics and time course of parenchymal gadolinium accumulation, a previously collected longitudinal high-dose gadolinium dataset from the BECOME multiple sclerosis trial3,4 was re-evaluated. These exams provide a unique dataset for considering the characterization of long-term Gd staining. 16 of these cases were analyzed in this study.METHODS:
In a prior investigation, subjects with relapsing forms of MS had been enrolled in a trial in which they were randomized to be treated with Beta Interferon-1b or Glatiramer Acetate. To monitor efficacy, subjects underwent monthly MRI, before and after receiving monthly cumulative 0.3 mmol/kg Gadopentetate dimeglumine for 13 consecutive months, totaling 39 dose equivalents of Gd per patient. The patients were permitted continue treatment for one addition year with optional monthly imaging. For this current study, the imaging dataset included T1 weighted precontrast images (T1w), T1 weighted fat saturated precontrast images (T1FS), and T2 weighted images (T2w) from 16 MS patients. All scans were performed on a single 3-T Siemens Allegra Unit. TR, TE, voxel size, angulation and positioning along corpus callosum line remained constant for all patients throughout the study. Patients received a mean of 12.3 (SD 0.7) triple-doses in study year 1 and 5.3 (SD 3.3) triple-doses in study year 2. Images were analyzed at the screening time point, 12 months, and 24 months. For each exam, ImageJ (NIH) software was used to sample the mean intensity of a portion of the bilateral globus pallidus (GP) and bilateral dentate nuclei (DN), referenced to intraslice white matter (WM) intensity. Identification of the GP and DN was facilitated by their characteristic susceptibility artifact on matched T2w. Image Contrast Ratios (ICR) of mean signal intensity of nucleus to WM (GP/WM or DN/WM, respectively) were calculated and reported.
RESULTS:
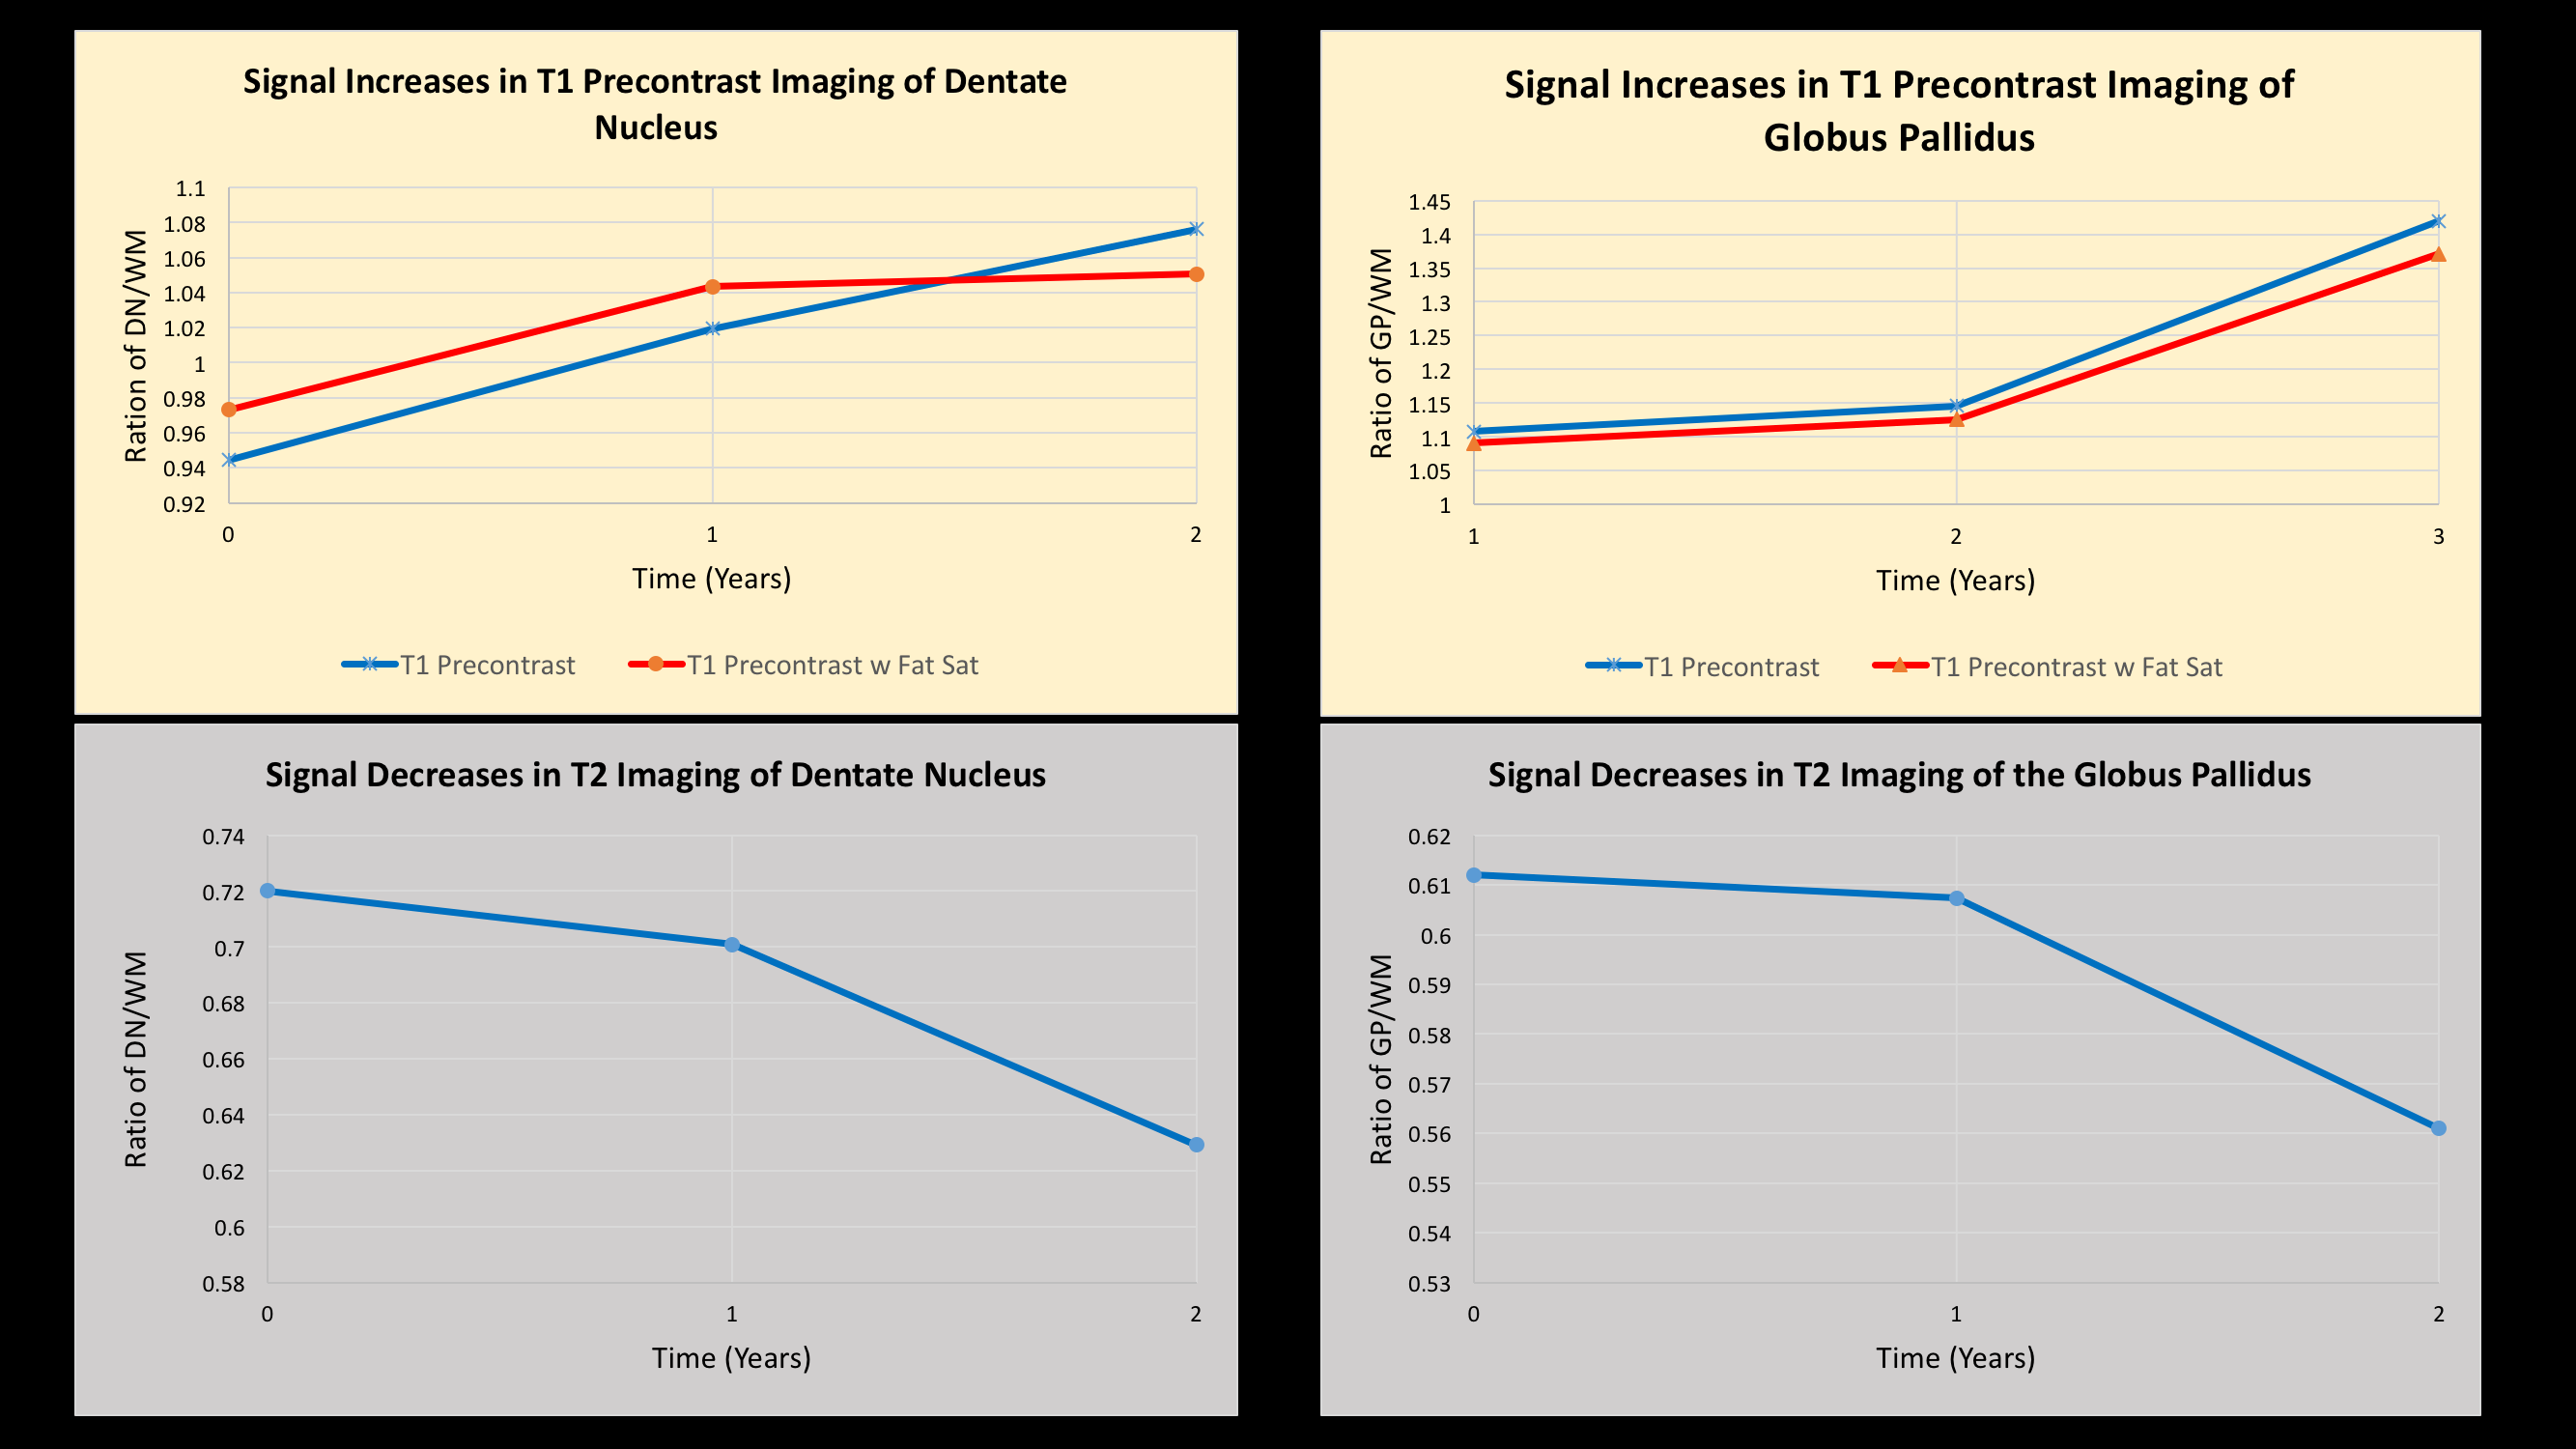
There was progressive increase in signal of the dentate nucleus and globus pallidus on T1w. The ICR for time points 0, 12 months and 24 months respectively were 0.94, 1.01 and 1.08 for the DN; and 1.11, 1.15 and 1.41 for the GP.
There was also progressive increase in signal of the dentate nucleus and globus pallidus on T1FS. The ICR for time points 0, 12 months and 24 months respectively were 0.97, 1.04 and 1.05 for the DN; and 1.09, 1.13 and 1.37 for the GP.
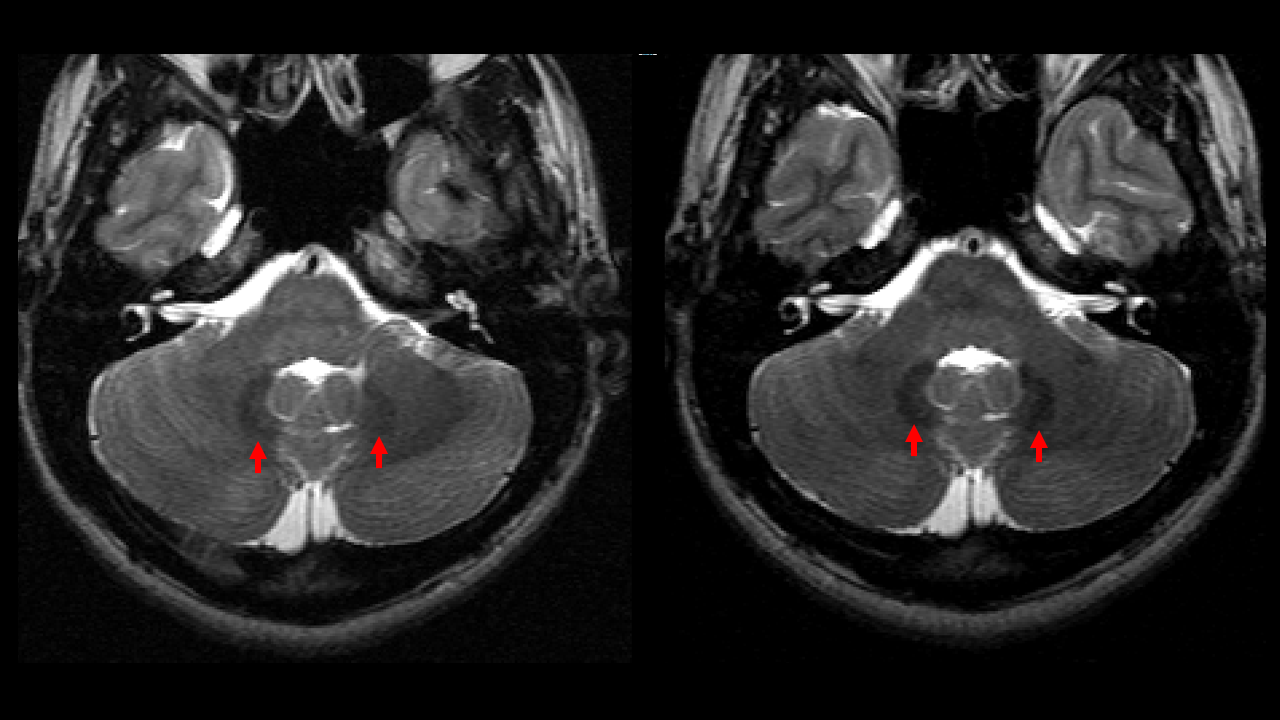
Interestingly, there was progressive decrease in signal of the dentate nucleus and globus pallidus on T2w. The ICR for time points 0, 12 months and 24 months respectively were 0.72, 0.70 and 0.63 for the DN; and 0.612, 0.607 and 0.561 for the GP.
CONCLUSION:
Monthly administration of triple-dose Gadopentetate Dimeglumine is associated with Gd deposition, which progressively increases with subsequent doses. Our study supports earlier investigations in showing increased T1 signal with high cumulative doses of Gd. Gadolinium-staining induced T2 signal reduction is also demonstrated for the first time. In contradistinction to the T1 hyperintensity, which is probably related to Proton Electron Dipole Dipole Relaxation Enhancement, the T2 hypointensity likely represents T2 selective relaxation enhancement (magnetic susceptibility) due to inhomogeneous distribution of Gd in the tissues. Recognition of this phenomenon invites further study of Gd deposition by manipulating susceptibility.Acknowledgements
Travel expenses were subsidized in part by a University Hospitals Cleveland Medical Center Association of Residents and Fellows (ARF) Travel AwardReferences
1. Kanda T, Ishii K, Kawaguchi H, Kitajima K, Takenaka D. High signal intensity in the dentate nucleus and globus pallidus on unenhanced T1-weighted MR images: relationship with increasing cumulative dose of a gadolinium-based contrast material. Radiology. 2014 Mar; 270(3):834-41
2. McDonald RJ, McDonald JS, Kallmes DF, Jentoft ME, Murray DL, Thielen KR, Williamson EE, Eckel LJ. Intracranial Gadolinium Deposition after Contrast-enhanced MR Imaging. Radiology. 2015 Jun;275(3):772-82.
3. Wolansky LJ, Cadavid D, Punia V, Kim S, Cheriyan J, Haghighi M, Cook SD. Hypophosphatemia is Associated with the Serial Administration of Triple-Dose Gadolinium to Patients for Brain MRI. J Neuroimaging. 2015 May-Jun;25(3):379-83.
4. Wolansky LJ, Haghighi MH, Sevdalis E, Cook SD, Sethi N, Liu J, Joseph G, Tulloch K, Cadavid D. Safety of serial monthly administration of triple-dose gadopentetate dimeglumine in multiple sclerosis patients: preliminary results of the BECOME trial. J Neuroimaging. 2005 Jul;15(3):289-90.
Figures