5562
Gadolinium Containing Metabolites in Brain Tissue. A Study in Rats1Bayer AG, Berlin, Germany, 2University of British Columbia, Vancouver, BC, Canada
Synopsis
After the repeated dosing of linear or macrocyclic GBCAs in rats, the brain was fractionated 3 and 24d p.i. Cerebrum, cerebellum and pons were separated, homogenized and divided into an insoluble and soluble fraction, which was separated into low and high molecular weight molecules. The gadolinium concentration in the brain was very low. A large portion of the Gd in the linear GBCA groups was found in the insoluble fraction and a smaller portion in large macromolecules. The Gd in the macrocyclic GBCA groups was only found in the soluble fraction and in small molecules. Gd excretion was still ongoing.
PURPOSE
In multiple studies1,2 a signal enhancement of brain structures during T1-weighted non-contrast MRI was observed in patients who received multiple injections of linear gadolinium based contrast agents (GBCAs). In this rat study potential new gadolinium containing metabolites in the brain were investigated.METHODS
Contrast Agents: Linear: Gd-DTPA (Magnevist®), gadobenate (Multihance®), gadodiamide (Omniscan®). Macrocyclic: Gadobutrol (Gadovist®) and Gd-DOTA (Dotarem®).
Animal study: Six groups of 10 rats received 10 daily intravenous injections with one of the GBCAs at a dose of 2.5mmol/kg or with saline. On day 3 and 24 after the last injection (p.i.) 5 animals of each group were sacrificed. The brains were excised and divided into cerebrum, cerebellum and pons.
Tissue fractionation: The 3 brain sections were homogenized in buffer pH 7.4 by sonication. The soluble and insoluble fractions were separated by centrifugation and the pellet was washed 3 times. The supernatant was analyzed by gel permeation chromatography to investigate the molecular weight distribution of Gd species. The Gd concentration in all fractions was measured by ICP-MS.
Chromatography: GPC-column: Superdex75. Solvent: 10mM Tris, 40mM NH4-formate, pH 7.4, 0.9ml/min. ICP-MS was used to obtain 158Gd specific chromatograms.
Recovery study: Cerebrum was spiked with each GBCA and was treated as the samples. For all GBCAs 94-96% of the gadolinium was recovered in the soluble and insoluble fraction which contained 4-7%.
RESULTS
Gadolinium concentration in brain tissue fractions (Fig.1): The recovery of gadolinium in all tissue fractions was 87±12% for all tissues and GBCAs.
Tissue homogenate: The Gd concentration was higher for the linear than for the macrocyclic agents in all brain sections. The concentration for gadobenate was lower, because of its additional hepatic excretion. A strong decrease was observed between day 3 and 24p.i. which was more pronounced for the macrocyclic agents.
Soluble fraction: The Gd concentration in the soluble fraction was almost identical for the macrocyclic and linear agents. From day 3 to day 24 a decrease by 60-73% was observed.
Insoluble fraction: The Gd concentration in the insoluble fraction was very low for the macrocyclic GBCA groups, comparable to the recovery study. For the linear GBCA groups 40-67% of the gadolinium in the tissue was present in the insoluble fraction which did not change much between day 3 and 24p.i.The Gd concentrations was usually highest in cerebrum and lowest in pons, but the differences were small.
Gel permeation chromatography: After injection of linear agents a peak in the macromolecular region corresponding to >250-300kD, was detected (see Fig 2), which accounted for 5-20% of the soluble gadolinium fraction (Fig. 1). No such peaks were observed in the macrocyclic GBCA Groups.
DISCUSSION
This bioanalytical study is a continuation of a study in rats3, where increased MRI signal intensities were observed in the cerebellar nuclei after 10-fold injection of linear GBCA (results not presented here). From the same animals, brains tissue fractions were prepared and separated into low and high molecular weight molecules using very mild conditions. For all GBCAs the total amount of Gd in the brain was only a trace of the accumulated injected dose (< 0.0006%). The gadolinium injected as a macrocyclic GBCA was only present in the soluble and low-molecular weight fractions, indicating that it is still chelated with the ligand of the GBCA. A strong decrease of the concentration occurred from day 3 to 24p.i., indicating that the elimination process of the macrocyclic GBCAs from the brain was still ongoing. On the other hand, a large portion of the gadolinium from linear GBCAs was present in the insoluble fraction. This fraction was not investigated any further due to the lack of suitable mild methods to solubilize the pellet without compromising the contained Gd-species. Potential components are highly insoluble gadolinium phosphate, carbonate or hydroxide, or cell debris and denatured macromolecules, which may also bind gadolinium or entrap intact GBCAs.
The soluble tissue fraction from animals injected with all linear GBCAs contained a substantial amount of large macromolecular Gd species with >250-300kD which have not been detected before. These macromolecules could be proteins with Ca-binding properties, neuromelanins or glucosaminoglycanes but their true nature awaits further investigation.The presence of insoluble and macromolecular Gd species points to transmetallation as one possible source for metabolization of linear GBCAs which is supported by earlier findings in in-vitro tests in human serum4.
CONCLUSION
Only the repeated injection of linear GBCAs into rats resulted in insoluble compounds or large macromolecules as newly formed gadolinium species. This was not observed when macrocyclic GBCAs were injected. Further studies are necessary to reveal the nature of the detected Gd species.Acknowledgements
No acknowledgement found.References
1. Kanda T, Ishii K, Kawaguchi H, et al. High signal intensity in the dentate nucleus and globus pallidus on unenhanced T1-weighted MR images: Relationship with increasing cumulative dose of a gadolinium-based contrast material. Radiology. 2014;270(3):834-841.
2. Kanda T, Oba H, Toyoda K, et al. Brain gadolinium deposition after administration of gadolinium-based contrast agents. Jpn J Radiol. 2016;34(1):3-9.
3. Jost G, Lenhard DC, Sieber MA, et al. Signal increase on unenhanced T1-weighted images in the rat brain after repeated, extended doses of gadolinium-based contrast agents: Comparison of linear and macrocyclic agents. Invest Radiol. 2016;51(2):83-9.
4. Frenzel T, Lengsfeld P, Schirmer H, et al. Stability of gadolinium-based magnetic resonance imaging contrast agents in human serum at 37 degrees C. Invest Radiol. 2008;43(12):817-28.
Figures
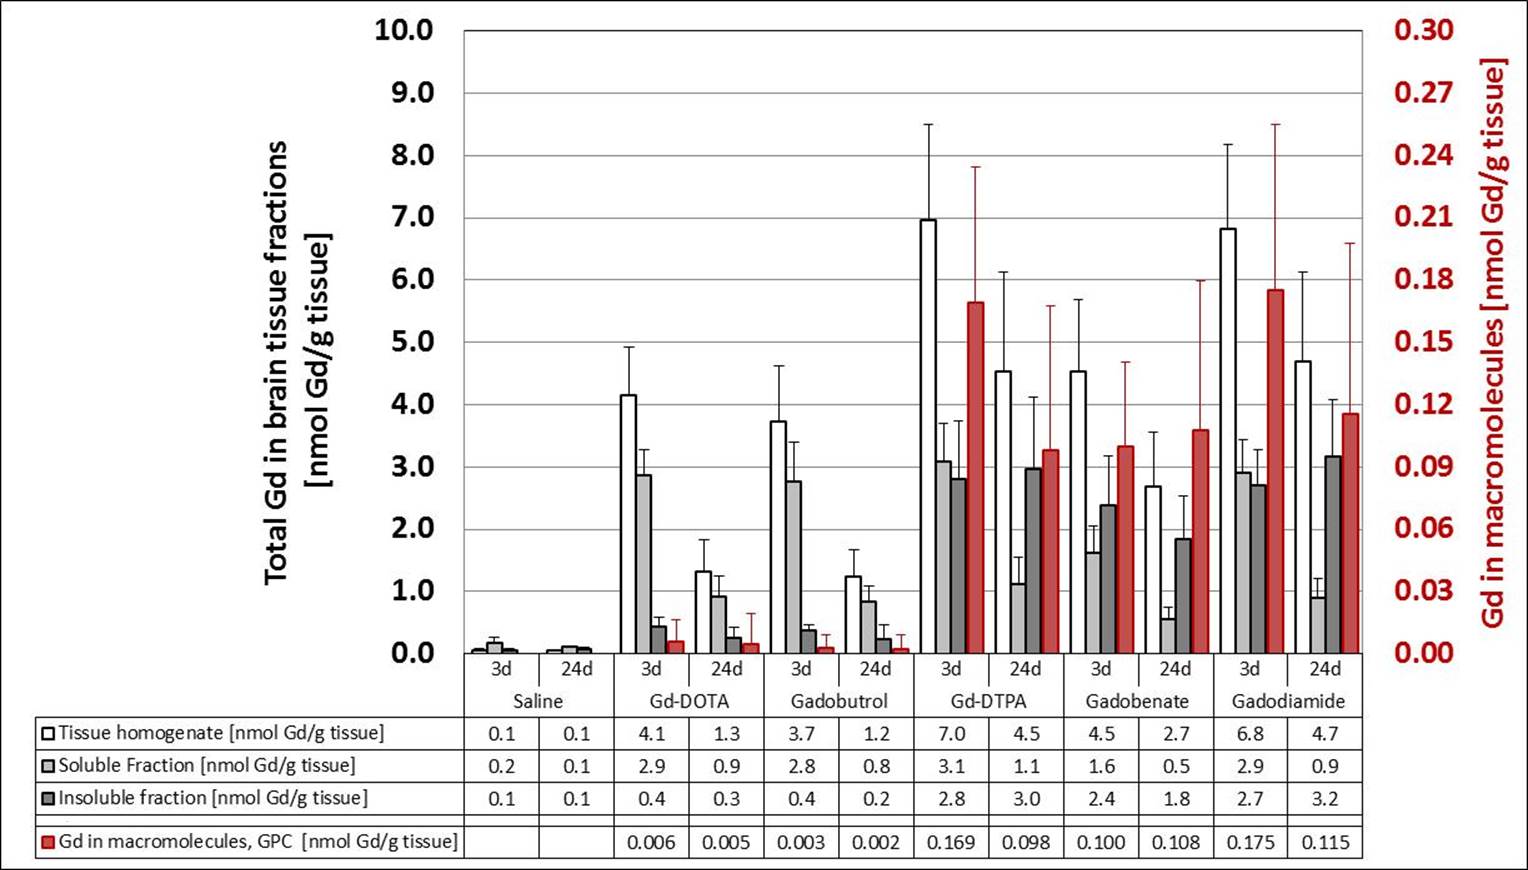
Figure 1: Gd concentrations in the brain fractions on day 3 and 24 p.i. and (in red) the amount of Gd in macromolecules. The tables show the mean of the 3 brain sections in 5 animals for each day. The SD is shown in the error bars.
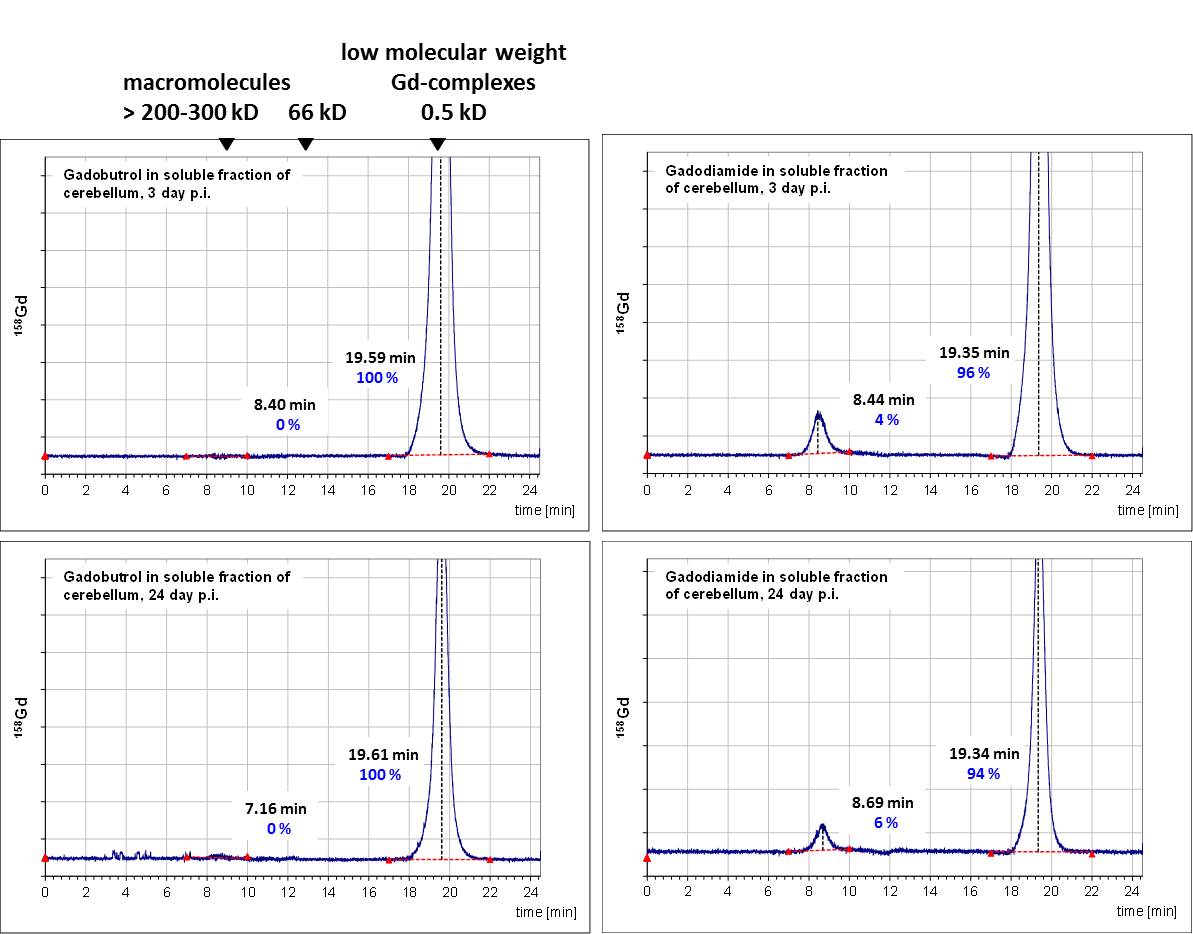
Figure 2: Representative Gd-specific gel permeation chromatograms (GPC) of the soluble fraction of the cerebellum 3 and 24 days after the last injection of gadobutrol (left) and gadodiamide (right).