5554
‘Pulse-acquire’ method for obtaining the guidewire coupling modes of a PTx transmit array1Imaging and Biomedical Engineering, King's College London, London, United Kingdom, 2Electrical Engineering, Stanford University, United States
Synopsis
A method for measuring relative coupling between elements of a parallel transmit (PTx) array and conductive structures such as guidewires or braided catheters. The method relies on strong local enhancement of B1 fields close to conductors due to induced currents. Data acquired from single pulse-acquire measurements using very low flip angles is hence dominated by these induced current contributions. Coupling matrices for N-channel arrays can therefore be estimated using only N pulses; it is demonstrated that these are similar to those obtained from dedicated current sensors.
Introduction
MRI guidance of interventional procedures using guidewires or catheters is limited by potential heating of tissue caused by radio frequency (RF) coupling with the MRI transmit coil1–3. In a PTx system decoupling modes (DM) exist that can reduce RF coupling risks and a procedure for finding them using current sensors on the wire has been demonstrated4. We propose a method to achieve the same without the need for extra sensors using a very short series of very low flip angle (vLFA) RF pulses that could be implemented as pre-calibration for imaging sequences.Theory
The presence of a conductor leads to local enhancement of the RF magnetic field (B1+) for any driven transmit element, $$$B_{1,coil}^+$$$, such that
$$B^+_1 = \frac{\alpha}{r} + B_{1,coil}^+$$
where r is radial distance from the conductor and the complex quantity α is proportional to the induced current, and has previously been measured using current sensors or full B1 mapping4. For a transmit array, each element produces a different a, which can be used to estimate DM.
LFA gradient echo scans have the property that the signal is linear in the applied flip angle, and hence B1+. Since the B1+ field drops off quickly with r, signals acquired at vLFA are dominated by contributions very close to the conductor. This is further reinforced by local receive sensitivity enhancement due to the reciprocal effect of the conductor on the receiving coil (whether the same as the transmitter or otherwise). Hence we hypothesize that a single non-spatially encoded measurement after a vLFA RF pulse will primarily relate to the RF coupling α. Hence, with an N channel array coil, the application of N such pulse/measure cycles (one per channel) can be used to measure the RF coupling of each element in turn.
Methods
All measurements were performed on a 3T Philips Achieva with an 8-channel TEM transmit-receive body coil5 using a phantom fabricated from a half pipe filled with poly acrylic acid gel6 with inserted nitinol guidewire (Terumo Corporation, Japan) instrumented by an optically coupled toroidal current sensor7 placed over its proximal end outside the scanner bore that was connected to the scanner’s spectrometer (Phillips) for digitization. The proposed coupling measurement method was implemented using a normal 3D spoiled gradient echo sequence. We tested 16 nominal flip angles (FA) ranging from 1/20° to 20°(TR=10ms, TE=1.25ms) both reconstructing images and simply using the central k-space data point for the non-spatially encoded measures. In each acquisition a single coil element was used to transmit with all coils used to receive.
Coupling/decoupled modes were computed on coupling measurement data (i) from the current sensor and (ii) the proposed method using SVD as in reference 4; B1 field maps using volumetric Actual Flip angle Imaging (AFI)8 were acquired using each of the identified modes in turn in order to assess the resulting field patterns (FOV=400x160x80mm, Voxel=5x5x5mm, FA=80°,TR=25/125ms,TE=1.82ms). Temperature at the end of the wire was monitored using a fibre-optic temperature probe (LumaSense Technologies, Inc. USA).
Results
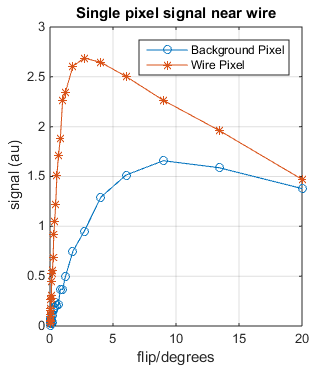
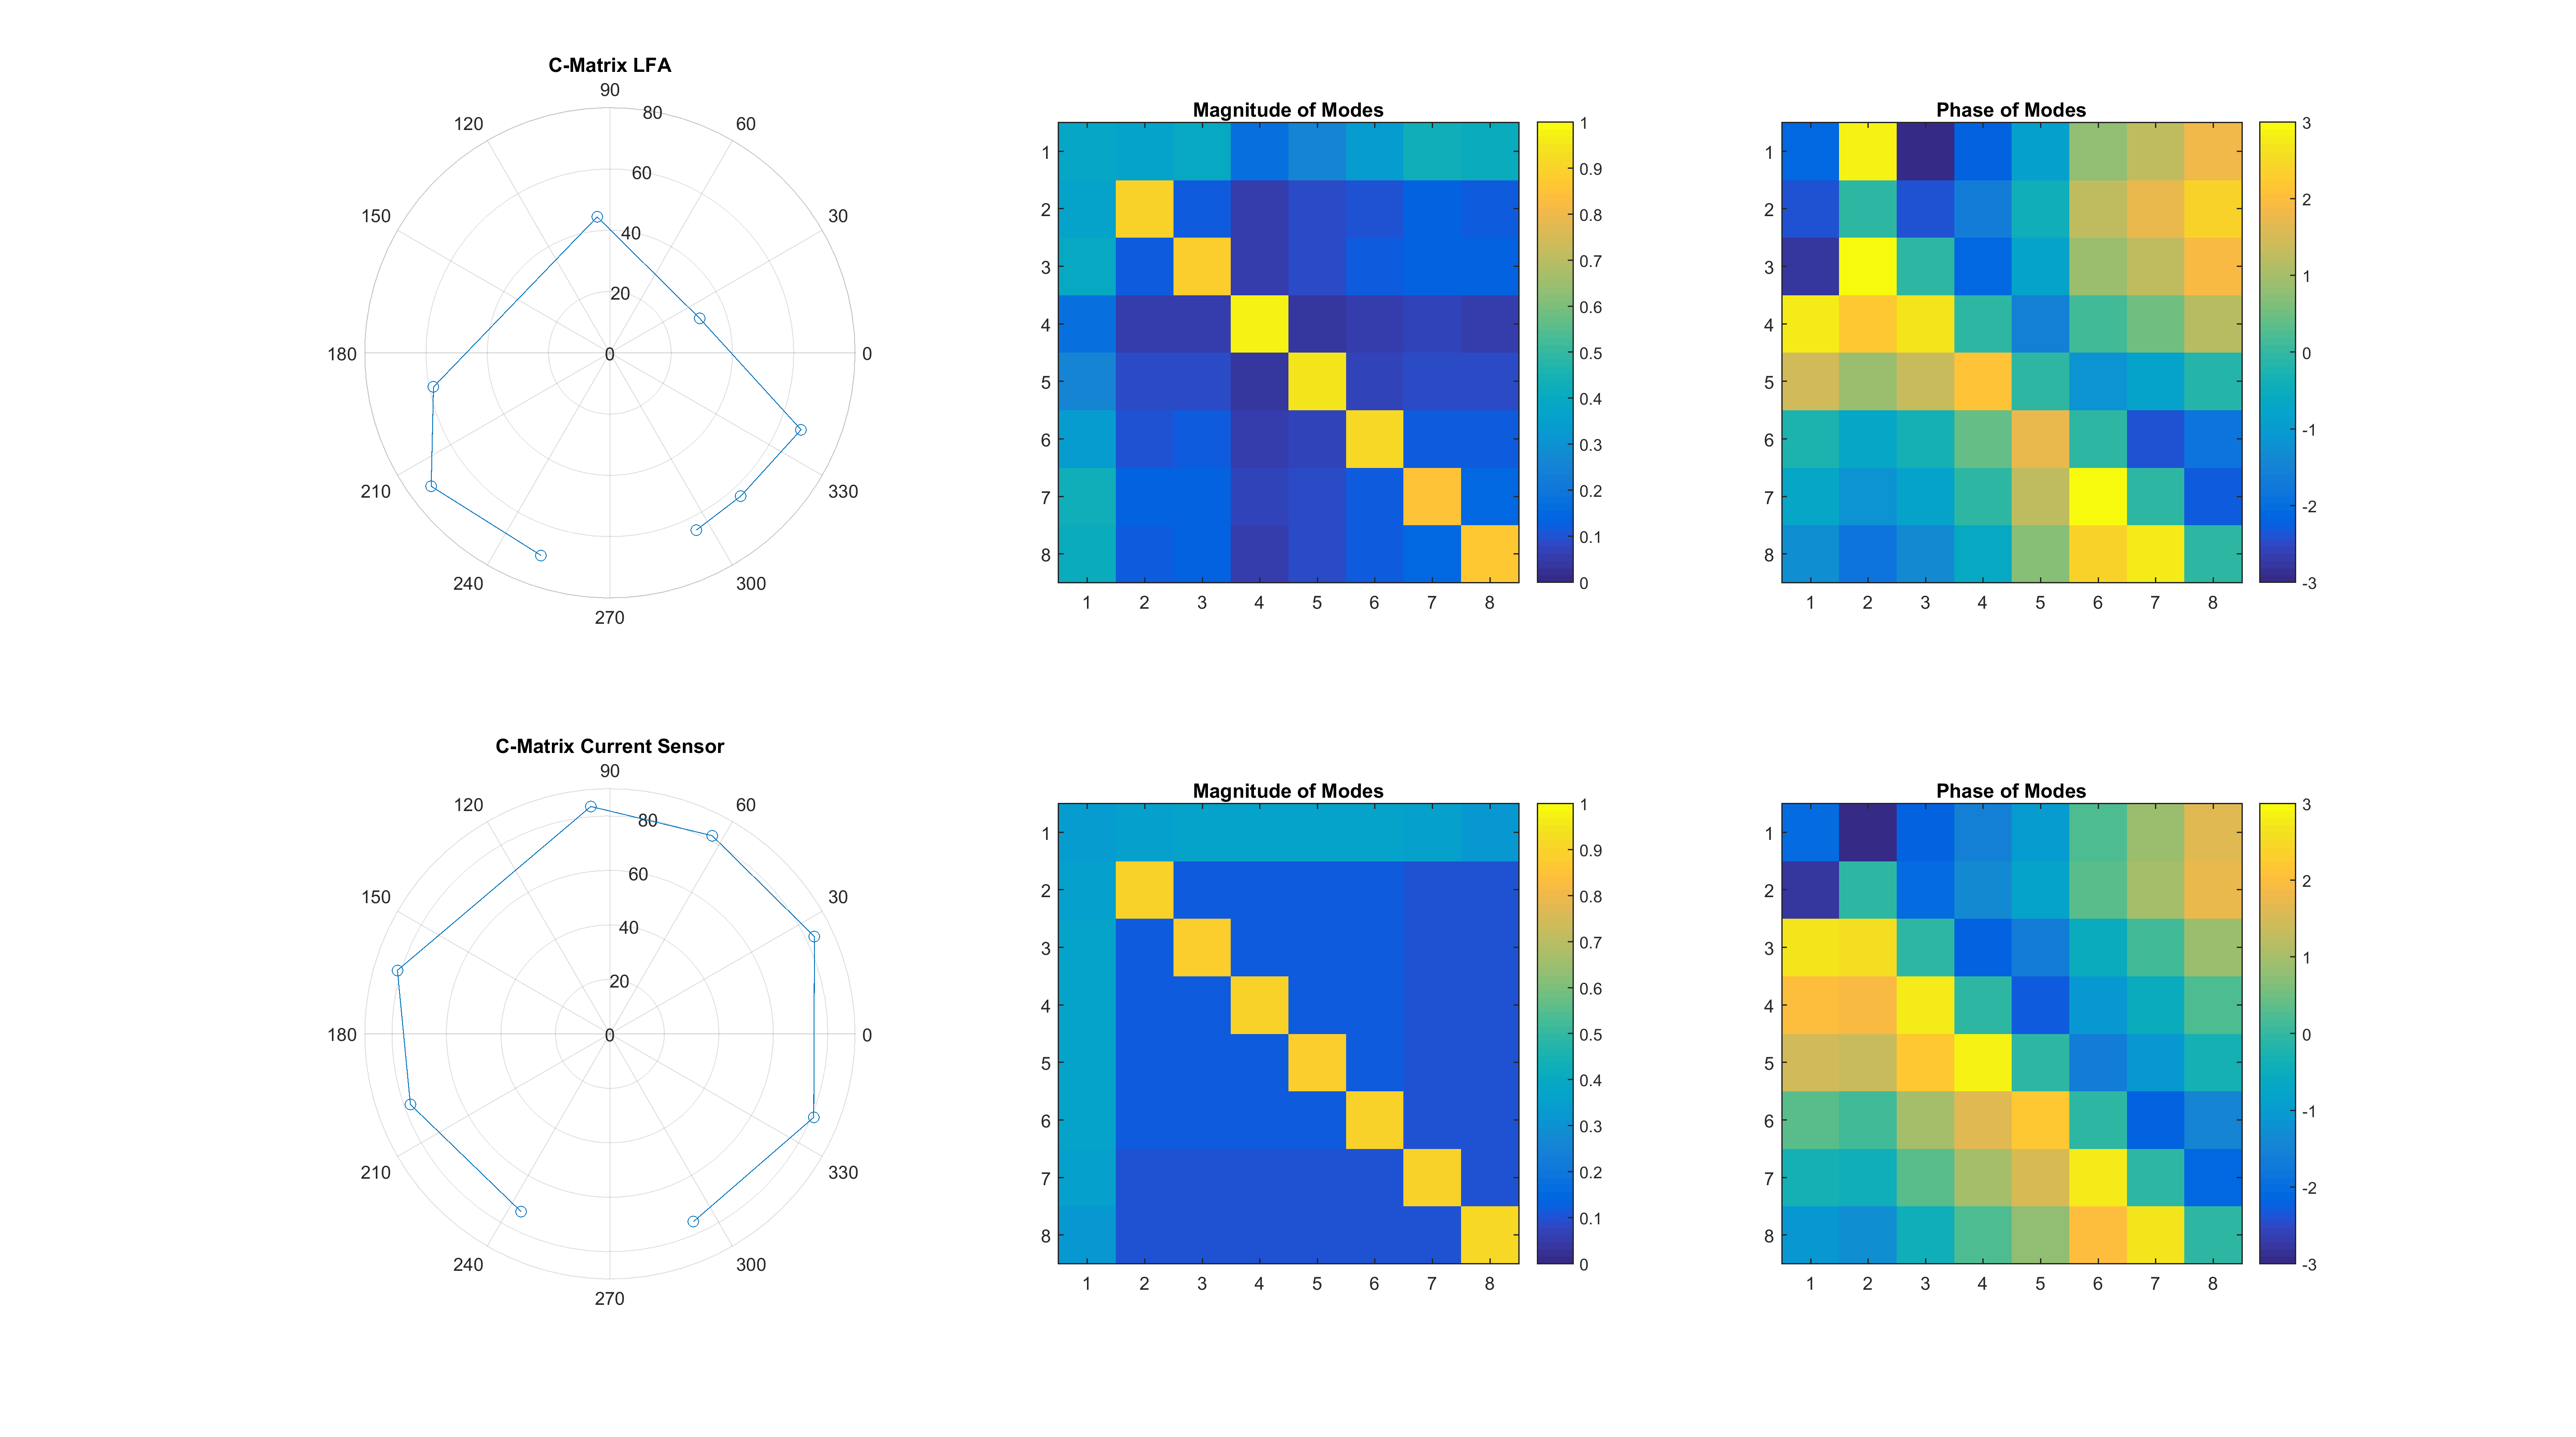
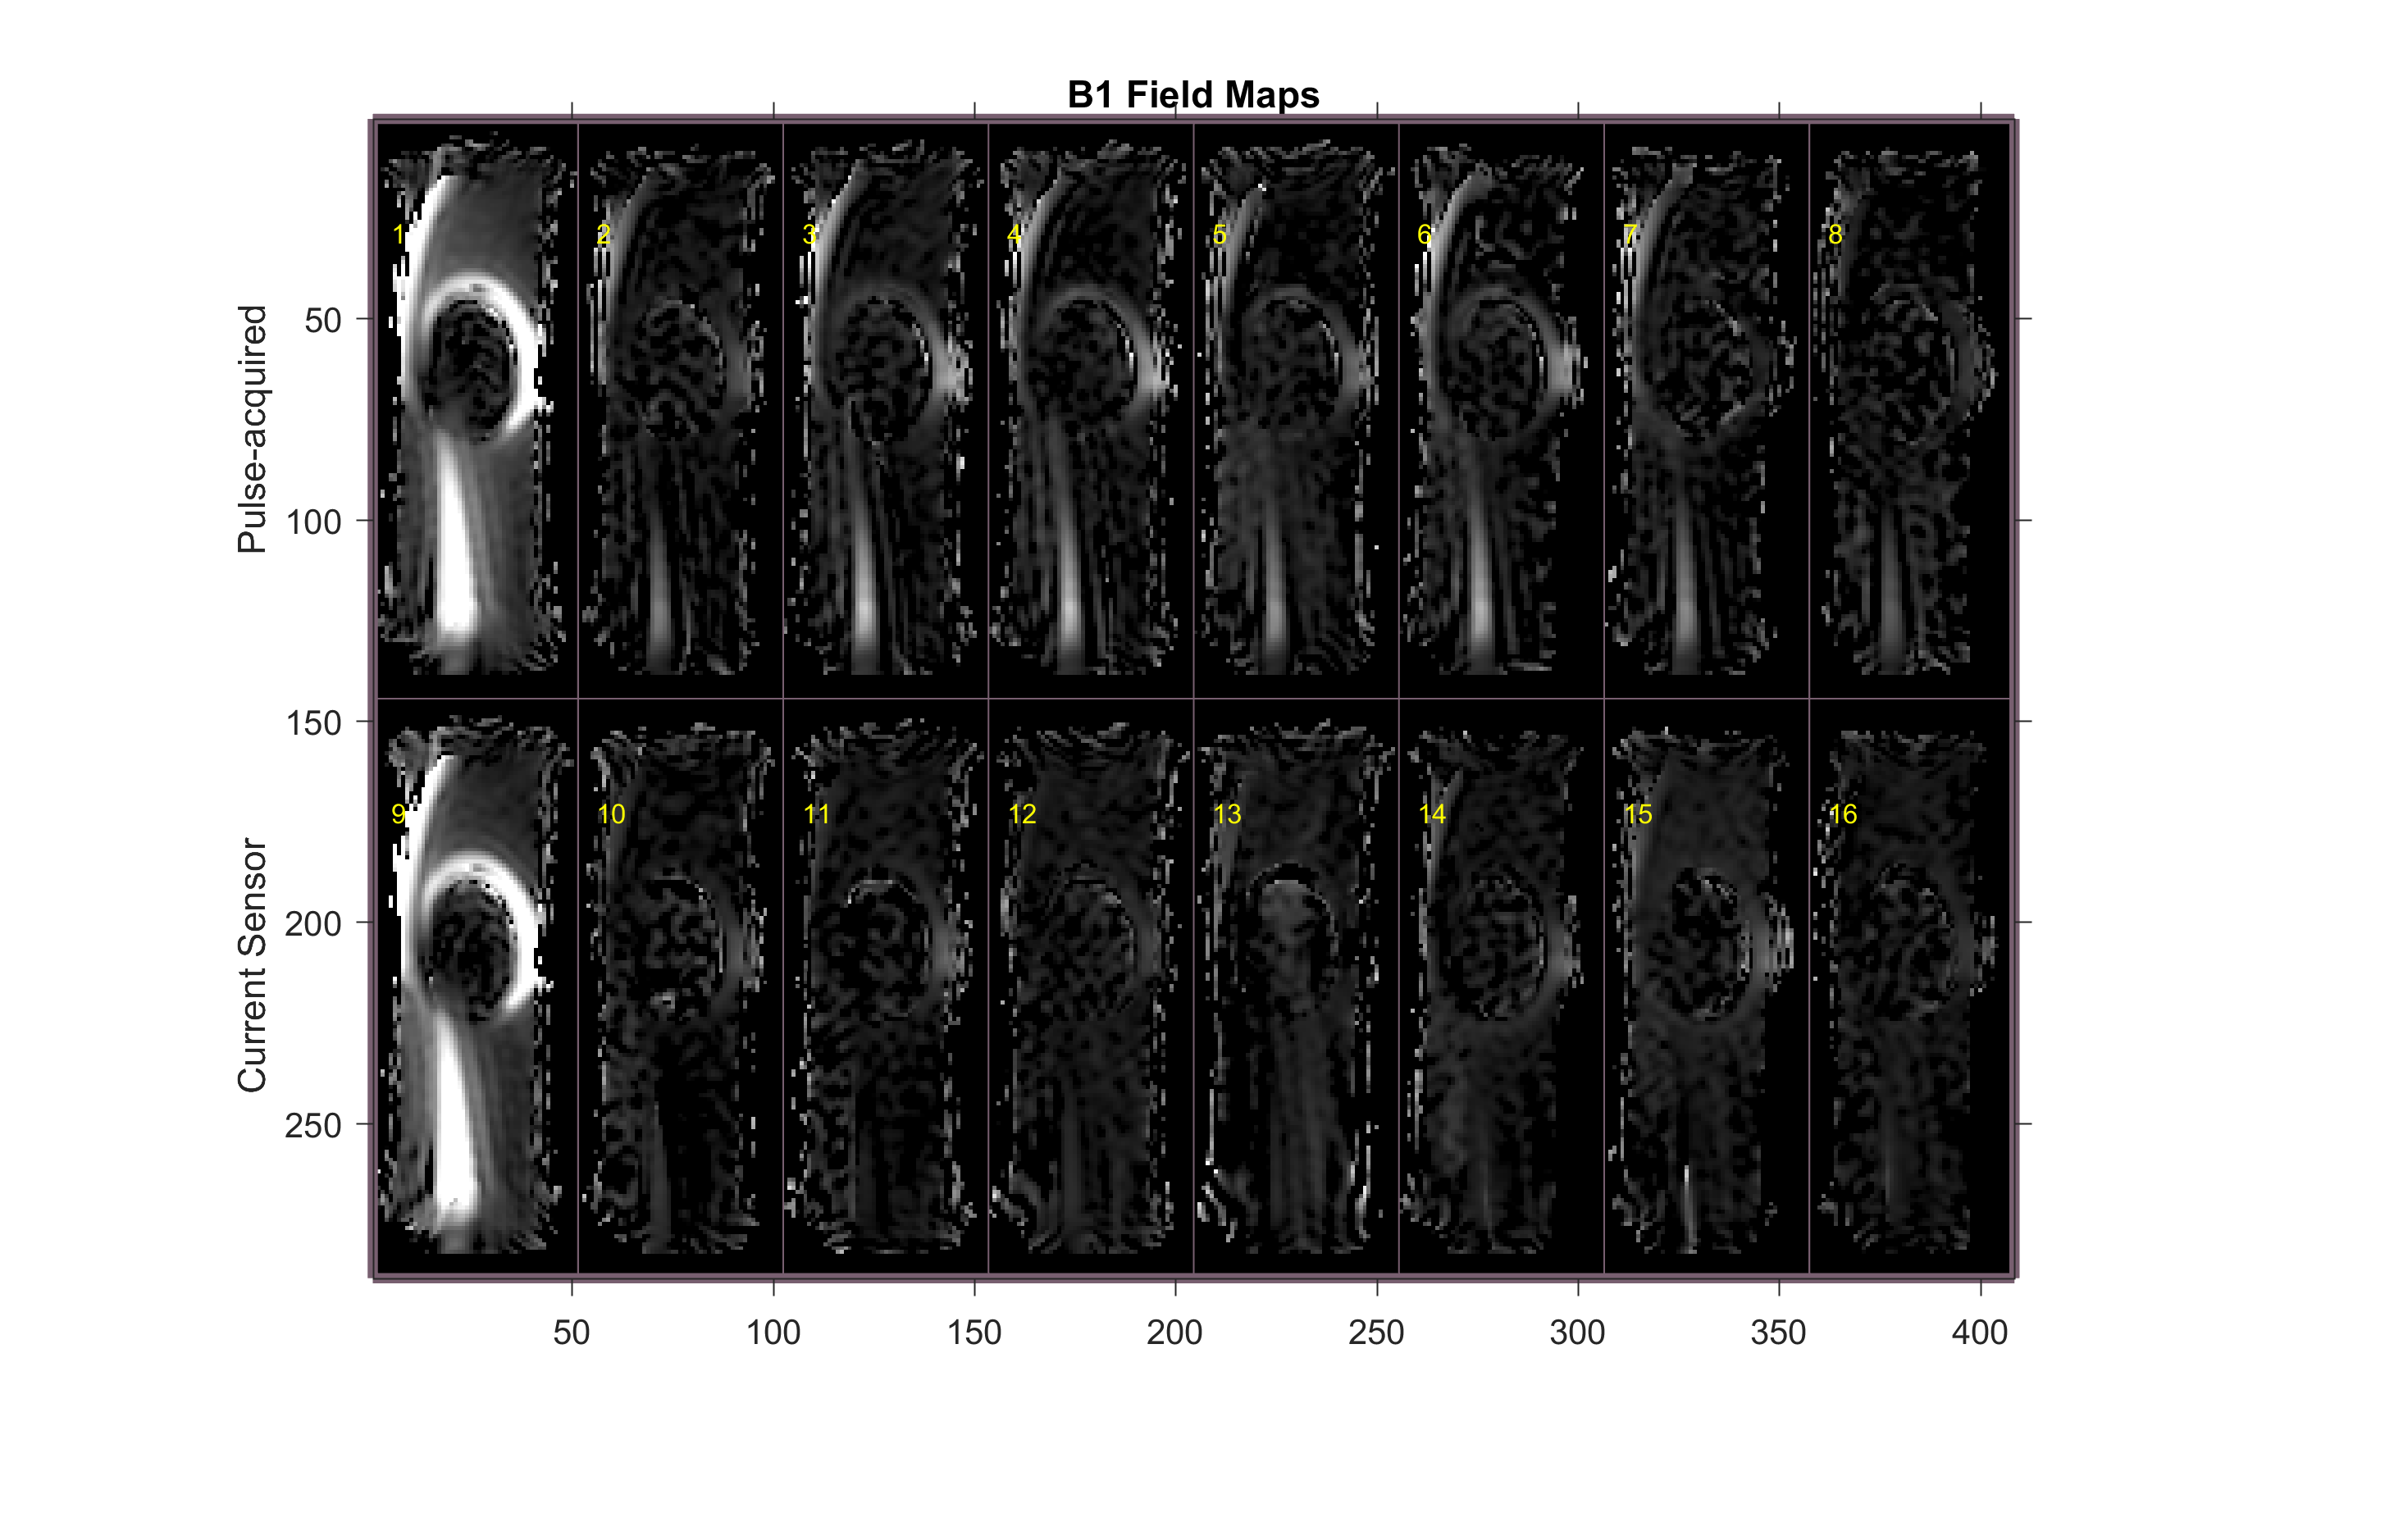
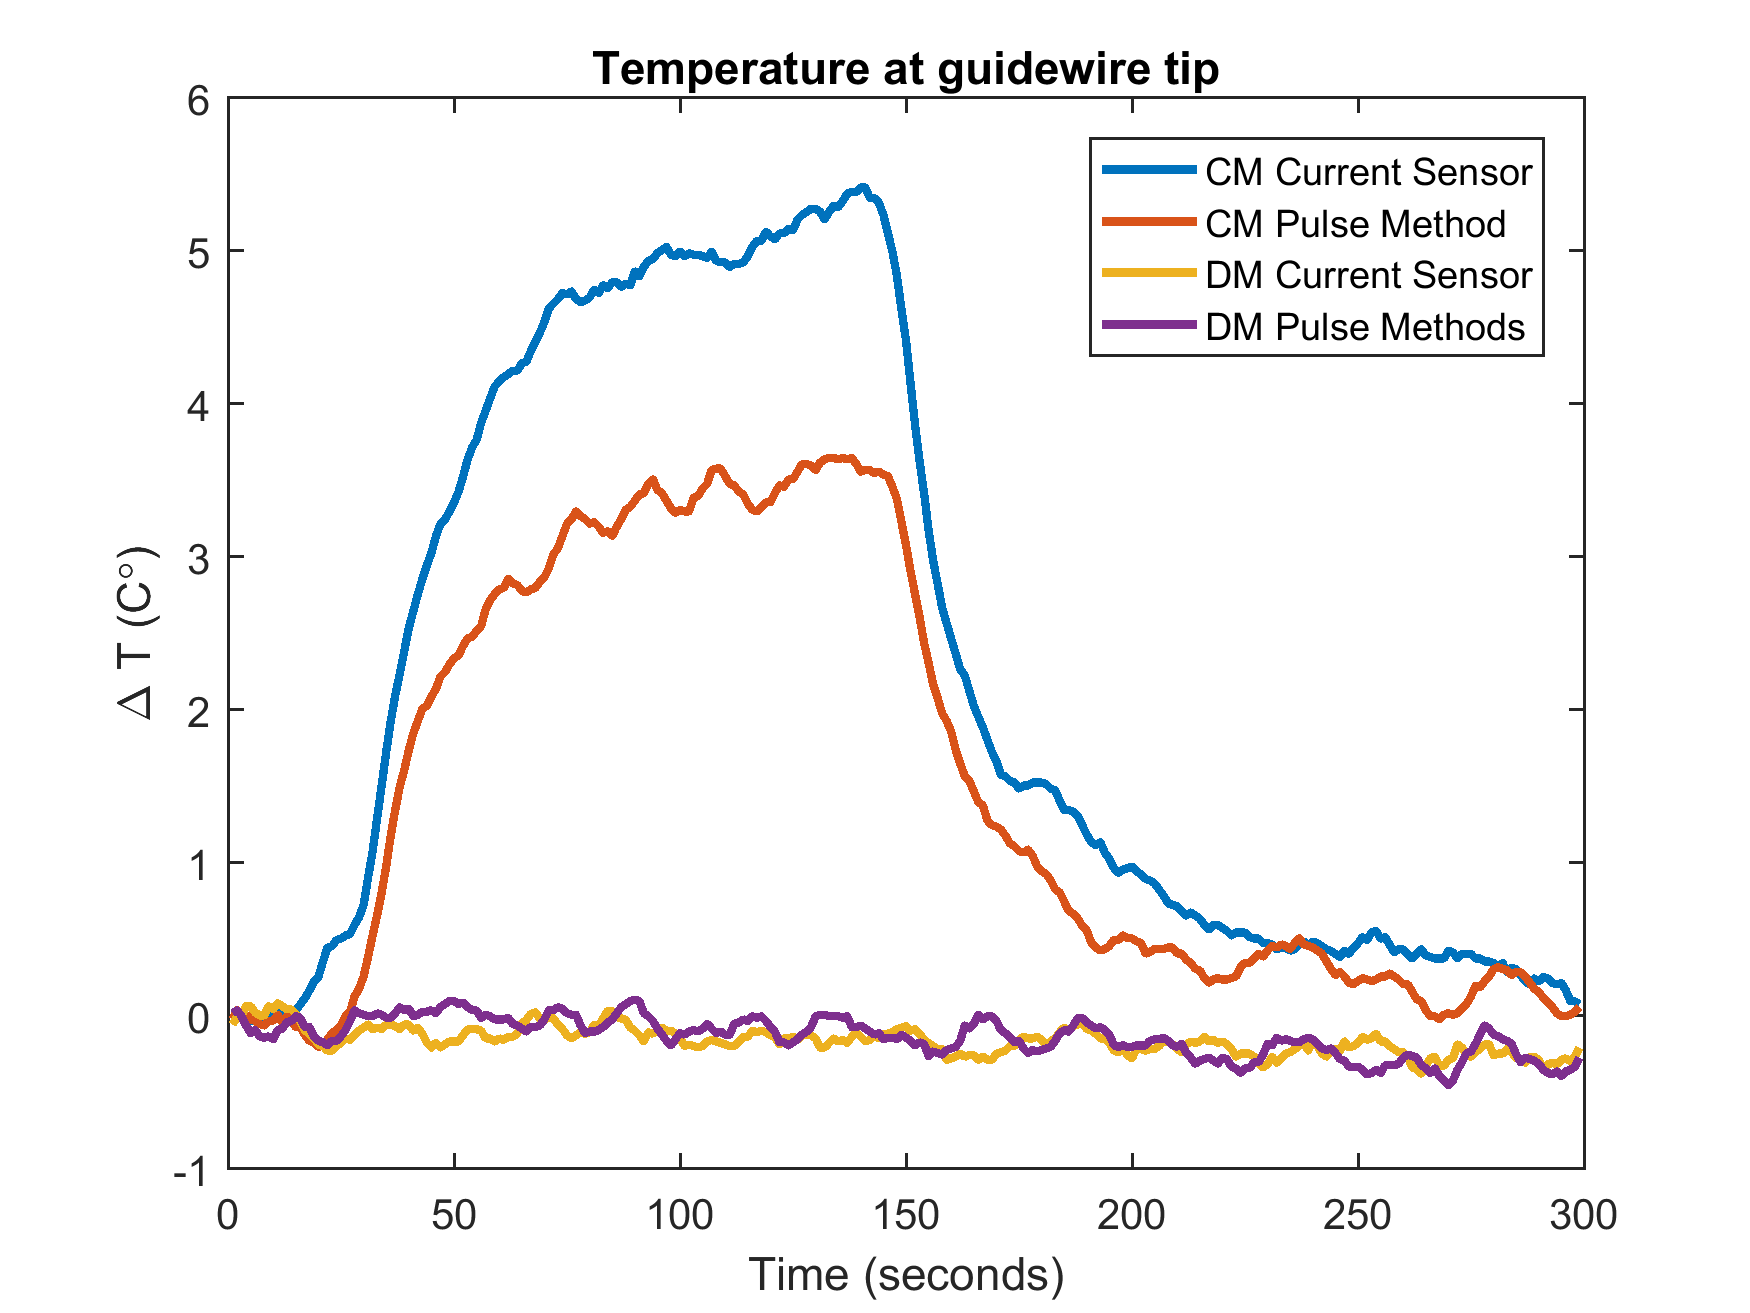
Figure 1 shows signal from pixels close to and far from the wire, determined by full imaging. Based on this, data for flip=0.1° was used to derive coupling measurements, as this was judged to be within the linear regime. For both current sensor and proposed method a single coupled mode and seven decoupled modes were identified (see Figure 2). Single slice B1 field maps corresponding to each of the modes in both cases are shown in Figure 3, Figure 4 shows temperature measurements obtained during imaging.Discussion
The proposed LFA method identifies coupling modes that are similar but not exactly the same (Figure 2) to those from a current sensor. This can be seen in B1 maps (Figure 3) where the proposed method leads to some residual B1 field from the wire when using ‘decoupled’ modes, and in the temperature measurements where the coupled mode results in a lesser degree of heating. A key difference is that the proposed method is based on an average through the sample rather than single point measurements made by a sensor. This could potentially be changed by use of slice selective RF pulses. Since the method uses single pulse measurements it can potentially be made very fast; which may allow pseudo-real time measurement. We hypothesise that a coupling strong enough to pose a risk of heating is where the wire mediated signal is in the linear regime and the ratio of wire signal to background is large enough to neglect the latter.Acknowledgements
Funding for this project is provided by the Medical Research Council (MRC) developmental pathway funding (MR/N027949).References
1. Nitz WR, Oppelt A, Renz W, Manke C, Lenhart M, Link J. On the heating of linear conductive structures as guide wires and catheters in interventional MRI. J Magn Reson Imaging. 2001;13(1):105-114. doi:10.1002/1522-2586(200101)13:1<105::AID-JMRI1016>3.0.CO;2-0.
2. Park SM, Kamondetdacha R, Nyenhuis JA. Calculation of MRI-induced heating of an implanted medical lead wire with an electric field transfer function. J Magn Reson Imaging. 2007;26(5):1278-1285. doi:10.1002/jmri.21159.
3. Griffin GH, Anderson KJT, Celik H, Wright GA. Safely assessing radiofrequency heating potential of conductive devices using image-based current measurements. Magn Reson Med. 2015;73(1):427-441. doi:10.1002/mrm.25103.
4. Etezadi-Amoli M, Stang P, Kerr A, Pauly J, Scott G. Controlling radiofrequency-induced currents in guidewires using parallel transmit. Magn Reson Med. 2015;74(6):1790-1802. doi:10.1002/mrm.25543.
5. Vernickel P, Röschmann P, Findeklee C, et al. Eight-channel transmit/receive body MRI coil at 3T. Magn Reson Med. 2007;58(2):381-389. doi:10.1002/mrm.21294.
6. ASTM standard F 2182-2002a. Standard test method for measurement of radio frequency induced heating near passive implants during magnetic resonance imaging. ASTM Int. 2002;(December):1-14. doi:10.1520/F2182-11A.1.7.
7. Etezadi-Amoli M, Stang P, Kerr A, Pauly J, Scott G. Interventional device visualization with toroidal transceiver and optically coupled current sensor for radiofrequency safety monitoring. Magn Reson Med. 2015;73(3):1315-1327. doi:10.1002/mrm.25187.
8. Nehrke K. On the steady-state properties of actual flip angle imaging (AFI). Magn Reson Med. 2009;61(1):84-92. doi:10.1002/mrm.21592.
Figures