5552
MRI-compatible Voltage Device Tracking (VDT) navigation: Simultaneous Tracking and imaging with high-gradient-duty-cycle sequences via complete removal of Gradient Induced Voltages. Initial results.1Mirtech, Inc, Brockton, MA, United States, 2Radiology, Brigham and Women's Hospital, Boston, MA, United States, 3Cardiology, Brigham and Women's Hospital, Boston, MA, United States, 4St. Jude Medical, Minnetonka, MI, United States
Synopsis
Voltage Device Tracking (VDT), a method for catheter navigation, during MRI is explored. VDT utilizes multiple catheter electrodes that measure both the spatial location of the electrode and the ECG on the vessel wall (EGM) at that location. Electrode spatial-localization is performed by driving intermittent sinusoidal signals at kHz frequencies between surface electrodes, and measuring the signals received by the catheter. Large (>1V) signals (GIV), generated within the body by the MR gradients during a scan interfere with the much smaller (~10mV) tracking signals. We applied two approaches to remove GIVs, which allowed VDT visualization with <5% GIV contamination.
Purpose
Voltage Device Tracking (VDT) is a method used by electro-physiological (EP) catheter vendors to efficiently navigate catheters within the cardio-vascular system without image-guidance. VDT utilizes multiple electrodes on each catheter, each of which measures both the spatial location of the electrode and the ECG on the vessel wall (EGM) at that location. Electrode spatial-localization is performed by driving 10mV signals at kHz frequencies between surface electrodes, and receiving signals with the catheter, making it sensitive to strong (>1V) electrical fields induced by the MRI gradient coils into the body (Gradient Induced Voltages). We previously demonstrated1 that VDT can uniquely be used to navigate both inside and outside the MRI scanner, making it ideal for multimodality-guided (MRI with X-ray and/or Ultrasound) EP interventions. For navigation performed simultaneously with MR imaging, we previously overcame GIV interference for sequences with lower (<30%) gradient duty cycle (GDC)1, by disconnecting the VDT receivers during periods of strong GIVs, leading to reliable, lower frame-rate, VDT tracking. For 12-lead ECG monitoring in MRI2, we showed that GIVs could be characterized by a 19-parameter equation involving gradient fields and their temporal derivatives. We hypothesized that GIV removal from corrupted VDT (VDTCorrupt = VDTReal+GIV), resolving the actual VDTs (VDTReal), and obtaining the true catheter locations, might be possible for high GDC sequences, using similar approaches. To develop this, we constructed a non-commercial VDT transmission and reception system, as well as a phantom that emulated the human-torso’s MRI and electric properties, through which we navigated MRI-compatible EP catheters (St. Jude Medical, Minnetonka, MN) with MR-tracking coils and VDT electrodes, with MR-tracked locations3 serving as the “ground truth” for the computed VDTReal.Methods
The experimental phantom and VDT acquisition system. Figure 1A shows the phantom, which was filled with saline solution, and doped with Nickel-Chloride matching the T1 of blood at 3T. The phantom was equipped with 3-pairs of VDT surface electrodes, for transmission of VDT signals in the three spatial directions. The phantom was equipped with multiple entry ports, allowing navigation of EP catheters within. Figure 1B1-2 shows the MR-compatible catheter used for navigation, which had 5 VDT electrodes interspersed by 4 MR-tracking coils. Figure 2 shows the VDT electronics system. It used three National Instruments (NI) 18-bit analog outputs to drive 4-cycle 8 kHz bursts (50 mV peak-to-peak) into the three surface electrode pairs. The VDT signals acquired on the catheter electrodes were transmitted to individual Alligator Technology (AT) amplifiers with software-selectable gains and band-pass frequencies. Simultaneously, the three (x, y ,z) MRI gradient waveforms were acquired, and passed through AT amplifiers with the same settings. All signals, along with the transmitter signals, were then acquired using a NI PXIe-1073 24-bit analog-to-digital card. All data was acquired with the AT amplifiers set at gain 1 and (9-pole Bessel filter) with low-pass frequency of 66 kHz. All data was digitized at 200 kHz.
The VDT navigation experiments. The EP catheter was navigated in the Superior-Inferior (SI) direction through the phantom within a 3T Siemens Skyra MRI. At each location, the following data were collected: MR-tracking data providing catheter electrodes’ location; VDT received signals from the electrodes with the VDT system transmitting, both without and with MR pulsing, the latter containing GIV contribution to the signal. The same protocol was followed during GRE, SSFP and FSE pulse sequences.
Procedure for cleaning the corrupted VDT signals. Figure 3 is a flow-chart of the cleaning procedure, performed in Matlab. The contaminated signal was first filtered by applying a 4-sampling-time-point sliding window median filter to smooth out small high-frequency fluctuations. Another median filter was applied with a 41-sampling-time-point window, chosen such that the filter's output closely follow the features of the GIVs, while ignoring the sinusoidal bursts. Thus, subtracting the filtered signal from the corrupted signal preserves the desired sin-bursts themselves, while eliminating most of the contamination. The residual spikes (Figure 3) are then suppressed using thresholding and filtering with a high-Q band pass filter ([3,4,...12] kHz).
Results
Figure 5 shows cleaned VDTs obtained during an axial FSE scan. The procedure was repeated while running GRE and SSFP sequences with consistent results. The peak-to-peak voltages of the recovered bursts correlated well with the displacement of the catheter. As expected, the largest changes in VDT corresponded to the signal transmission from the surface electrodes aligned with the direction of the catheter's motion.Discussion
We developed a procedure for cleaning the corrupted VDTs, allowing localization of the catheter while simultaneously performing MR scans. This approach can be enhanced by combining the technique with GIV-modeling1 using the 19-parameter equation.Acknowledgements
NIH P41EB015898, NIH U54HL119145, E-TROLZReferences
1. Schmidt EJ, Tse ZTH, Reichlin TR, Michaud GF, Watkins RD, Butts-Pauly K, Kwong RY, Stevenson WG, Schweitzer J, Byrd I, Dumoulin CL. Voltage-based device tracking in a 1.5 Tesla MRI during imaging: initial validation in swine models. Mag. Reson. Med 2014;71: 1197–1209 2. Zhang SHL, Tse ZTH, Dumoulin CL, Kwong RY, Stevenson WG, Watkins R, Ward J, Wang W, Schmidt EJ. Gradient-Induced Voltages on 12-Lead ECGs During High Duty-Cycle MRI Sequences and a Method for Their Removal Considering Linear and Concomitant Gradient Terms, Mag. Reson. Med 2016;75(5):2204-16. 3. Dumoulin CL, Mallozzi RP, Darrow RD, Schmidt EJ. Phase-Field Dithering for Active Catheter Tracking. Magn Reson Med. 2010 ;63(5):1398-403Figures
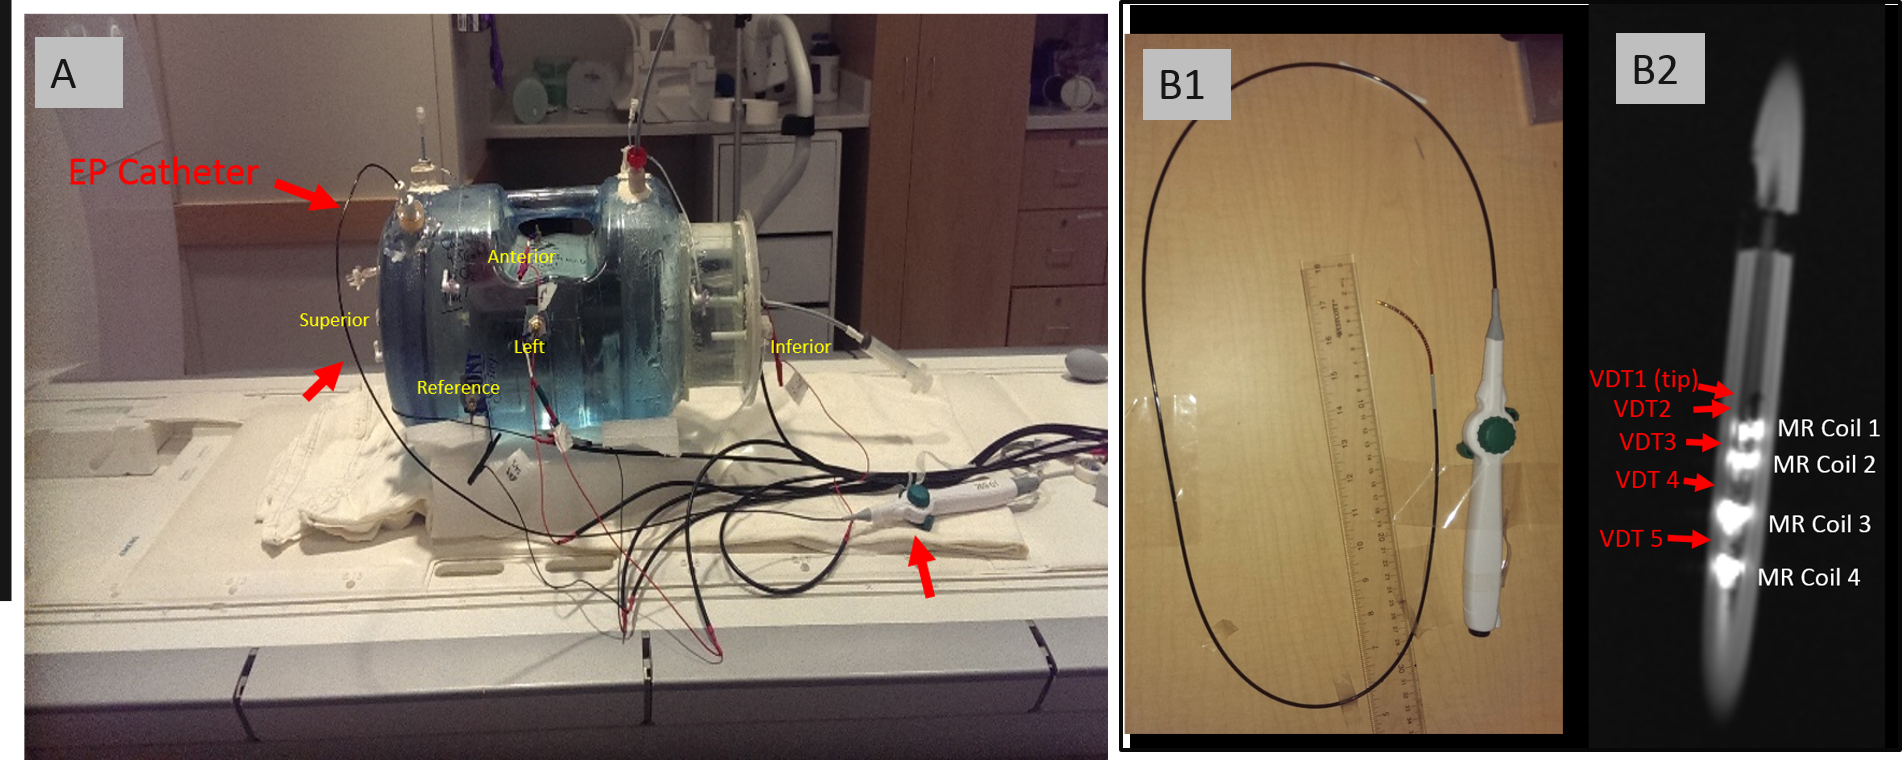
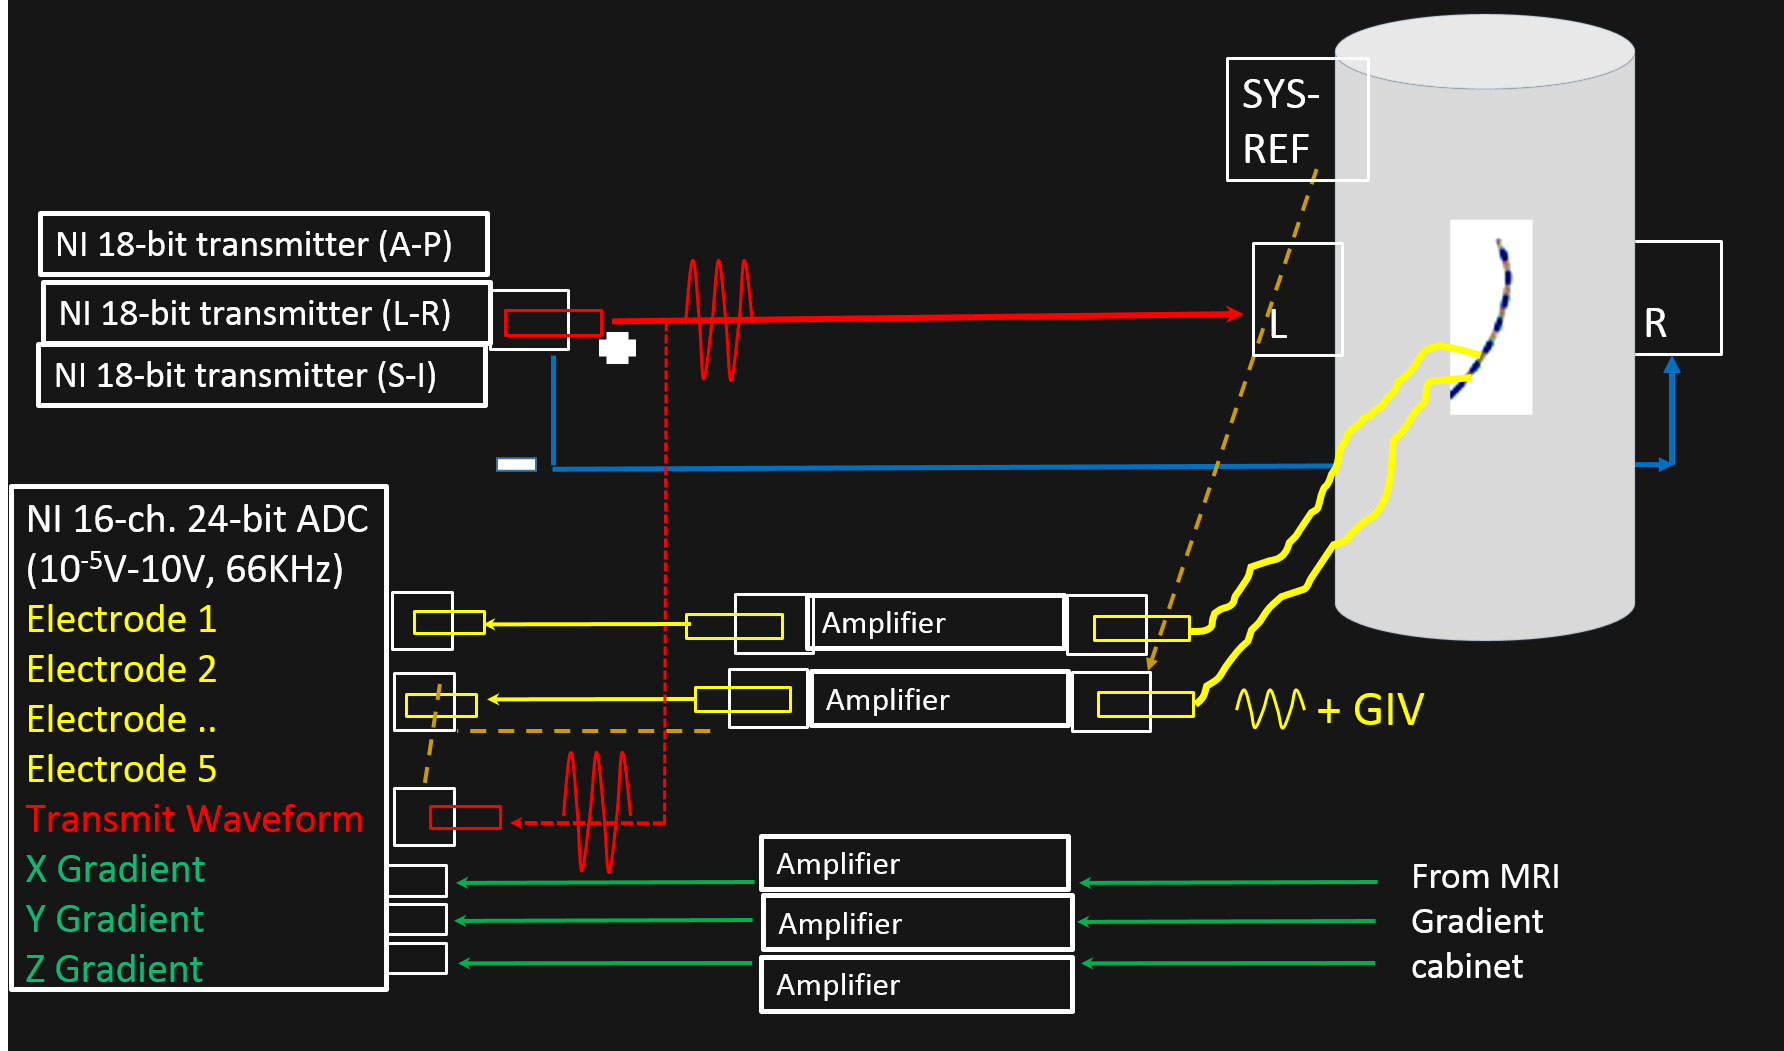
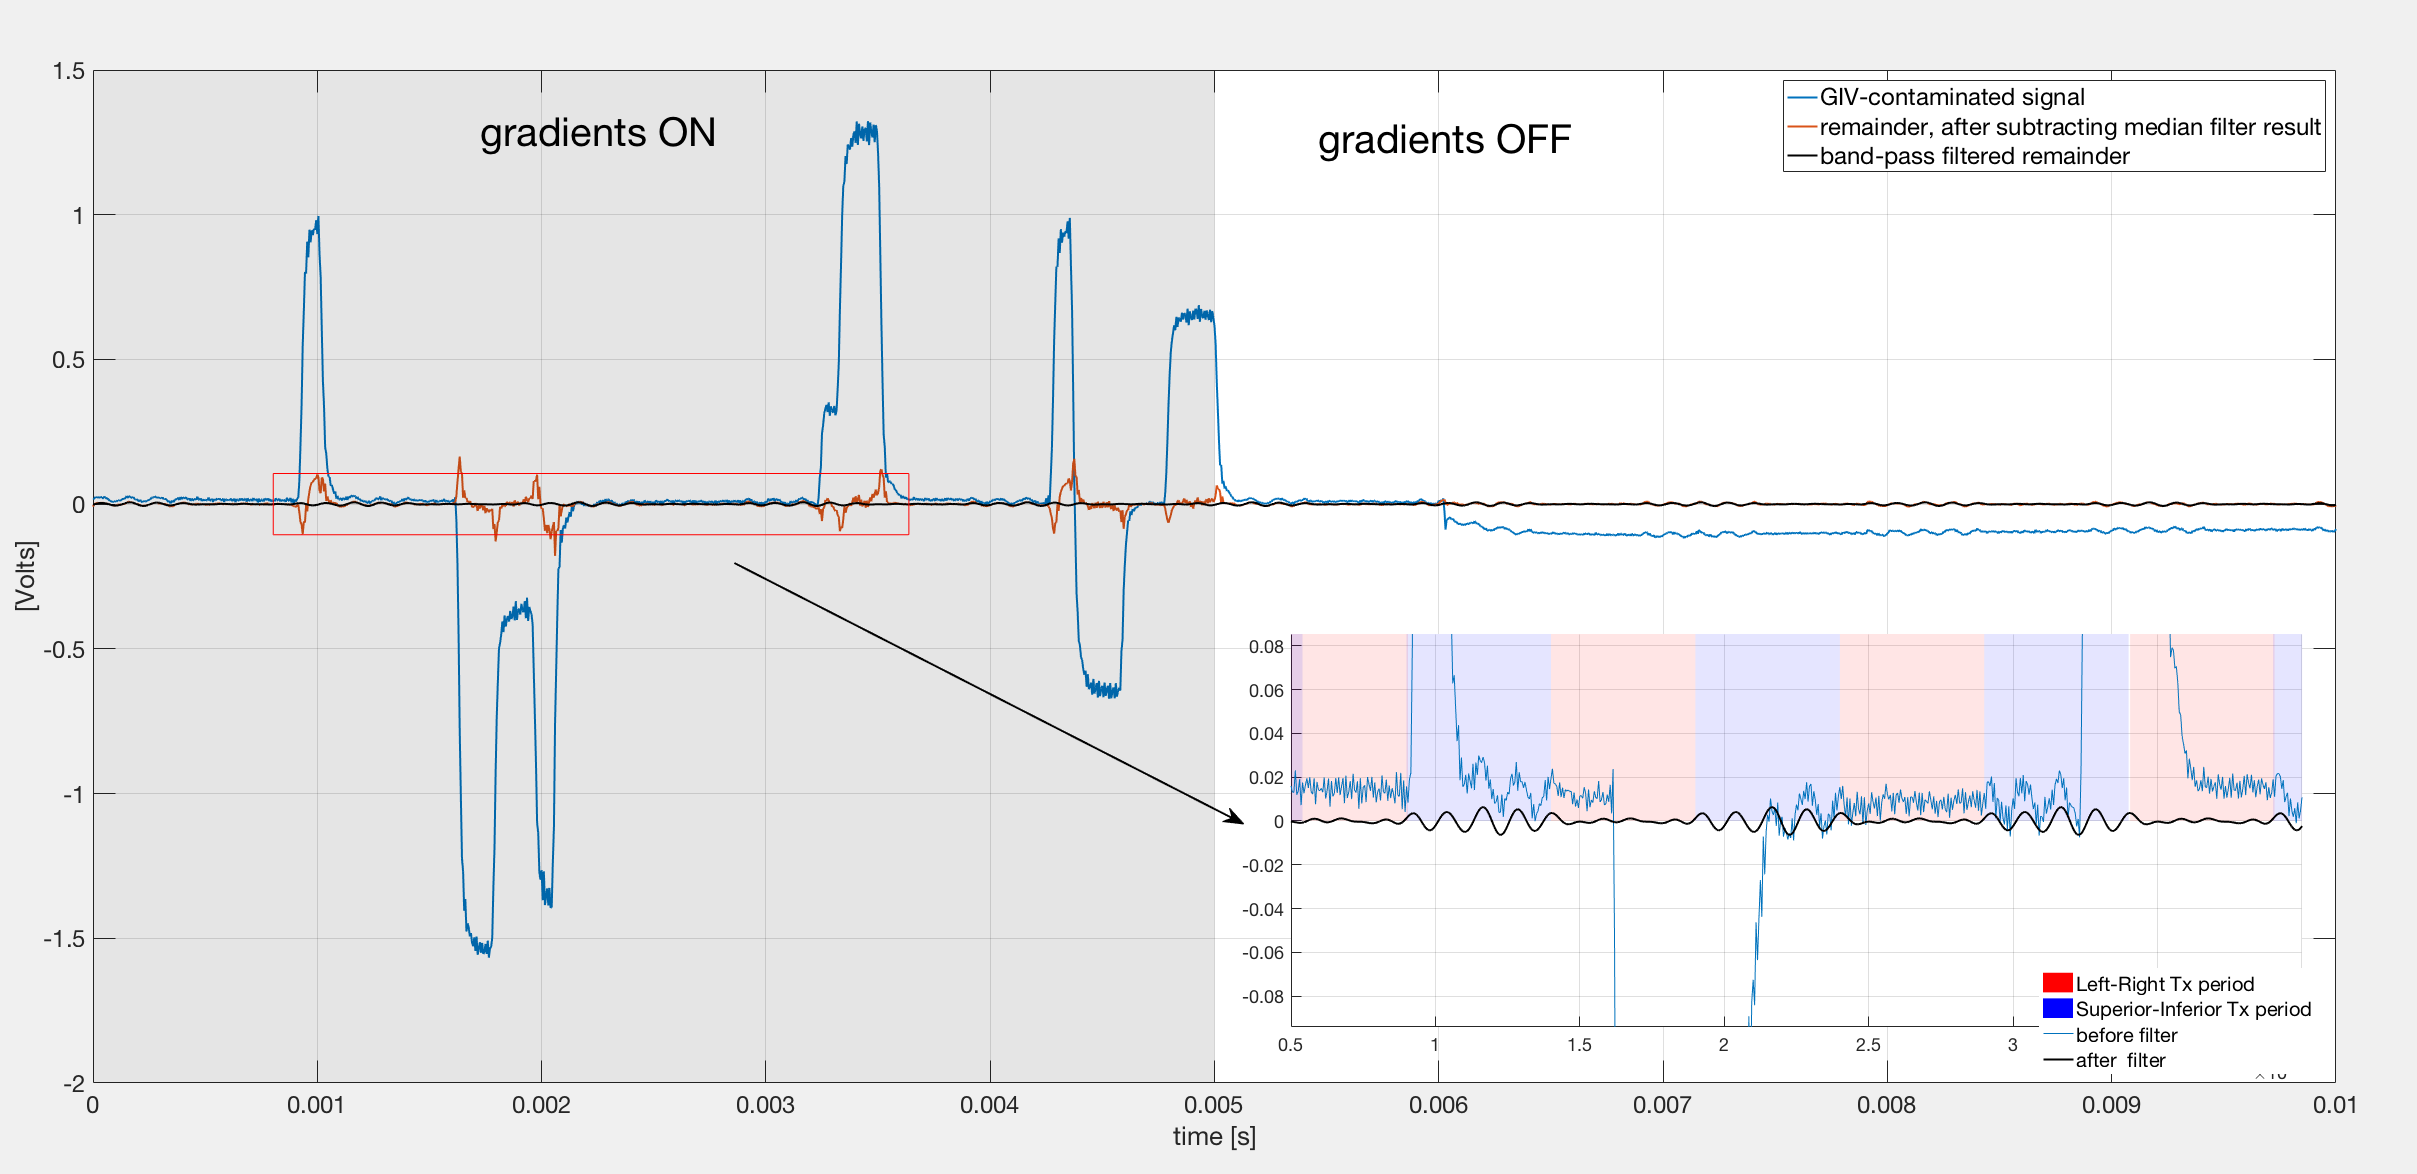
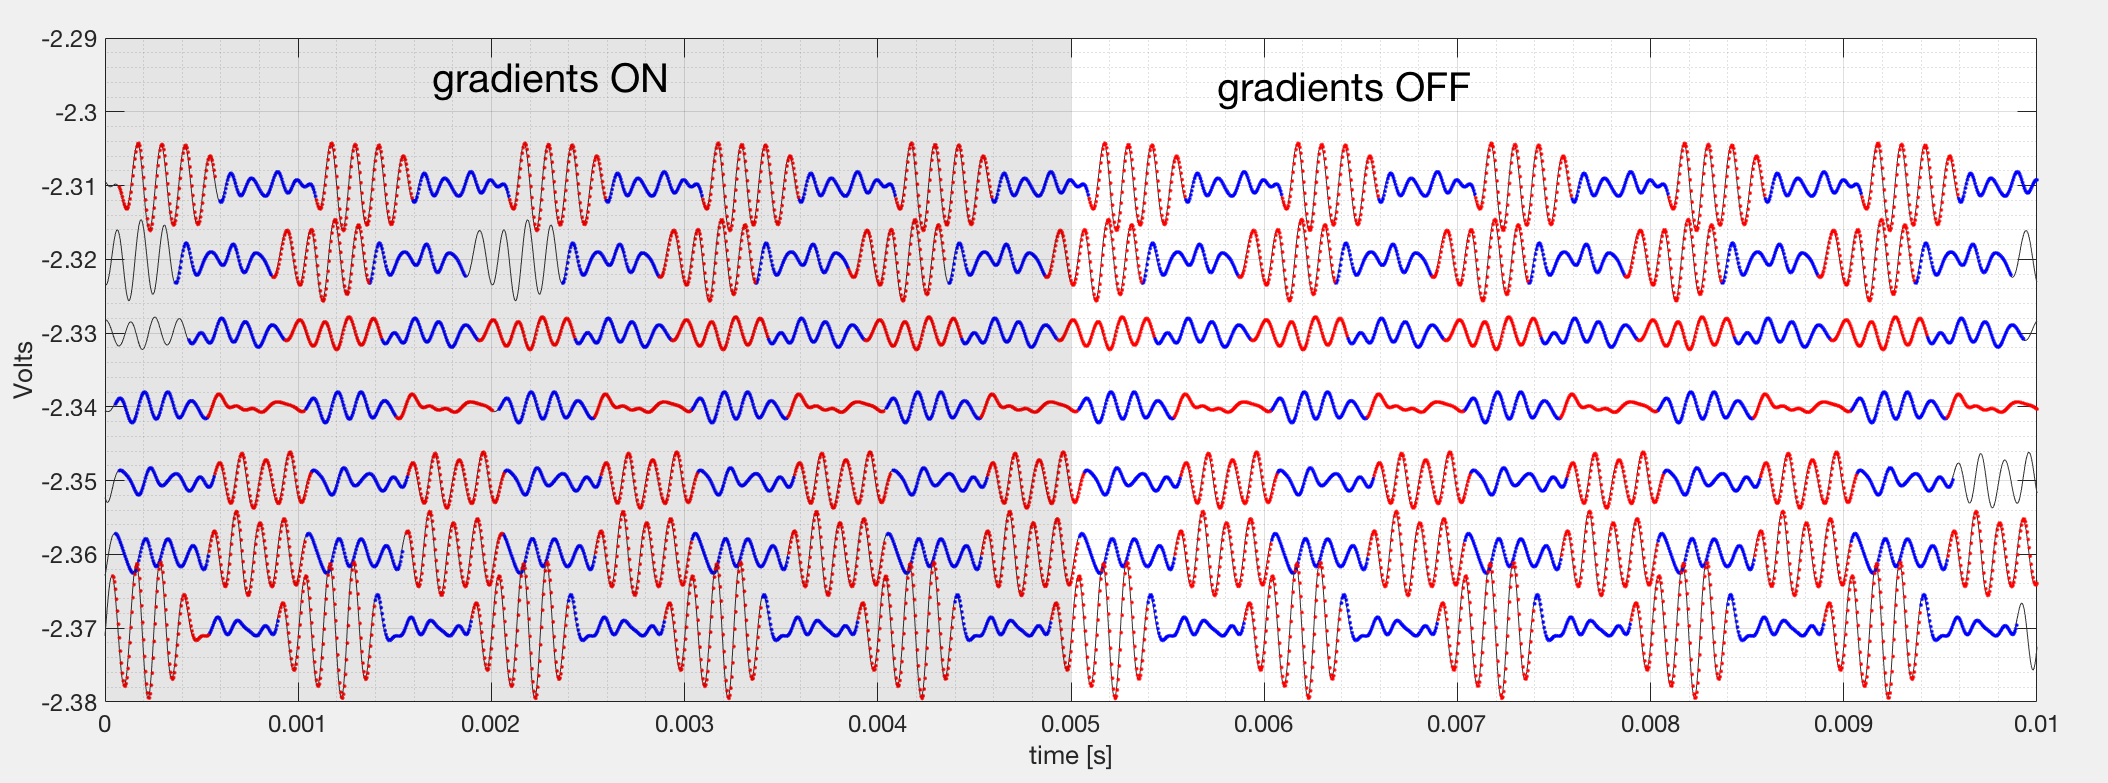

Figure 5. The left hand side demonstrates the position of the catheter's tip throughout its trajectory within the phantom. The coordinate system is referenced to the scanner's iso-center and the coordinates are obtained through the use of MR-tracking coils.
The right hand image shows, the recovered Left-right and Superior-Inferior VDT locations, after removal of the GIV noise, versus the MR-tracking SI location. Note the strong variation in the SI VDT location, indicating the ability of VDT to track catheter location. There is little change in the RL VDT location, since we primarily moved the catheter in the SI direction.