5539
Controlling Brain Infusion Distributions: Moving from Surgical Planning to Real-Time MR Guidance1Therataxis, Baltimore, MD, United States, 2TherVoyant, Madison, WI, United States, 3Medical Physics, University of Wisconsin- Madison, Madison, WI, United States, 4Biomedical Engineering, University of Wisconsin- Madison, Madison, WI, United States
Synopsis
The hetergeneity of the brain makes designing a desired end drug distribution through pressurized catheters difficult. We present a method to utilize real-time MR monitoring of a co-infused Gd tracer during initial stages of the infusion to derive a real-time 3D estimate of the velocity front. We also describe a new algorithm that uses the velocity front to provide surgical feedback on the likely final infusion distribution.
Introduction
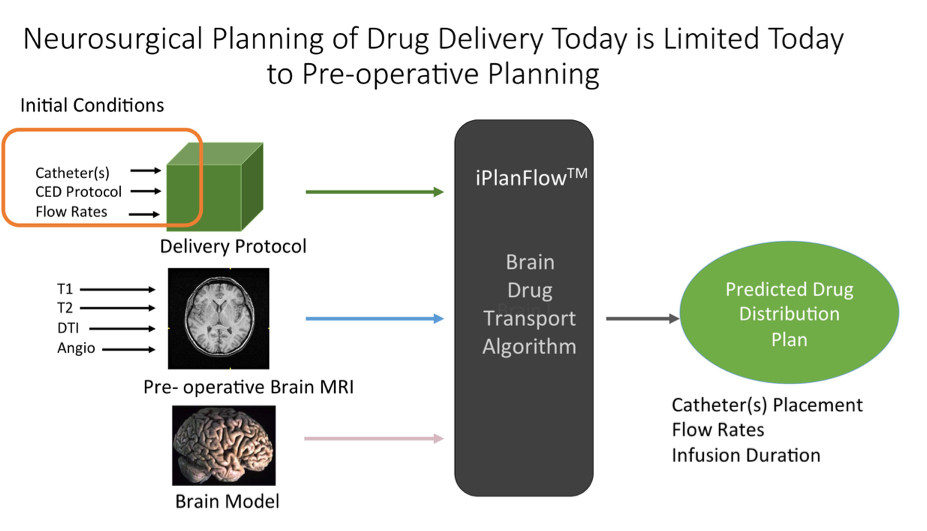
Pre-operative MRI is often used for pre-surgical planning of brain infusions, as depicted in Fig. 1, to determine the catheter placement and flow rates needed to create the desired infusion distribution using convection-enhanced delivery (CED). As advection rates of infusions differ by as much as a factor of ten between gray and white matter, MRI-derived segmentation of brain volumes are crucial to design the catheter(s) placement and flow rates to create the desired end distribution. However, the accuracy of the volumetric infusion distribution estimation is ultimately hindered by limits in characterizing tissue, especially in complex regions of brain resection or when the brain shifts during surgery. Therefore, we present a means to use real-time MR monitoring of the ongoing, 3D infusion front velocity during surgery as a periodic input to an infusion prediction algorithm. We demonstrate how the real-time data can lead to a better prediction of the final infusion distribution.Methods
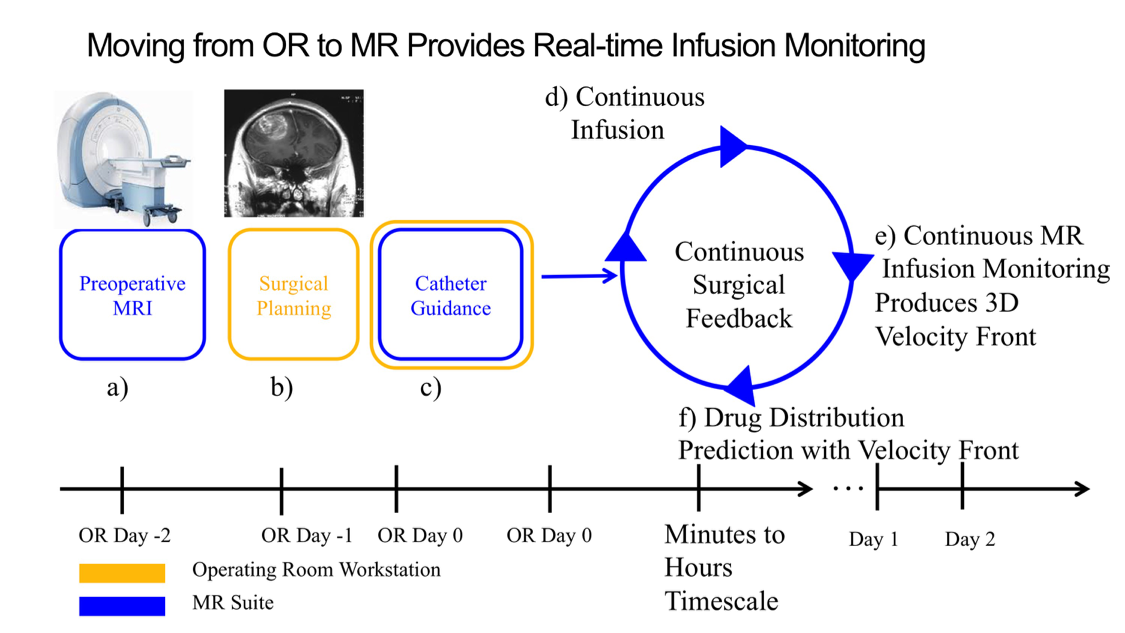
Experimental delivery of convection-enhanced infusions in brain caner trials, depicted in Figure 2, begins with pre-surgical MRI (Fig. 2 Step a), then pre-surgical planning (Step b), followed by stereotactic OR guidance of a catheter inserted through a small craniotomy (Step c). Infusions begin in the OR on day 0 and often continue for 48 hours or longer. Post-infusion validation scans often show marked differences[1] in the actual drug distribution from the planned distribution, a shortcoming that is addressed here with real-time MR monitoring and periodic infusion prediction. We have previously shown how catheter alignment can be guided at 5 frames/second in the MR suite (Step c)[2], a rate approaching stereotactic OR feedback. The proposed method would continuously monitor a co-infused MR Gd tracer during the first few minutes to hours of the infusion protocol (Steps d-f in Fig. 2) to produce more accurate predictions of the actual end distribution.
To develop a new prediction algorithm utilizing real-time MR monitoring of the infusion front to infer the likely final distribution, we utilized data acquired in CED infusions in the putamen of a preclinical model. Volumetric T1-weighed acquisitions, altering between flip angles of 6 and 34 degrees, were acquired concurrently with the ongoing infusion (100 µl with 2mM gadoteridol infused at 1 µl/minute over 100 minutes). The acquisition pairs were used to obtain a time series of quantitative T1 maps, and the change in T1 provided a time-resolved concentration map of the ongoing infusion. A 3D velocity boundary vector at the infusion front was derived from a difference image between sequential volumetric monitoring maps.
The infusion flux at the infusion front is directly proportional to the pressure gradient along the boundary according to dp/dn =vn Φ/K where p is pressure, vn is the MR-derived velocity boundary vector, Φ is the pore fraction provided through a previously acquired ADC map, and K is the hydraulic conductivity. By calculating the infusion flux at a moderate distance from the catheter tip at an intermediate time point (tens of minutes after infusion), the remainder of the likely infusion distribution can be calculated using knowledge of the properties of the surrounding untreated tissue, derived from pre-infusion MR imaging.
Results
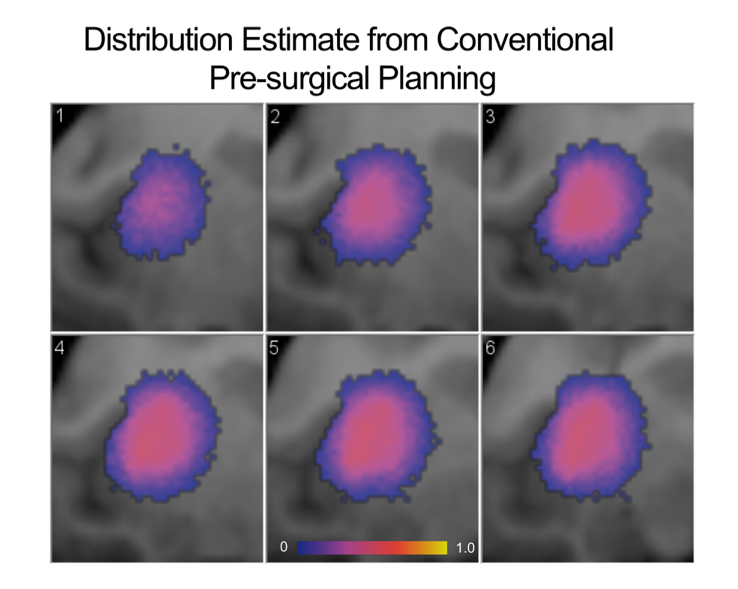
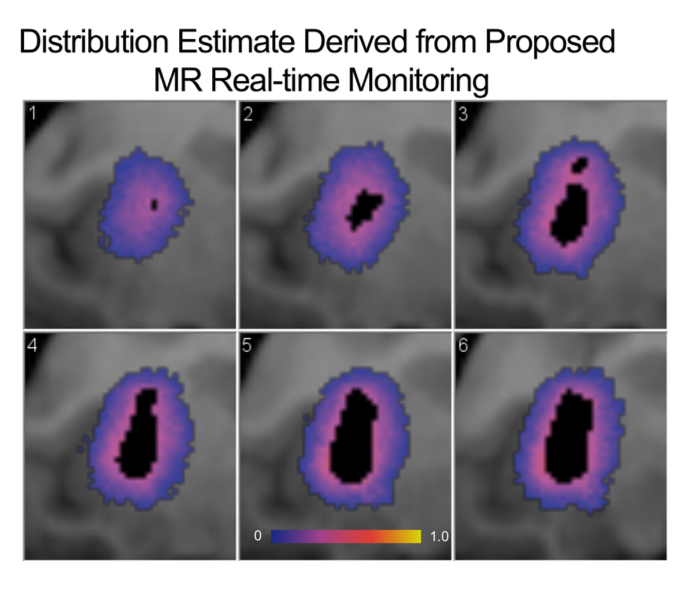
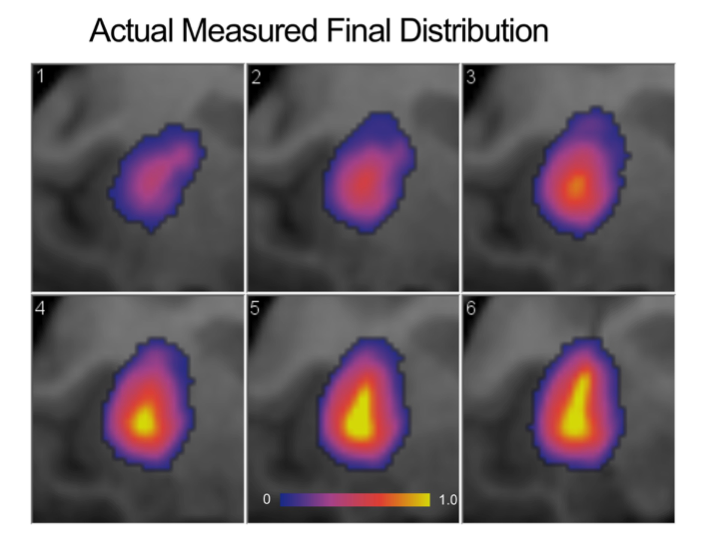
The conventional pre-surgical derived end drug distribution estimate, shown in Figure 3, is largely spherical as expected throughout the isotropic diffusion of the putamen’s gray matter. A 3D velocity boundary vector was calculated at the 22 minute mark of the infusion using the real-time MR monitoring data. Using the algorithm described above, a more ellipsoidal end distribution is predicted, as shown in six axial slices in Figure 4. The actual end distribution after 100 minutes of infusion, shown in Figure 5, is also somewhat ellipsoidal and agrees well with the estimated infusion in Figure 4.Discussion
The existing pre-surgical drug distribution estimate utilizes an idealized model of a catheter tip and thus can’t model subject-to-subject variations in the complex backflow occurring along the exterior of the catheter. Simply waiting till the infusion is underway allows for a much better characterization of the initial velocity front fueling the infusion. The discrepancy between the actual end distribution and pre-surgical planning estimate will depend on the extent of backflow and the complexity of the tissue in which the catheter tip resides.Conclusion
We have developed a means to use real-time monitoring of a co-infused Gd tracer during the initial stages of CED brain infusions to more accurately predict the final end drug distribution than possible with conventional pre-surgical algorithms. This can potentially provide surgical feedback in time for the flow protocol to be altered to produce the desired distribution.Acknowledgements
We gratefully acknowledge NIH funding from 5R44CA177205-03 and previous support from the Kinetics Foundation. We also acknowledge Professor Marina Emborg for her assistance in designing and executing the pre-clinical experiment.References
[1] J. H. Sampson, G. Archer, C. Pedain, E. Wembacher-Schroder, M. Westphal, S. Kunwar, et al., "Poor drug distribution as a possible explanation for the results of the PRECISE trial," J Neurosurg, vol. 113, pp. 301-9, Aug 2010. [2] P. H. Roseboom, A. S. Fox, J. A. Oler, D. R. McFarlin, B. P. Grabow, M. E. Olsen, et al., "Overexpression of Corticotropin-releasing Hormone (CRH) in the Dorsal Amygdala Alters Anxious Temperament and Brain Metabolic Activity," Biological Psychiatry, vol. 77, pp. 48S-49S, May 2015.Figures