5535
Assessment of Neurochemical changes in HIV adults Using Accelerated MR Spectroscopic Imaging and Compressed Sensing Reconstruction1Human Magnetic Resonance Center, Institute for Applied Life Sciences (IALS), University of Massachusetts, Amherst, MA, United States, 2Radiological Sciences, University of California Los Angeles, Los Angeles, Los Angeles, CA, United States, 3Medicine, Harbor-UCLA Medical Center, Torrance, CA, United States, 4Psychiatry and Behavioral Sciences, Emory School of Medicine, GA, United States
Synopsis
In this work, we have successfully evaluated the accelerated 5D EP-JRESI sequence in 16 adult HIV-infected patients and 15 healthy subjects. Compared to healthy subjects, significant neurochemical changes were observed in HIV+ patients on ART: elevated Ch/Cr ratios in frontal gray, right frontal white and right basal ganglia locations, decreased Glx ratios in the left frontal white, right basal ganglia, occipital gray and white and right insular cortical regions. There was also decreased NAA/Cr in the left basal ganglia and right occipital white regions. In the HIV+ patients, a positive correlation was recorded between the left basal ganglia NAA/Cr and the number of years of ART treatment (r=0.58, p<0.02).
Introduction
Recently pilot two dimensional J-resolved spectra were recorded in healthy human brain as well as HIV-infected and healthy youths from three-dimensional spatial encoded volume using accelerated echo-planar J-resolved spectroscopic imaging1-2. These results were mostly in agreement with earlier reports using localized 1D MR spectroscopy3-5. To record multi-voxel 2D J-resolved spectra in multiple brain slices of adult HIV+ compared to age-matched healthy subjects, and to correlate the metabolite ratios in HIV+ subjects with different brain regional volumes recorded by 3D MRI, the number of years of antiretroviral therapy (ART) and the CD4 cell counts.Materials and Methods
Sixteen HIV+ patients (mean age of 43.5 years) who were on stable ART and 15 healthy subjects (mean age of 46.3 years) were recruited for this study. This study was approved by the institutional review board and all subjects were consented in writing. After recording scout images, 3D MP-RAGE data was recorded in the sagittal plane. The non-uniformly sampled (NUS) EP-JRESI sequence combining 2D spectral with 3D spatial encoding was recently implemented on a Siemens 3T Skyra MRI scanner (Siemens Medical Solutions, Erlangen, Germany) operating on a VD13a platform. The acquisition parameters were (1): TE/TR = 30/1200 ms, FOV = 24x24x12 cm3, 1.5x1.5x1.5 cm3 resolution, spectral BW (F2/F1)= 1190/1000 Hz, 64 t1 increments, 8x NUS for a scan time ~20 min. A 16-channel head “receive’ array in combination with a body “transmit’ was used. The 5D EP-JRESI data was processed using a modified split Bregman algorithm for L1 minimization of the data in the image/spectral domains; outside the spectral region of interest (1.0-4.3 ppm), data was masked to increase self sparsity and decrease dynamic range for the reconstruction 6-7. Metabolite ratios were calculated using peak integration after ~1 pixel/ppm data shifting to take into account chemical shift displacement artifacts between the different resonances.Results
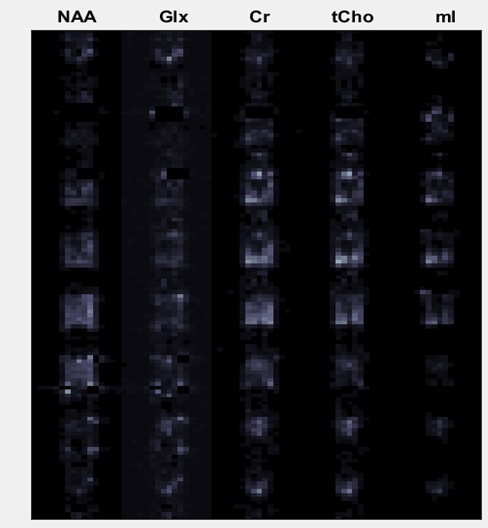
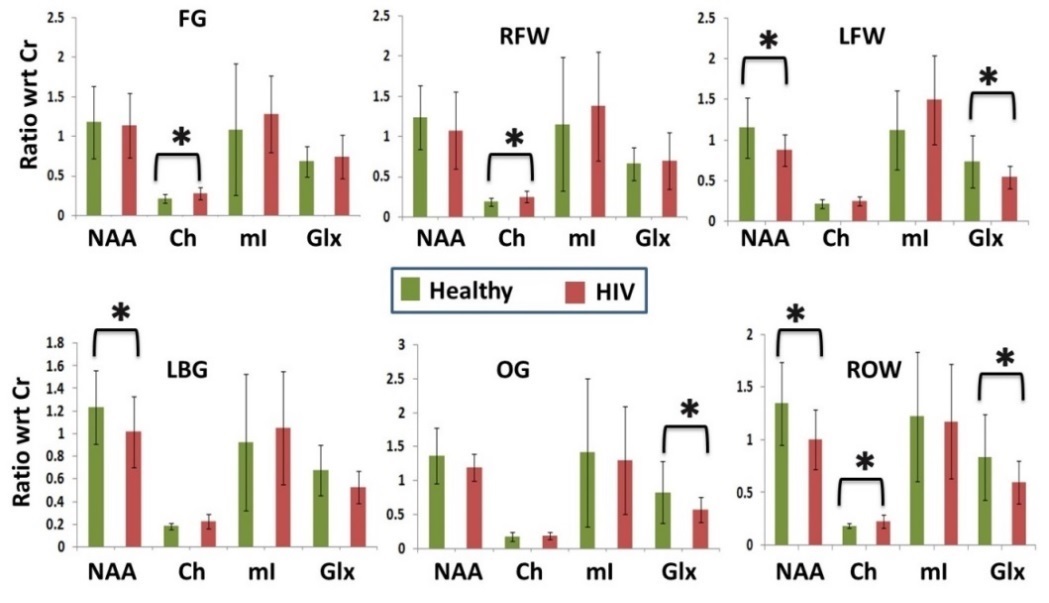
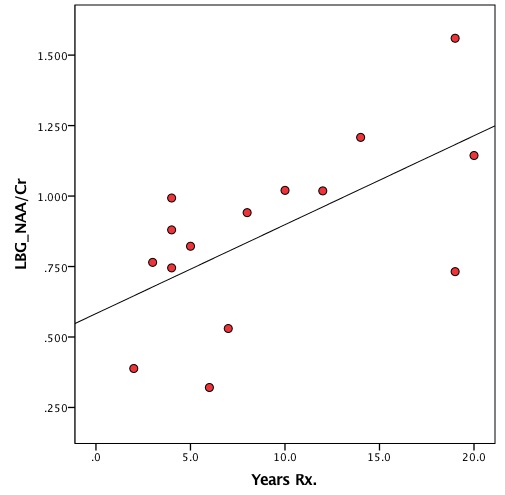
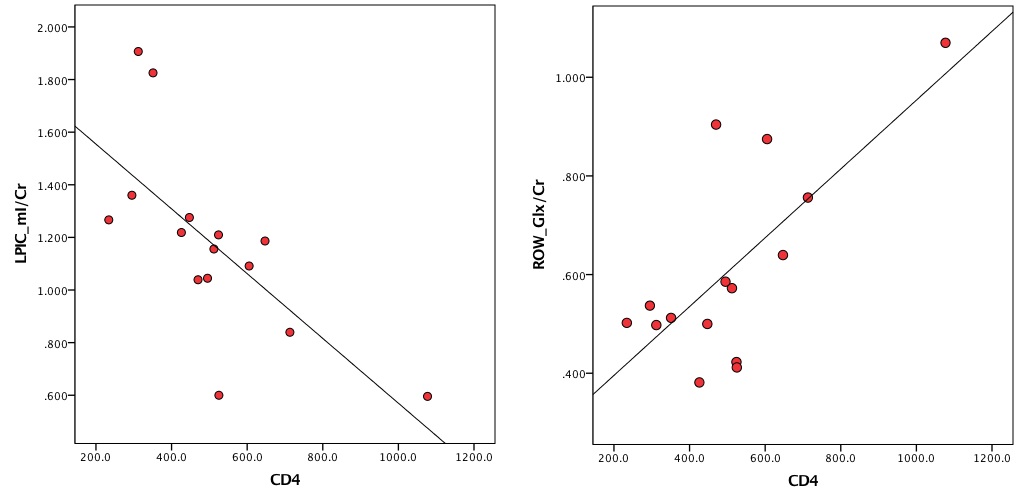
Metabolite maps recorded in a 53 year-old HIV+ subject using the 5D EP-JRESI NUS sequence (8X) are shown in Fig.1. Each metabolite was normalized to its maximum so that they appear on the same gray scale. Regional peak integrals of major metabolites in fifteen HIV+ patients and fifteen healthy adults with TV reconstruction of the 5D EP-JRESI NUS data are shown in Fig.2. The green and red bars represent metabolite ratios (/Cr) of healthy and HIV+ subjects. Metabolite ratios from the following locations are shown: medial frontal gray (FG), dorsolateral right and left prefrontal white (RFW, LFW), left basal ganglia (LBG), occipital gray (OG), and right occipital white (ROW). Ch/Cr ratios were significantly elevated in FG, RFW and RBG locations. Glx/Cr ratios were significantly decreased in the following locations: LFW, RBG, OG, ROW and right insular cortex. NAA/Cr was significantly decreased in LBG and ROW regions. Metabolite ratios with respect to Ch were also calculated showing similar trends. Fig.3 is a correlation plot between the number of years of ART treatment and NAA/Cr recorded in the LBG of 15 HIV+ patients using the 5D EP-JRESI data (r=0.58, p<0.02). A regression analysis between MRI and 5D EP-JRESI showed the following: i) mI/Cr in the right posterior insular cortex was a significant predictor for the right thalamus proper volume with p=0.002; ii) Ch/Cr in RFW was also significantly reliable to represent right thalamus proper volume with significance value of p=0.01; iii) mI/Cr in the right posterior insular cortex was the best fit to CC-mid anterior volume with p=0.006. As shown in Fig.4A, there was an excellent correlation (r=0.7 and p=0.004) between mI/Cr recorded in the left posterior insular cortex and CD4 in 15 HIV+ patients. Similar correlation (r=0.7 and p=0.003) between Glx/Cr recorded in the right occipital white matter region and CD4 is shown in Fig.4B.Discussion
The outcome of this pilot study using the accelerated 5D EP-JRESI sequence showed that all the neurochemical changes were in agreement with previous reports. The accelerated 5D-EP-JRESI method should be thought of as a method that benefits from improved SNR, as well as a technique that is capable of obtaining several experimental parameters from a single scan - metabolite ratios from Prior-knowledge fitting, T2 values from relaxation fitting, and glutamate concentrations from TE-averaged spectroscopy.Conclusion
We have summarized our successful pilot 5D EP-JRESI findings in HIV+ patients and healthy subjects. Due to the limited number of pilot study patients, these preliminary findings require confirmation using a larger patient cohort.Acknowledgements
NIH/NINDS: (#1R21NS086449-01A1).References
1. Wilson, et al., Accelerated Five-Dimensional Echo Planar J-Resolved Spectroscopic Imaging: Implementation and Pilot Validation in Human Brain.Magn Reson Med, 2016;75:42-512.
2. Iqbal, et al., Pilot Assessment of Brain Metabolism in Perinatally HIV-Infected Youths Using Accelerated 5D Echo Planar J-Resolved Spectroscopic Imaging.Plos One PLOS ONE | DOI:10.1371/journal.pone.0162810 September 13, 2016.3.
3. Lentz MR, Kim WK, Lee V, et al. Changes in MRS neuronal markers and T-cell phenotypes observed during early HIV infection. Neurology 2009; 72:1465-72 .
4. Sailasuta N, Ross W, Ananworanich J, Clemchai T, DeGruttola V, Lerdlum S, Pothisri M, Busovaca E, Ratto-Kim S, Jagodzinski L, Spudich S, Michael N, Kim JH, Valcour V RV254/SEARCH 010protocol teams. Change in brain magnetic resonance spectroscopy after treatment during acute HIV infection. PLoS One2012;7:e49272.
5. Nagarajan R, Sarma MK, Thomas MA, Chang L, Natha U, Wright M, Hayes J, Nielsen-Saines K, Michalik DE, Deville J, Church JA, Mason K, Critton-Mastandrea T, Nazarian S, Jing J, Keller MA. Neuropsychological. Function and Cerebral Metabolites in HIV-infected Youth. J Neuroimmune Pharmacol 2012 Dec;7(4):981-906.
6. Wilson NE, Burns BL, Thomas MA. 5D Echo-planar J-resolved spectroscopic imaging of cerebral metabolites in HIV-infected youth: a preliminary study. 21st ISMRM meeting, Salt Lake City, Utah, 2013#2010.
7. Bhave S, Eslami R, Jacob M. Sparse spectral deconvolution algorithm for noncartesian MR spectroscopic imaging Magn Reson Med 2013; doi: 10.1002/mrm.24693.
Figures