5534
Using 3D MEGA-LASER MRSI to study the role of basal ganglia GABA and Glx in response selection in Manganese neurotoxicology1School of Health Sciences, Purdue University, West Lafayette, IN, United States, 2Department of Radiology and Imaging Sciences, Indidana University School of Medicine, Indianapolis, IN, United States, 3Department of Speech, Language, and Hearing Sciences, Purdue University, West Lafayette, IN, United States, 4Cognitive Neurophysiology, Department of Child and Adolescent Psychiatry, Faculty of Medicine of the Technische Universität Dresden, Germany, 5Department of Biomedical Imaging and Image-guided Therapy, High Field MR Center, Medical University of Vienna, Vienna, Austria, 6Martinos Center for Biomedical Imaging, Massachusetts General Hospital, Harvard Medical School, Boston, MA, United States
Synopsis
This pilot study on manganese (Mn) neurotoxicity investigates the association between deficits in response selection and GABA and Glx levels in basal ganglia structures using MEGA-LASER 3D MRSI. Using a novel automated brain-structure-specific quantification approach for GABA+ and Glx, we studied three basal ganglia structures and the thalamus in Mn-exposed welders and controls. A modified Simon task was used to measure selection inhibition. GABA+ and Glx in putamen and globus pallidus were associated with response times in the most complicated experimental scenario in Mn-exposed subjects; whereas thalamic Glx levels were associated with response time for all subjects.
Introduction
Gamma-aminobutyric acid (GABA), the main inhibitory neurotransmitter, has been reported to be associated with cognitive control and selection inhibition1,2,3, in which excitatory and inhibitory balance is finely controlled in basal ganglia region. To date, such studies have been mostly conducted using the single voxel MEGA-PRESS technique, which is limited by a large region of interest including more than one brain structure. Recently a novel 3D MEGA-edited MRSI sequence with LASER localization and real-time motion and shim updates4 was developed. In addition, we developed a brain-structure-specific approach to calculate the MRSI-measured metabolite levels from the basal ganglia and the thalamus, providing a powerful tool to study the role of the neurotransmitter system on cognitive functions. In this pilot study on Manganese(Mn) neurotoxicity, we aimed at investigating the effect of Mn exposure on the relationship between glutamate+glutamine (Glx) and GABA in several basal ganglia structures and response inhibition as measured by a modified Simon task5.Methods:
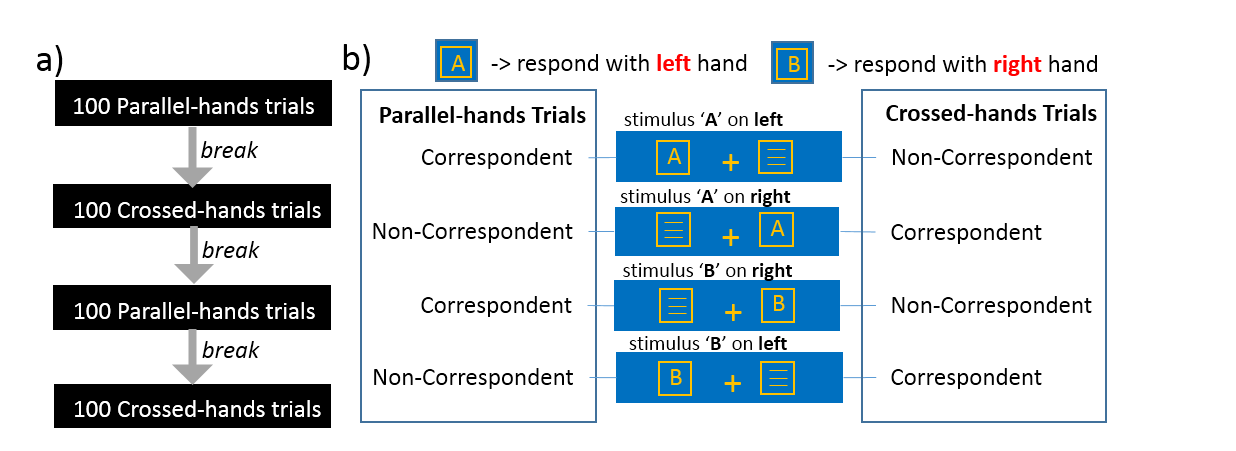
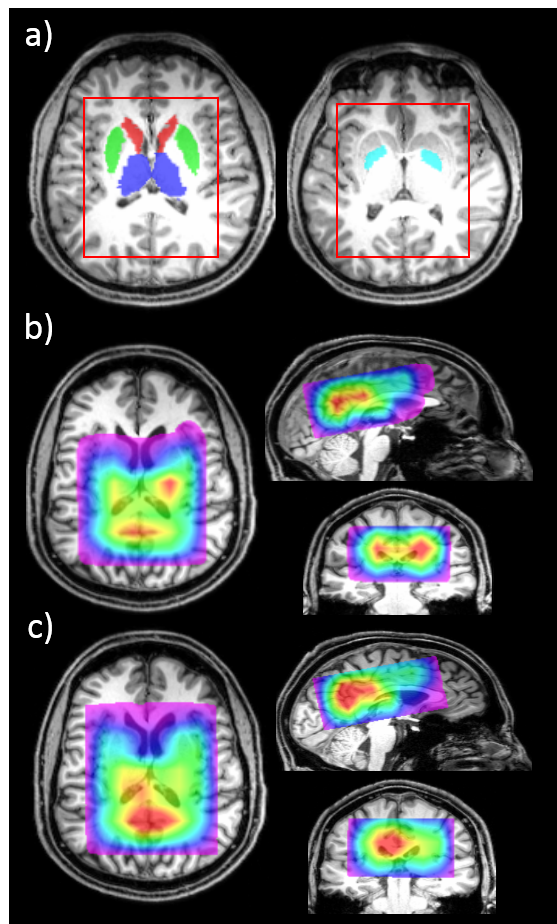
10 male welders (airborne [Mn]=0.11±0.01 mg/m3) and 9 age-matched male controls were recruited for the study. All the MRI/MRSI scans were performed on a Siemens 3T Tim Trio scanner with a 32-channel head coil. MPRAGE images were acquired for anatomical information. The volume of interest (VOI) of the MRSI acquisition (TR/TE=1600/68ms, acquisition resolution:14x14x14mm3,TA:19:44 min) was placed on the basal ganglia region including the thalamus. Metabolite quantification was performed using LCModel V6.3-1B6. GABA+, representing GABA and co-edited macromolecules, and glutamate+glutamine (Glx) quantified from difference spectra were normalized to total creatine (tCr) from edit-off spectra. Metabolite maps were generated using a Matlab-based (MathWorks,Inc.,Natick,MA,USA) package4 and interpolated and registered to MPRAGE images. MPRAGE images were processed with Freesurfer7,8 to segment the brain and generate structural masks of four basal ganglia structures: thalamus, caudate, putamen and globus pallidus. After registering the masks to the metabolite maps (Fig.1a), the mean GABA+/tCr and Glx/tCr for each brain structure was calculated. A modified Simon task5 was used to measure selection inhibition. The design of the experimental paradigm is displayed in Fig.1a. The subjects were asked to respond to the stimulus from each trial as fast and as accurately as possible. The positions of the left and right hands were either parallel to each other, or crossed. All types of stimuli and the corresponding definition of ‘correspondent’ and ‘non-correspondent’ trials are shown in Fig.1b. For each subject, mean response time (RT) was calculated for correct responses for the following four cases: correspondent and non-correspondent trials, each with parallel-hands and crossed-hands. Group differences between welders and controls in GABA+/tCr and Glx/tCr from both sides of the 4 brain regions, and in 4 types of RTs were tested using the Kruskal Wallis test. Age-controlled correlation between RTs and GABA+/tCr, as well as Glx/tCr was performed for welders and all subjects to investigate whether the relationship is specific to Mn-exposed welders. FDR correction for multiple comparisons with q-value of 0.1 was applied for all statistical analyses (SAS9.3(2011,SAS Institute Inc.,Cary,NC,USA))
Results:
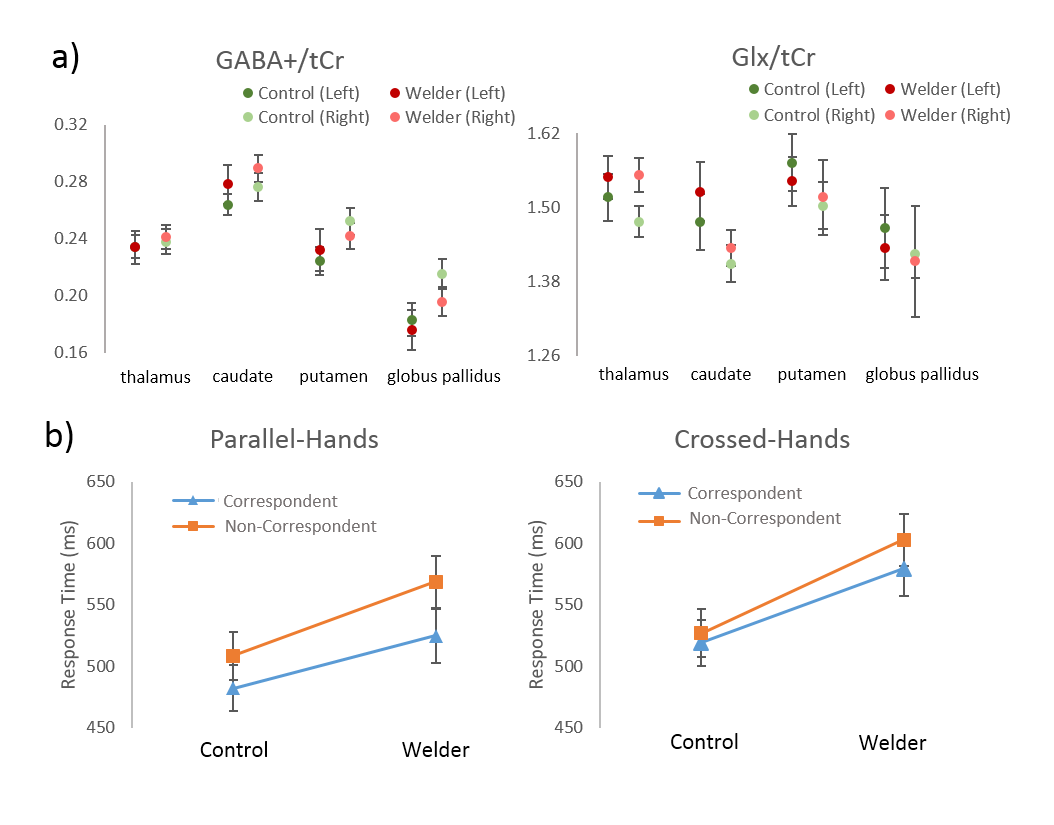
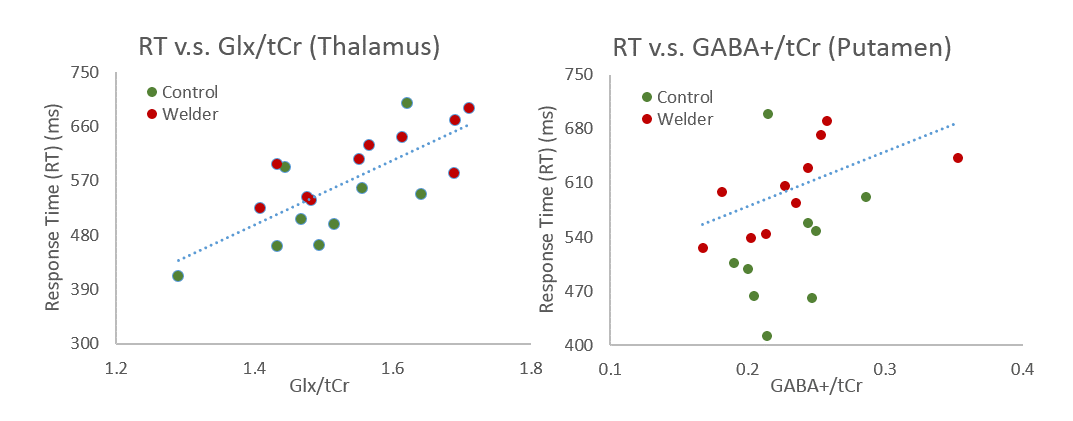
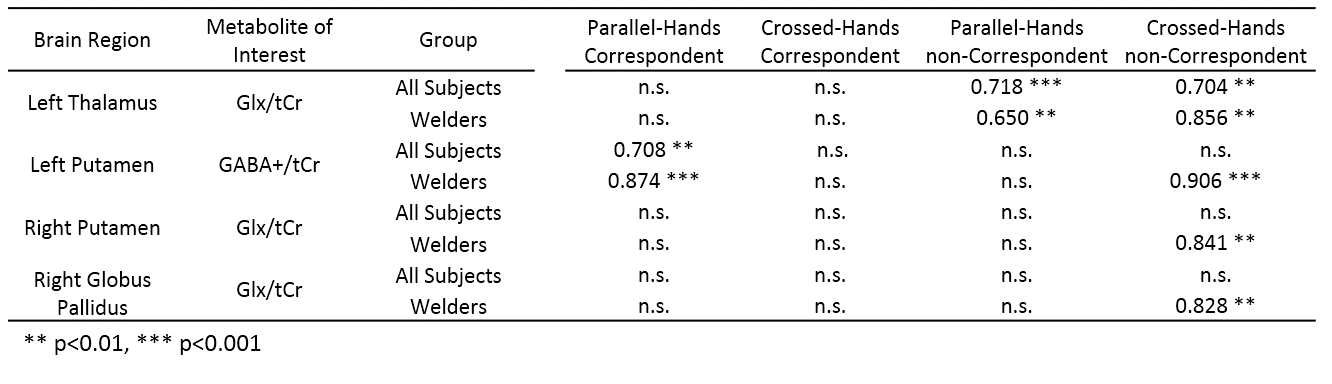
Representative GABA+ and Glx maps are shown in Fig.2 b-c. Mean±SE of the GABA+/tCr and Glx/tCr from each brain region are shown in Fig.3a. There was no significant difference in GABA+/tCr or Glx/tCr between welders and controls. All RTs were higher in welders but not statistically significant. 4 types of RTs (mean±SE) are displayed in Fig.3b. The correlation results are presented in Table 1, listing only brain regions showing significant correlations with RTs. To highlight the results, for all subjects, left thalamic Glx/tCr correlates significantly with RTs from non-correspondent trials with both parallel-hands(r=0.72;p<0.001) and crossed-hands(r=0.70;p<0.01).The associations specific to welders include 1) GABA+/tCr in left putamen correlates with RTs from crossed-hands-non-correspondent trials(r=0.91;p<0.001); 2) Glx/tCr in right putamen(r=0.84,p<0.01) and globus pallidus(r=0.83;p<0.01) correlate significantly with RT from crossed-hands-non-correspondent trials. To visualize the relationship between neurotransmitters and RTs, scatter plots of the RT in crossed-hands-non-correspondent trials v.s. thalamic Glx/tCr and putamen GABA/tCr are shown in Fig.4.Conclusion and Discussion:
In this pilot study, our newly-developed automated brain-region-specific approach has served as a practical tool to investigate GABA and Glx measured by MEGA-LASER 3D MRSI. Higher thalamic Glx has a general effect in increasing response time for non-correspondent trials, which could possibly be explained by a lack of additional inhibition needed in cortical areas to suppress the incorrect response. Selection inhibition seems to be affected by Mn exposure through subtle changes of striatal and pallidal GABA and Glx, as the striatum and globus pallidus are the primary targets for Mn deposition9. More subjects need to be recruited to improve the statistical power of the conclusion.Acknowledgements
The study was supported by NIEHS R01 ES020529.References
1. Haag L, Quetscher C, Dharmadhikari S, et al., Interrelation of resting state functional connectivity, striatal GABA levels, and cognitive control processes. Hum Brain Mapp. 2015;36(11):4383-4393
2. Quetscher, C., Yildiz, A., Dharmadhikari, S. et al. Striatal GABA-MRS predicts response inhibition performance and its cortical electrophysiological correlates. Brain Struct Funct. 2015;220:3555.
3. Dharmadhikari S, Ma R, Yeh CL et al., Striatal and thalamic GABA level concentrations play differential roles for the modulation of response selection processes by proprioceptive information. NeuroImage. 2015;120:36-42
4. Bogner W, Gagoski B, Hess A.T et al., GABA imaging with real-time motion correction, shim update and reacquisition of adiabatic spiral MRSI. Neuroimage. 2014;103: 290-302
5. Stock A-K, Wascher E, Beste C, Differential Effects of Motor Efference Copies and Proprioceptive Information on Response Evaluation Processes. PLoS ONE, 2013;8(4): e62335.
6. Provencher SW, Estimation of metabolite concentrations from localized in vivo proton NMR spectra. Magn. Reson. Med. 1993;30(6): 672-679
7. Fischl B, Salat DH, Busa E et al., Whole brain segmentation: automated labeling of neuroanatomical structures in the human brain. Neuron 2002;33:341-355.
8. Fischl B, Salat DH, van der Kouwe AJ et al., Sequence-independent segmentation of magnetic resonance images. Neuroimage. 2004a;23 Suppl 1: S69-84.
9. Burton NC, Guilarte TR, Manganese Neurotoxicity: Lessons learned from longitudinal studies in nonhuman primates. Enviorn. Health. Persp. 2009:117(3):235-332
Figures