5530
A Minimum-Phase Shinnar-Le Roux Spectral-Spatial Excitation RF Pulse for Water and Lipid Suppression in 1H MRSI of Body Extremities1Biomedical Engineering, Tsinghua University, Beijing, People's Republic of China, 2Gordon Center for Medical Imaging, Radiology, Massachusetts General Hospital, Harvard Medical School, Boston, MA, United States, 3Engineering Physics, Tsinghua University, Beijing, People's Republic of China
Synopsis
It is challenging to remove nuisance water and lipid signals in 1H-MRSI of body extremities. Strong lipid signals exist both in the subcutaneous layer and bone marrow but also in the muscle, i.e., intramyocellular and extramyocellular lipids. This work presents a novel minimum-phase Shinnar-Le Roux (SLR) spectral-spatial excitation RF pulse for both water and lipid suppression in 1H-MRSI of body extremities. We have validated the proposed method using Bloch equation simulation, phantom, and in vivo studies.
Purpose
The Cho/Cr ratio form proton (1H) MRS/MRSI has been shown useful in guiding radiation therapy and assessing response to therapy in soft tissue sarcoma patients1. However, lipids not only exist in the subcutaneous layer and bone marrow of body extremities but also in the muscle, i.e., intramyocellular and extramyocellular lipids (IMCL and EMCL). This makes it challenging to remove/suppress the lipids signals from 1H-MRSI using the conventional outer-volume-suppression (OVS) methods2,3 and the post-processing methods that rely on the support information of lipids4,5,6. Spectral-spatial pulses7,8,9 can be used to address this issue because: (a) the Cho and Cr peaks are relatively far away from the major lipid peaks at high field and (b) these pulses are insensitive to both B0 and B1 inhomogeneities. This work presents a novel minimum-phase Shinnar-Le Roux (SLR) spectral-spatial excitation RF pulse for both water and lipid suppression in 1H-MRSI of body extremities.Methods
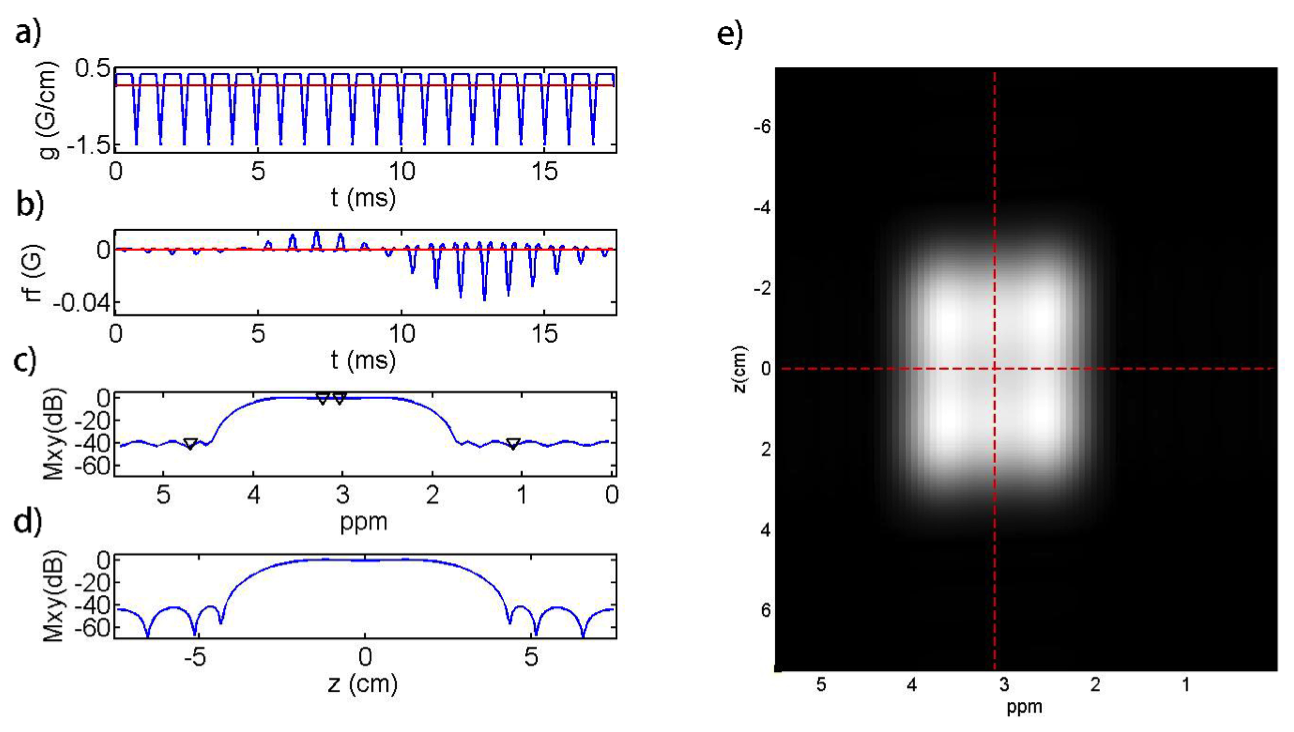
A spectral-spatial excitation RF pulse for water and lipid suppression at 3T is designed using the multidimensional SLR RF pulse design method in Ref. [10]. As shown in Fig. 1, a fly-back echo planar gradient waveform is used for slice selection. The desired passband along the spectral axis is 250 Hz in width centered at 197 Hz (3.1 ppm at 3T, right between the 3.0 ppm peak of Cr and 3.2 ppm peak of Cho). The desired slab thickness is 6 cm. The desired passband and stopband ripple level are 5% and 1% (100x suppression), respectively. The time-bandwidth products for the spectrally and spatially selective profile are 4.0 and 4.4, respectively. The total length of the pulse is 17.7 ms. The desired flip angle is 43°. A minimum-phase profile along the spectral axis is used to minimize the signal loss due to transversal relaxation.
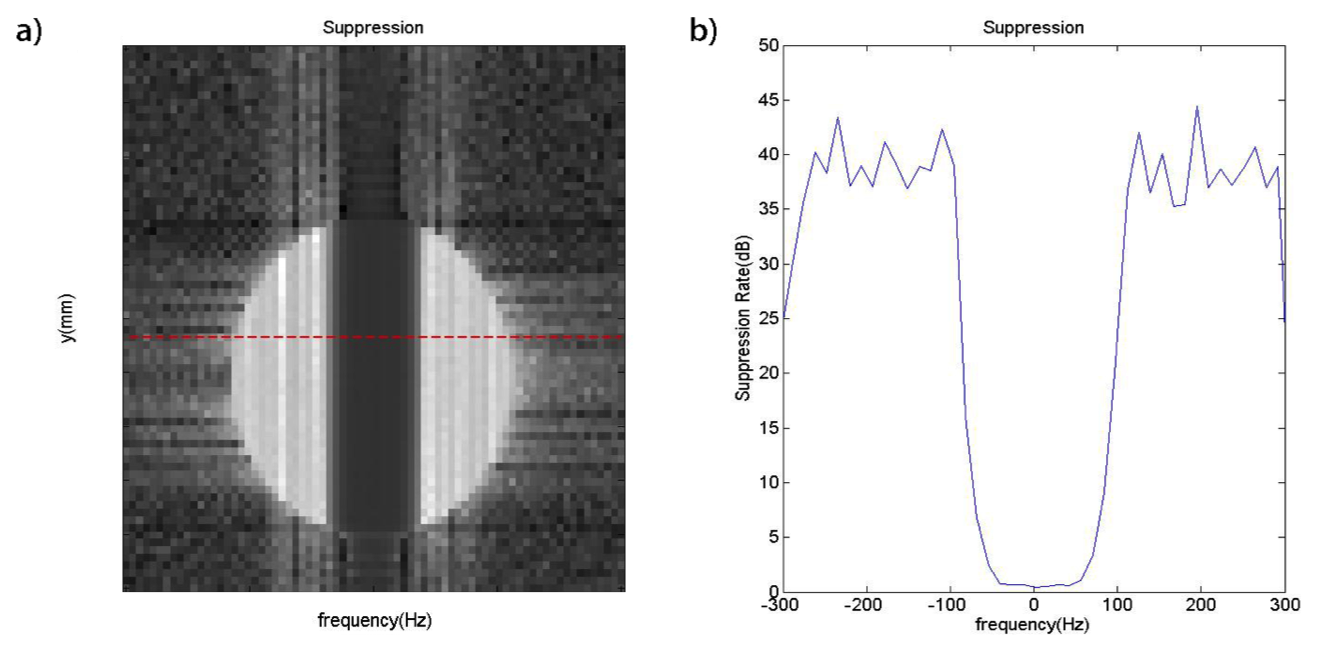
The performance of the designed spectral-spatial RF pulses was first validated using phantom studies on a 3T PET/MRI scanner (Biograph mMR, Siemens Medical Systems, Erlangen, Germany). A customized 3D GRE sequence was implemented to excite signals using the designed RF pulse. A 0.2 mT/m gradient was added to the shimming gradient along the x-axis to mimic the spectral axis. The acquired 3D images were compared with those excited by the conventional sinc slice-selective RF pulse.
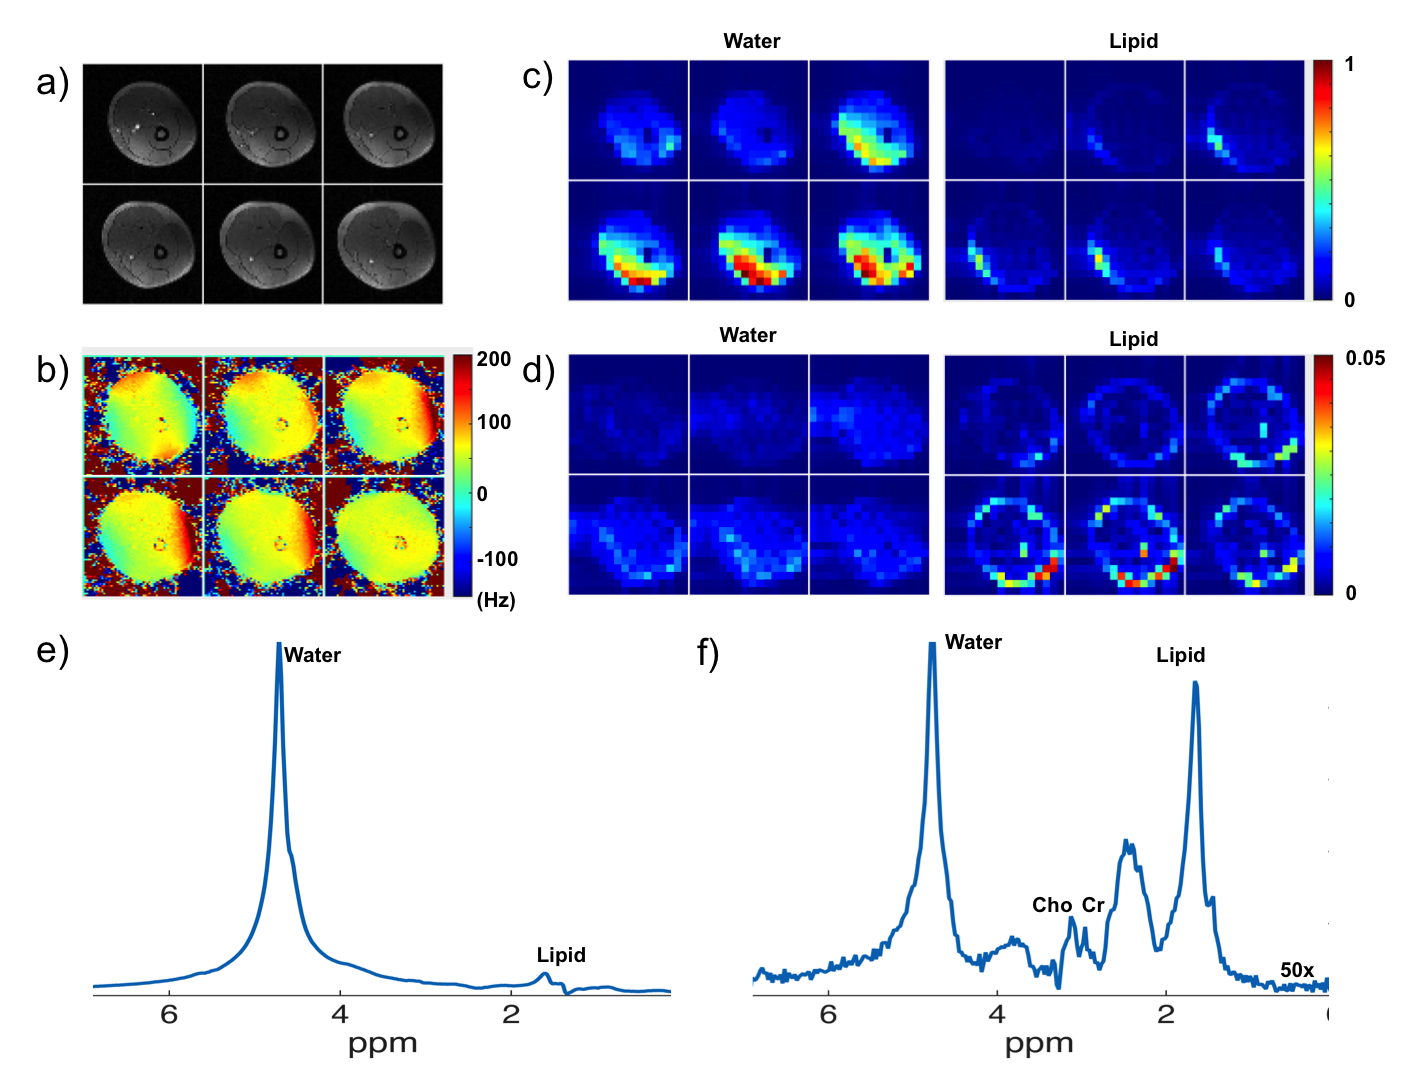
Further validation was performed by acquiring a 3D 1H-MRSI data set from the left thigh of a healthy subject (approved by our local IRB). A 3D echo-planar spectroscopic imaging (EPSI) sequence was modified to excite FID signals using the designed RF pulse with the following imaging parameters: FOV = 220x220x80mm3, encoding matrix = 16x16x6 (spatial) x 360 (spectral), TR/TE= 330/4.5 ms, readout bandwidth = 68kHz, echo-spacing (bi-polar acquisition) = 0.66 ms, 12 averages, imaging time = 6.5 min.
Results
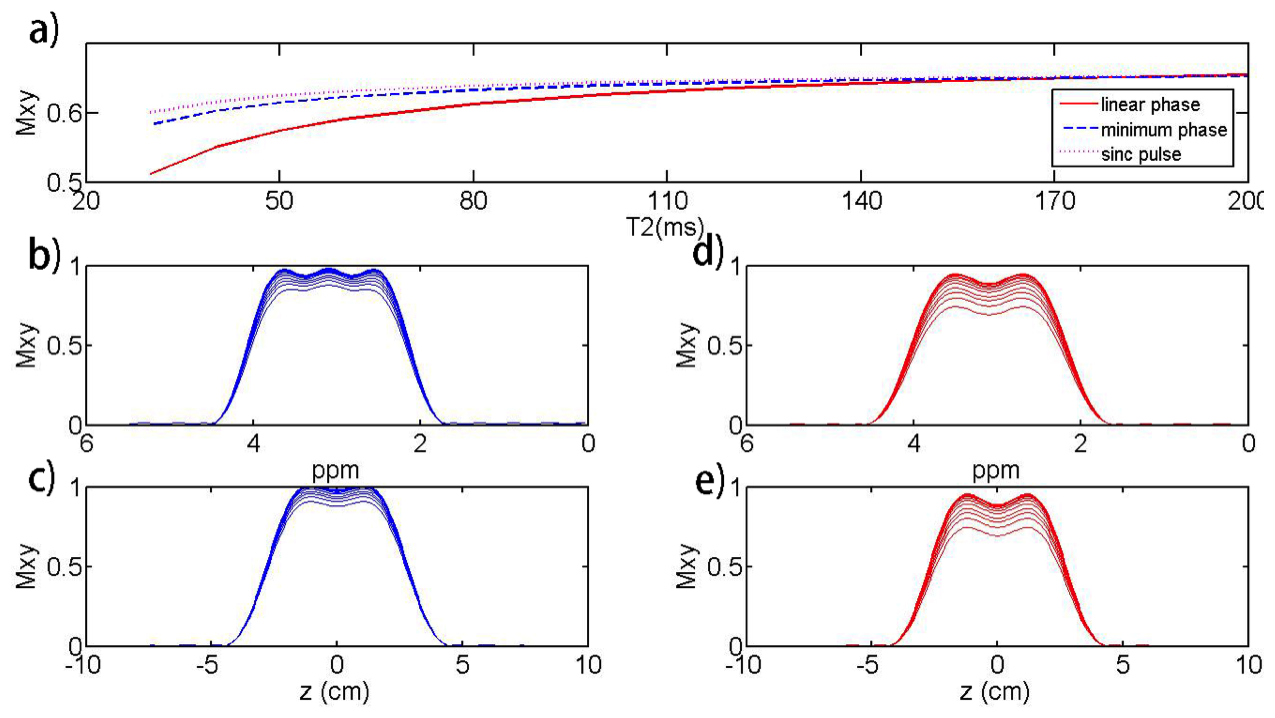
Figure 1 shows the gradient and RF waveforms of the designed spectral-spatial RF pulse and the excitation patterns obtained by the Bloch equation simulation, which met well with the design specifications. Figure 2 shows the effects of transversal relaxation on the excitation profile obtained by the Bloch equation simulation. Compared to a linear-phase spectral-spatial pulse, the designed minimum-phase pulse significantly reduced the signal loss due to T2 decay. In fact, the signal loss of the designed 17.7ms pulse was comparable to a conventional 5ms sinc pulse.
Phantom results are shown in Figs. 3 and 4. The excitation patterns obtained by the designed RF pulse matched closely with the Bloch equation simulation results. In vivo results are shown in Fig. 5. As can bee seen, the designed RF pulse successfully suppressed both water and lipid signals with practical B0 and B1 inhomogeneities. Notably, the peaks of Cr and Cho were overwhelmed by the water and lipid signals when the conventional excitation was used (Fig. 5e), they were clearly distinguishable in the spectrum (Fig. 5f) obtained using the designed RF pulse.
Conclusion
Spatial-spectral RF pulses can be used to suppress both water and lipid signals in 1H-MRSI of body extremities. The proposed RF pulse can be useful for 1H-MRSI in soft tissue sarcoma patients.Acknowledgements
This work was support in part by Tsinghua Top Open Program for Undergraduate Performing Research Abroad and by the National Institutes of Health; Grants: R01CA165221 and R21EB021710.References
1. Zhang X, Chen YL, Lim R, Chuan Huang, Chebib IA, El Fakhri G. Synergistic role of simultaneous PET/MRI-MRS in soft tissue sarcoma metabolism imaging, Magn Reson Imaging 2016;34:276-279.
2. Duyn JH, Gillen J, Sobering G, van Zijl PCM, Moonen CTW. Multisection proton MR spectroscopic imaging of the brain. Radiology 1993; 188:277–282.
3. Le Roux P, Gilles RJ, McKinnon GC, Carlier PG. Optimized outer volume suppression for single-shot fast spin-echo cardiac imaging. J Magn Reson Imaging 1998;8:1022–1032.
4. Haupt CI, Schuff N, Weiner MW, Maudsley AA. Removal of lipid artifacts in 1H spectroscopic imaging by data extrapolation. Magn Reson Med 1996;35:678–687.
5. Hu X, Patel M, Chen W, Ugurbil K. Reduction of truncation artifacts in chemical-shift imaging by extended sampling using variable repeti- tion time. J Magn Reson Series B 1995;106:292–296.
6. Ma C, Lam F, Johnson CL, Liang ZP. Removal of nuisance signals from limited and sparse 1H MRSI data using a union-of-subspaces model. Magn Reson Med 2016;75:488-497.
7. Spielman D, Pauly J, Macovski A, Enzmann D. Spectroscopic imaging with multidimensional pulses for excitation: SIMPLE. Magn Reson Med 1991;19:67–84.
8. Meyer CH, Pauly JM, Macovski A, Nishimura DG. Simultaneous spatial and spectral selective excitation. Magn Reson Med 1990;15:287–304.
9. Schricker AA, Pauly JM, Kurhanewicz J, Swanson MG, Vigneron DB. Dualband spectral-spatial RF pulses for prostate MR spectroscopic imaging. Magn Reson Med 2001;46:1079-1087.
10. Ma C, Liang ZP, Design of multidimensional Shinnar-Le Roux radiofrequency pulses. Magn Recon Med 2015;73:633-645.
Figures