5529
Lipid Suppression in 3D Magnetic Resonance Spectroscopic Imaging1University of Miami, Miami, FL, United States
Synopsis
Proton MR spectroscopic imaging (MRSI) is complicated by the presence of subcutaneous lipids, which, if not suppressed before Fourier reconstruction, cause ringing in metabolite maps due to limited k-space sampling. In this study inversion recovery (IR) based lipid suppressed acquisition was compared to non-lipid suppressed acquisition combined with two methods for reducing lipid ringing in whole brain MRS imaging. Results indicate non-lipid suppressed acquisition using the ℓ2-regularization or Papoulis-Gerchberg algorithm for reconstruction is possible without significant ringing artifacts, however, can have a detrimental effect on spectral linewidth and baseline, resulting in smaller spatial coverage than IR based lipid-suppressed acquisition.
Purpose
Proton MR spectroscopic images are often contaminated by Gibbs ringing due to the presence of intense subcutaneous lipids. For whole-brain metabolite distributions, lipid suppression can be carried out using an inversion recovery (IR) based scheme, however, this also results in a loss of signal-to-noise ratio (SNR). Acquisition of MRSI without lipid suppression followed by post-processing techniques for lipid suppression offers an alternative approach to whole brain MRSI acquisition without loss of SNR. In this study two widely used lipid suppression techniques are compared for whole brain 3D spectroscopic imaging - lipid-basis reconstruction with ℓ2-regularization (L2) 1,2 and lipid reconstruction using the Papoulis-Gerchberg algorithm (LITE) 3.Methods
Two healthy control subjects were imaged to acquire non-lipid suppressed (NLS) and IR lipid suppressed (IR-LS) data for comparison of lipid suppression methods. Volumetric whole-brain MRSI was acquired with TR/TE = 1551/17.6 ms with and without non-selective IR lipid nulling with TI=198 ms; and FOV of 280 x 280 x 180 mm3, matrix size of 50 x 50 with 18 slices and a nominal voxel volume of 0.313 cm3. MRSI reconstruction was carried out using the MIDAS package. For the IR-LS MRSI residual lipid suppression was carried out using the LITE algorithm, whereas for NLS acquisition lipid suppression was carried out with LITE, L2 and a combination of LITE and L2, whereby L2 was employed using a lipid-basis matrix generated following LITE. In all cases a mask indicating the scalp was obtained from a coregistered MRI.
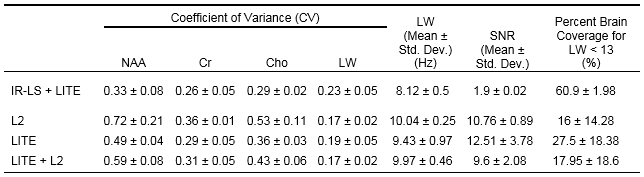
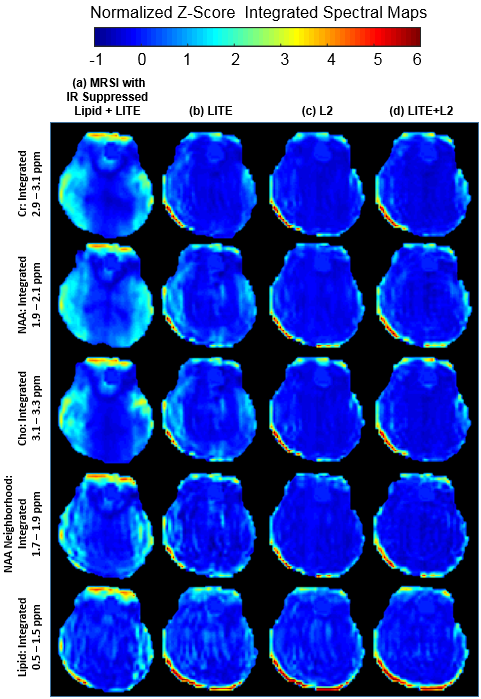
Qualitative performance was compared across lipid suppression techniques by creating maps of integrated spectral regions for N-Acetylaspartate (NAA) (1.9 - 2.1 ppm), Creatine (Cr) (2.9 - 3.1 ppm), Choline (Cho) (3.1 - 3.3 ppm), NAA-neighborhood (NAA*) (1.7 - 1.9 ppm) and subcutaneous lipid region (LL) (0.5 - 1.5 ppm). Brain maps were normalized and presented as z-score maps for comparison across lipid suppression methods. Quantitative comparison measured the whole-brain coefficient of variance (CV) for fitted maps of NAA, Cr and Cho, linewidth and SNR. CV was estimated as the ratio of the standard deviation to the mean of a measure limiting the analysis to only those voxels of the brain that had a spectral linewidth of less than 13 Hz.
Results and Discussion
In Figure 1 are shown z-score normalized magnitude integrated images for Cr, Cho, NAA, NAA* and subcutaneous lipid region. As expected, the Gibbs ringing artifact is more pronounced in the NAA, NAA* and LL maps, with Cr and Cho maps showing fairly little ringing. Comparing IR-LS (Figure 1a) and NLS images (Figure 1 b-d), especially in the LL and NAA* region, IR-LS images show intense Gibbs ringing artifact which are considerably reduced in the NLS images. Qualitatively, lipid-suppression methods incorporating L2 (Figure 1c) or its combination (Figure 1d) show slightly improved performance as compared to LITE alone (Figure 1b). Note that in Fig. 1 the bright regions in the frontal brain show regions of bad B0 homogeneity.
In Table 1 are shown CVs for NAA, Cr, Cho and linewidth (LW) for different lipid suppression methods. Fitted spectral maps for NAA, Cr and Cho show significantly lower CV for IR-LS than NLS methods. This finding, which differs from that seen in the magnitude integrated maps where IR-LS acquisition shows more ringing, likely reflect the variations in the spectral baseline that are better accounted for in the spectral fitting for IR-LS studies.
Among NLS methods, L2 based lipid suppressed images show a higher CV, whereas little difference was seen in methods incorporating the LITE method. Overall, NLS methods resulted in a considerably smaller portion of the brain being sampled as compared to IR-LS acquisition. Moreover, an important finding seen from the results is a detrimental effect on LW by the inclusion of the L2 algorithm with MRS reconstruction comprising of L2 method showing about 10% lower brain coverage as compared to LITE technique using a quality evaluation based on spectral linewidth ≤13 Hz. Finally, NLS methods reported about a 5 times improvement in the SNR as compared to IR-LS methods, demonstrating the advantage of NLS acquisition methods.
A limitation of this study is that 1H MRSI studies can also include artifacts caused by subject motion, which will be increased with NLS acquisition and may not be distinguishable from lipid ringing artifacts.
Acknowledgements
No acknowledgement found.References
1. Bilgic B, Chatnuntawech I, Fan AP, Setsompop K, Cauley SF, Wald LL, Adalsteinsson E. Fast image reconstruction with L2-regularization. Journal of magnetic resonance imaging : JMRI 2014;40(1):181-191.
2. Bilgic B, Gagoski B, Kok T, Adalsteinsson E. Lipid suppression in CSI with spatial priors and highly undersampled peripheral k-space. Magn Reson Med 2013;69(6):1501-1511.
3. Haupt CI, Schuff N, Weiner MW, Maudsley AA. Removal of lipid artifacts in 1H spectroscopic imaging by data extrapolation. Magn Reson Med 1996;35(5):678-687.
Figures