5524
Multi-region Semi-Adiabatic Spectral-Spatial Spectroscopic Imaging (SASSI) sequence for accelerated MRSI at 7T1Translational and Molecular Imaging Institute, Icahn School of Medicine at Mount Sinai, New York, NY, United States
Synopsis
High field MRI permits us to leverage increased signal-to-noise ratio (SNR) and spectral separation between metabolite peaks for more sensitive metabolite detection at higher spatial resolutions. However, the acquisition of high-resolution spectral grids can be prohibitively time intensive. Accelerated MRSI acquisitions are challenged by the limitations at 7T. We develop a multi-region SPSP excitation pulse and use it to create a novel low power, B1 insensitive multi-region SASSI sequence with minimal chemical shift to enable accelerated MRSI.
Introduction
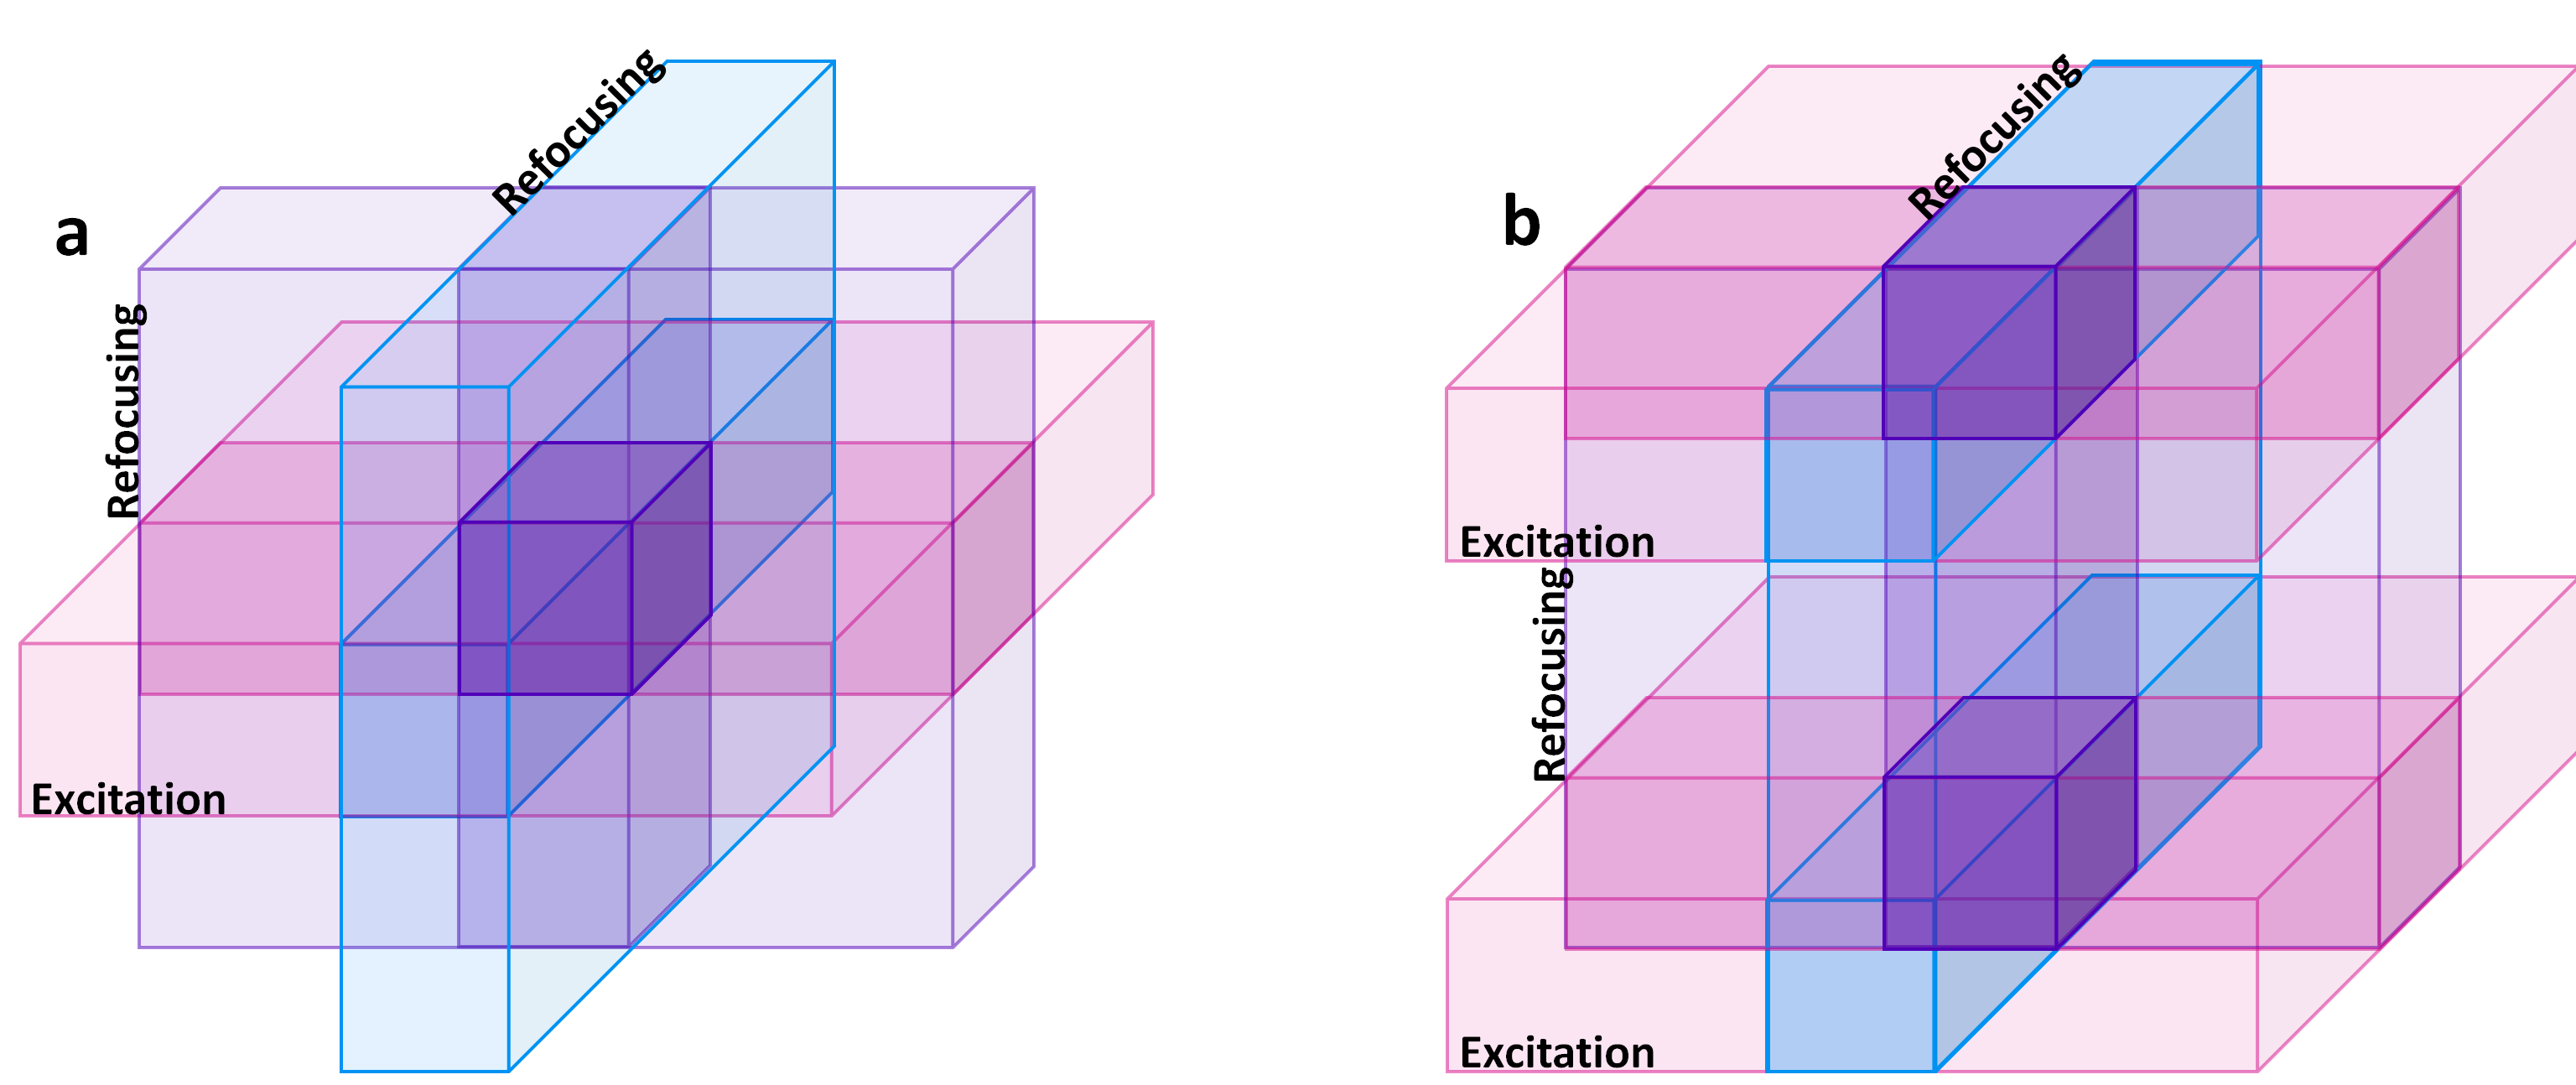
Magnetic resonance spectroscopic imaging (MRSI) may be used to non-invasively measure spatially varying metabolite concentrations in vivo. High fields such as 7 Tesla (7T) permit us to leverage increased signal-to-noise ratio (SNR) and spectral separation between metabolite peaks for more sensitive metabolite detection at higher spatial resolutions. However, the acquisition of high-resolution spectral grids can be prohibitively time intensive. The recent development of techniques aimed at accelerating MRSI acquisitions1,2 remain challenged by the limitations at 7T, namely chemical shift (CS) artifacts, power (SAR) limits, and B1 inhomogeneity. The semi-adiabatic spectral spatial spectroscopic imaging (SASSI) sequence3 uses a spectral-spatial (SPSP) excitation pulse and two adiabatic SPSP refocusing pulses to overcome B1 inhomogeneity, CS artifacts, and SAR limits to excite a volume of interest (VOI) for 7T MRSI. In this work, we develop a multi-region SPSP excitation pulse and use it to create a novel multi-region SASSI sequence to enable accelerated MRSI. Phantom results demonstrate effective multi-region spectroscopic grid acquisitions at 7T.Methods
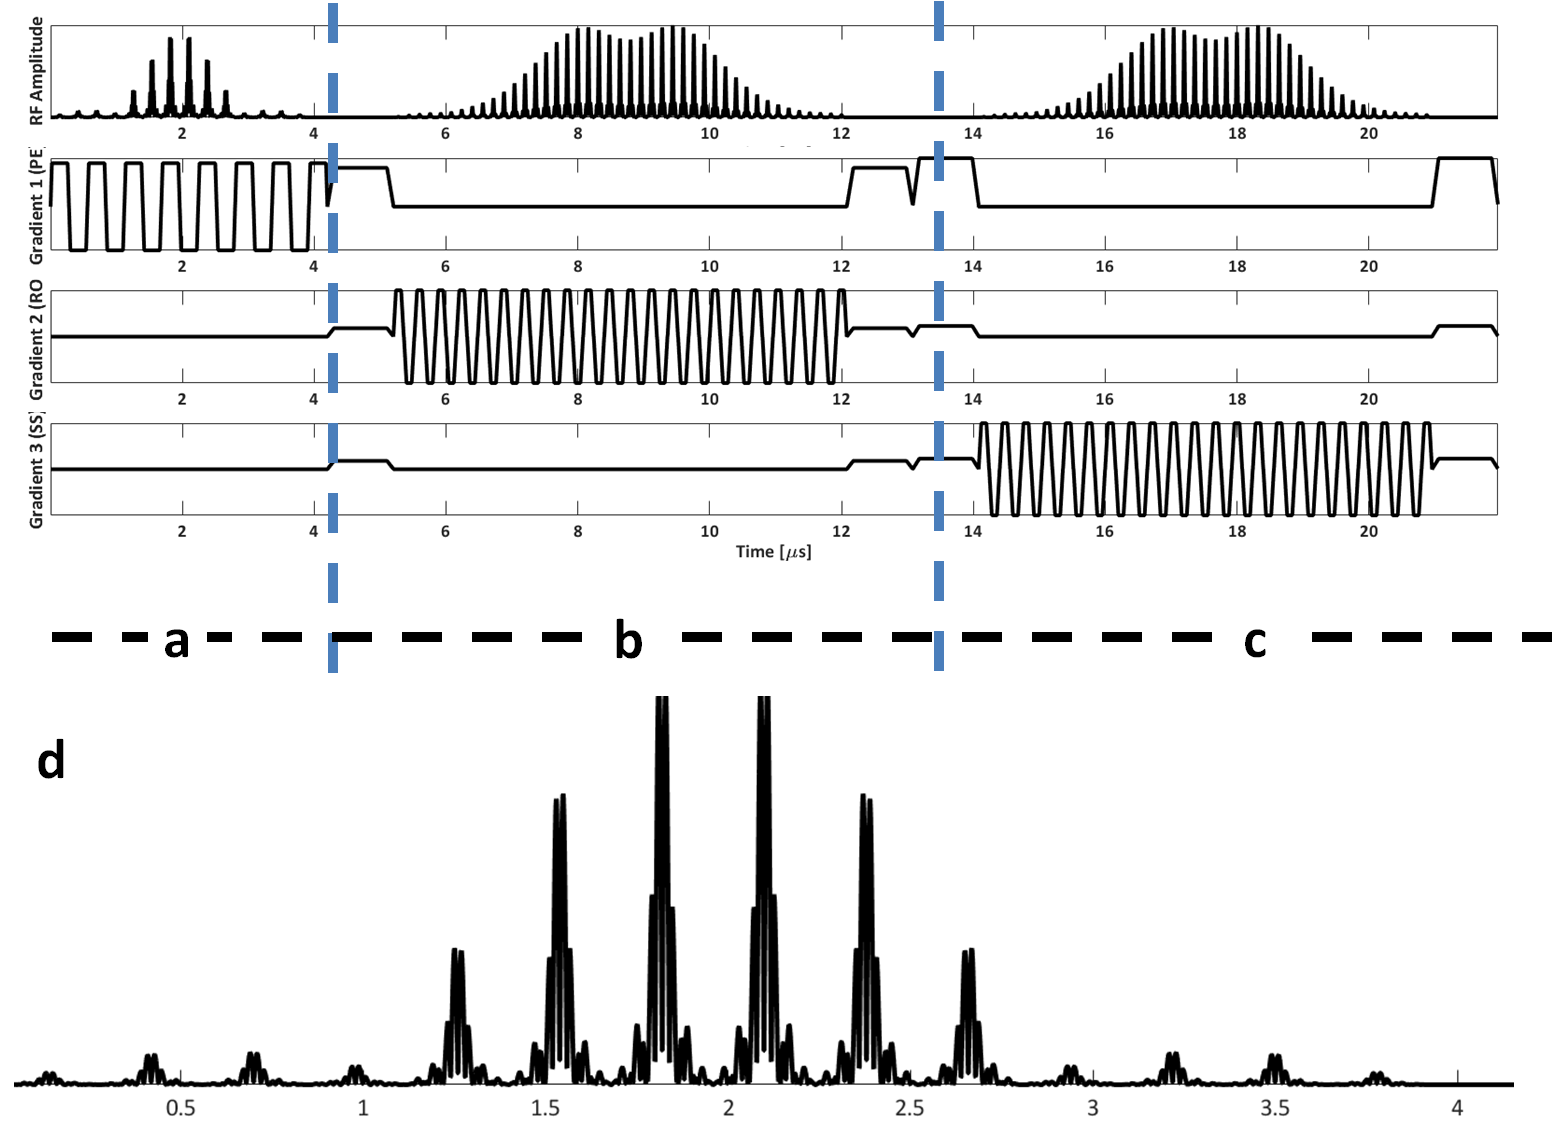
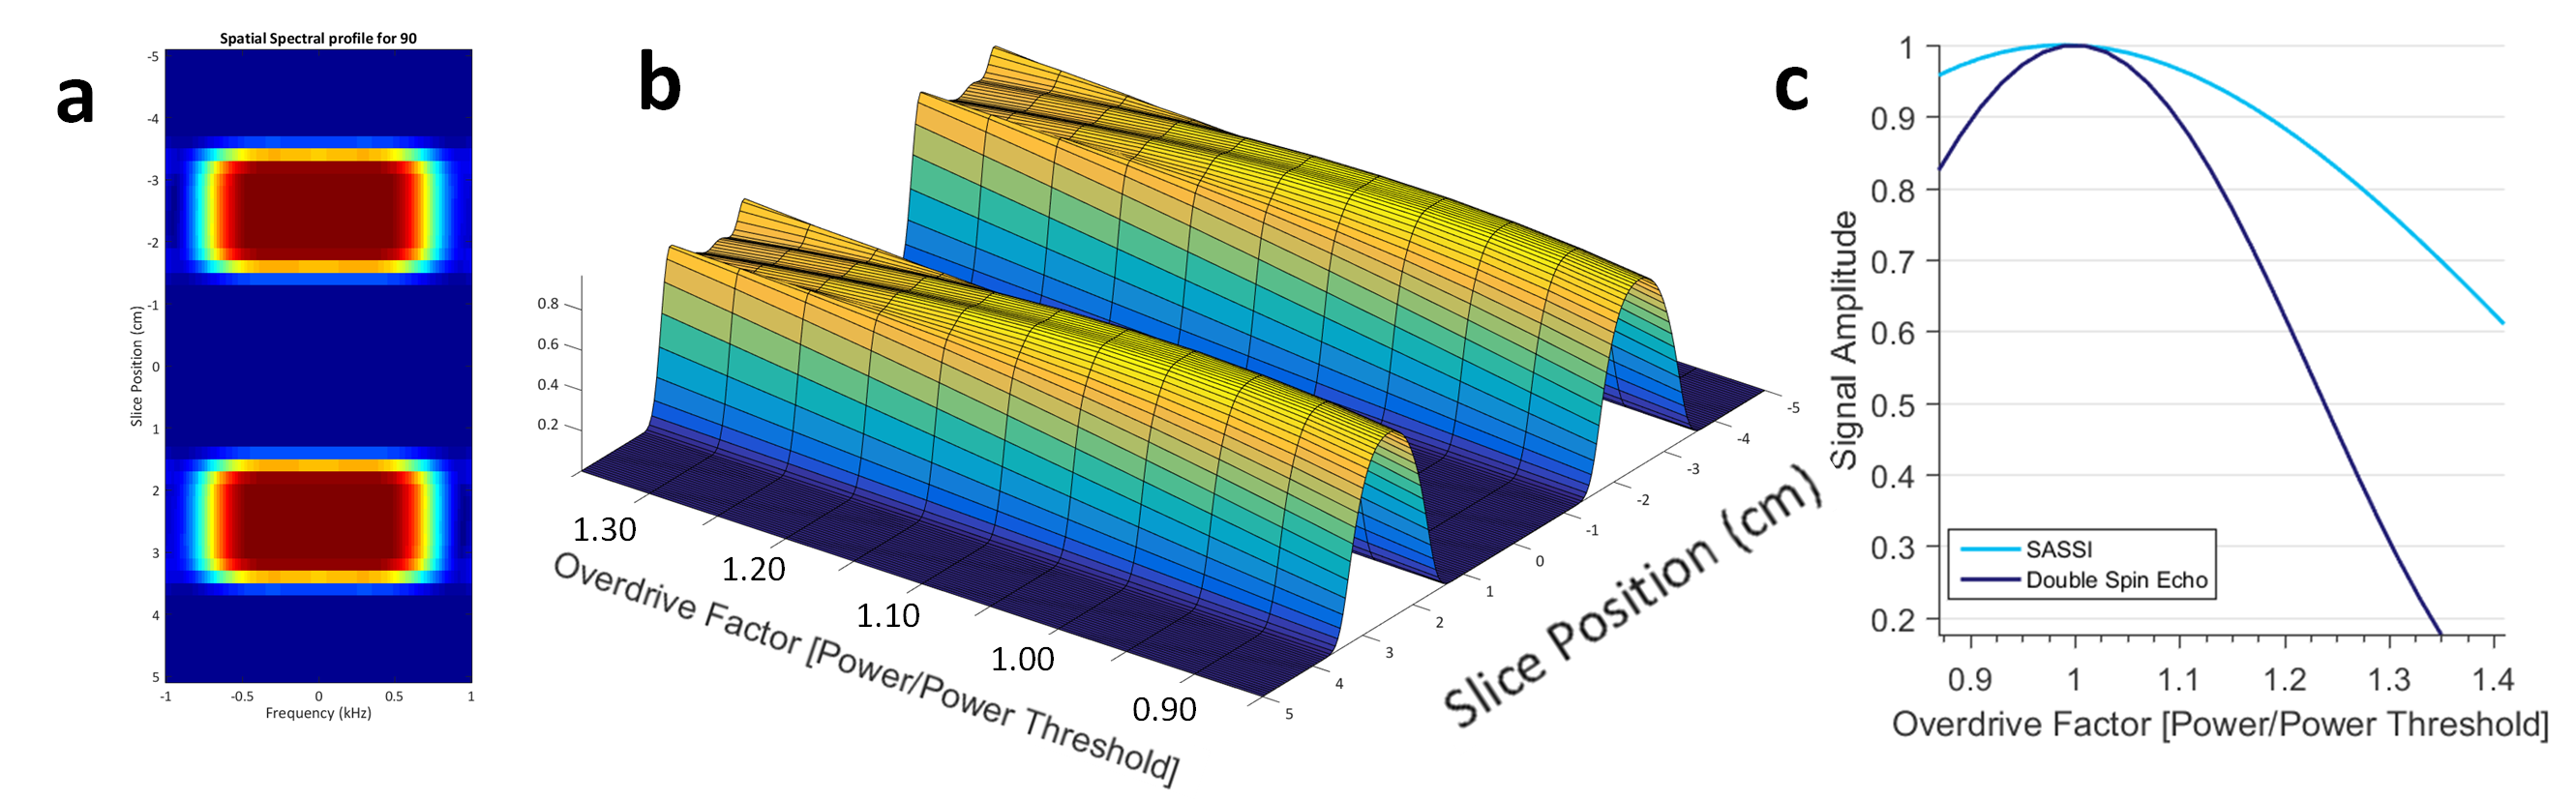
We used the adiabatic SLR algorithm4 to create a SASSI refocusing pulse and designed a non-adiabatic SPSP excitation pulse of matching bandwidth (BW). The excitation pulse had BW= 1.20 kHz and t=4.2 ms. The refocusing pulse had BW=1.12 kHz and a t=7 ms. Figure 1 shows the RF and gradient waveforms for the multi-region SASSI pulse sequence. A multi-band excitation pulse was created by designing individual pulses for each spatial location and combining them with phased complex addition. Figure 3 is a simulation of the signal with the modified excitation pulse is shown in along with a simulation of the sensitivity of the spatial profile to a range of B1 values to determine sensitivity to B1 inhomogeneity. Scans were performed on a spherical MRS phantom using a 7T whole body magnet (Siemens) and a 32-channel receive head coil. To acquire the spectral grids and metabolite maps, the pulse sequence parameters were: spectral shift=-2.82 ppm, TE=42 ms, TR=1000 ms, time=20 minutes. For SAR comparison, spectra were acquired in a phantom using multi-region SASSI and a standard single-VOI Semi-LASER (sLASER)6. SAR in the phantom was recorded for each acquisition relative to sLASER for a long TR, low-resolution scan chosen in order to reach the upper limit of SAR in the sLASER sequence. The pulse sequence parameters for both sLASER and SASSI for the SAR comparison were: spectral shift=-2.82 ppm, TE=42 ms, TR=2530 ms, time=30 minutes. Metabolite fitting and integration under peaks was performed using LCMODEL7 to obtain concentrations of myo-inositol (MI), N-acetyl aspartate (NAA), Choline (Cho), and Creatine (Cr).Results
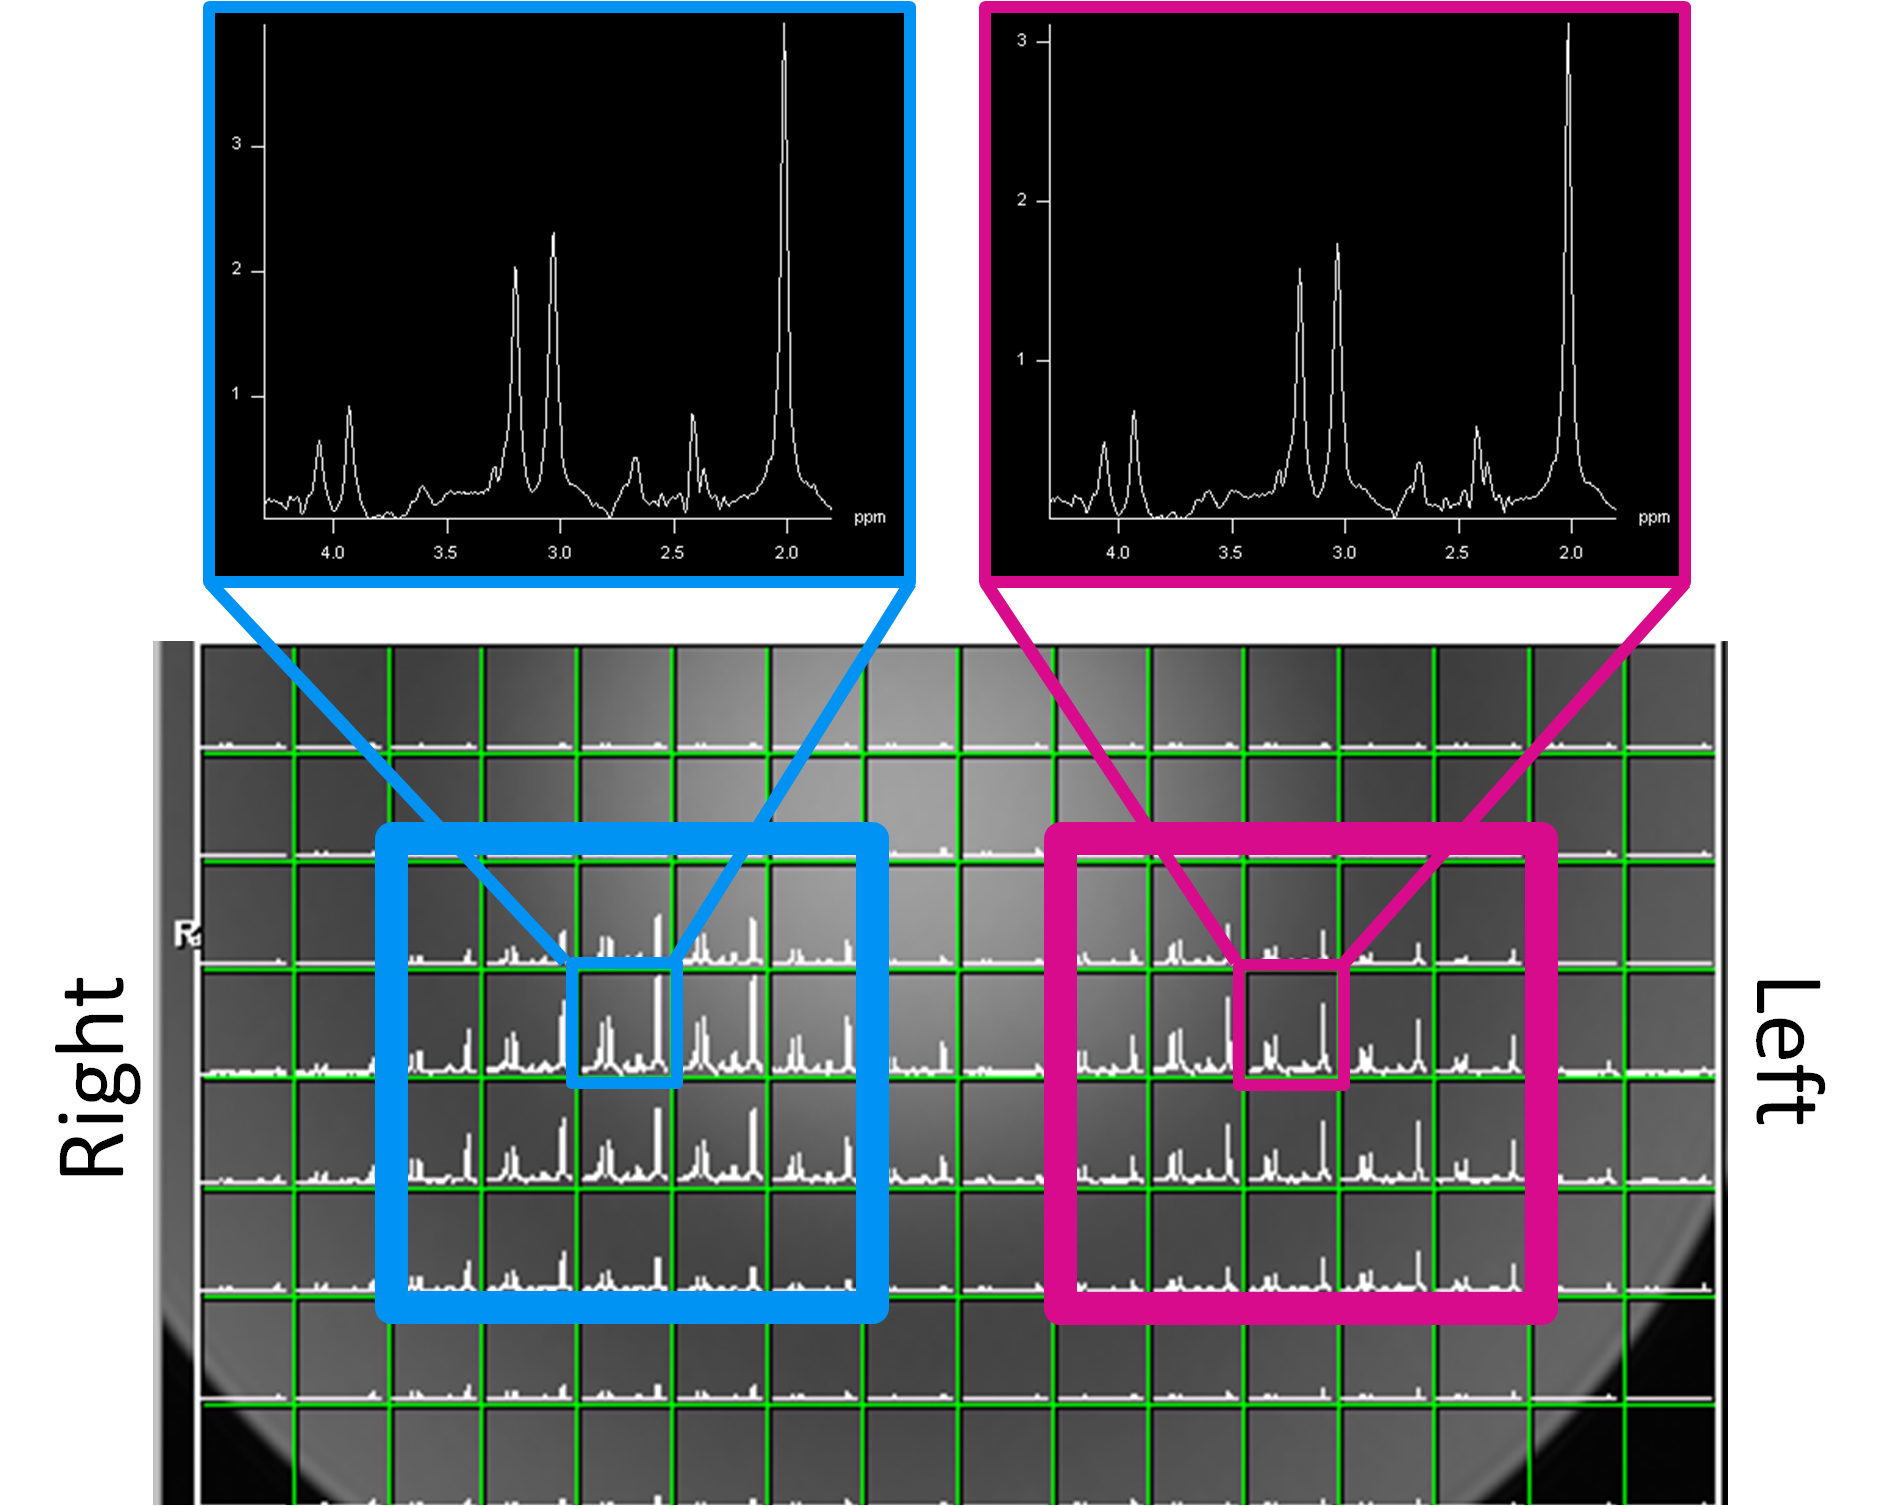
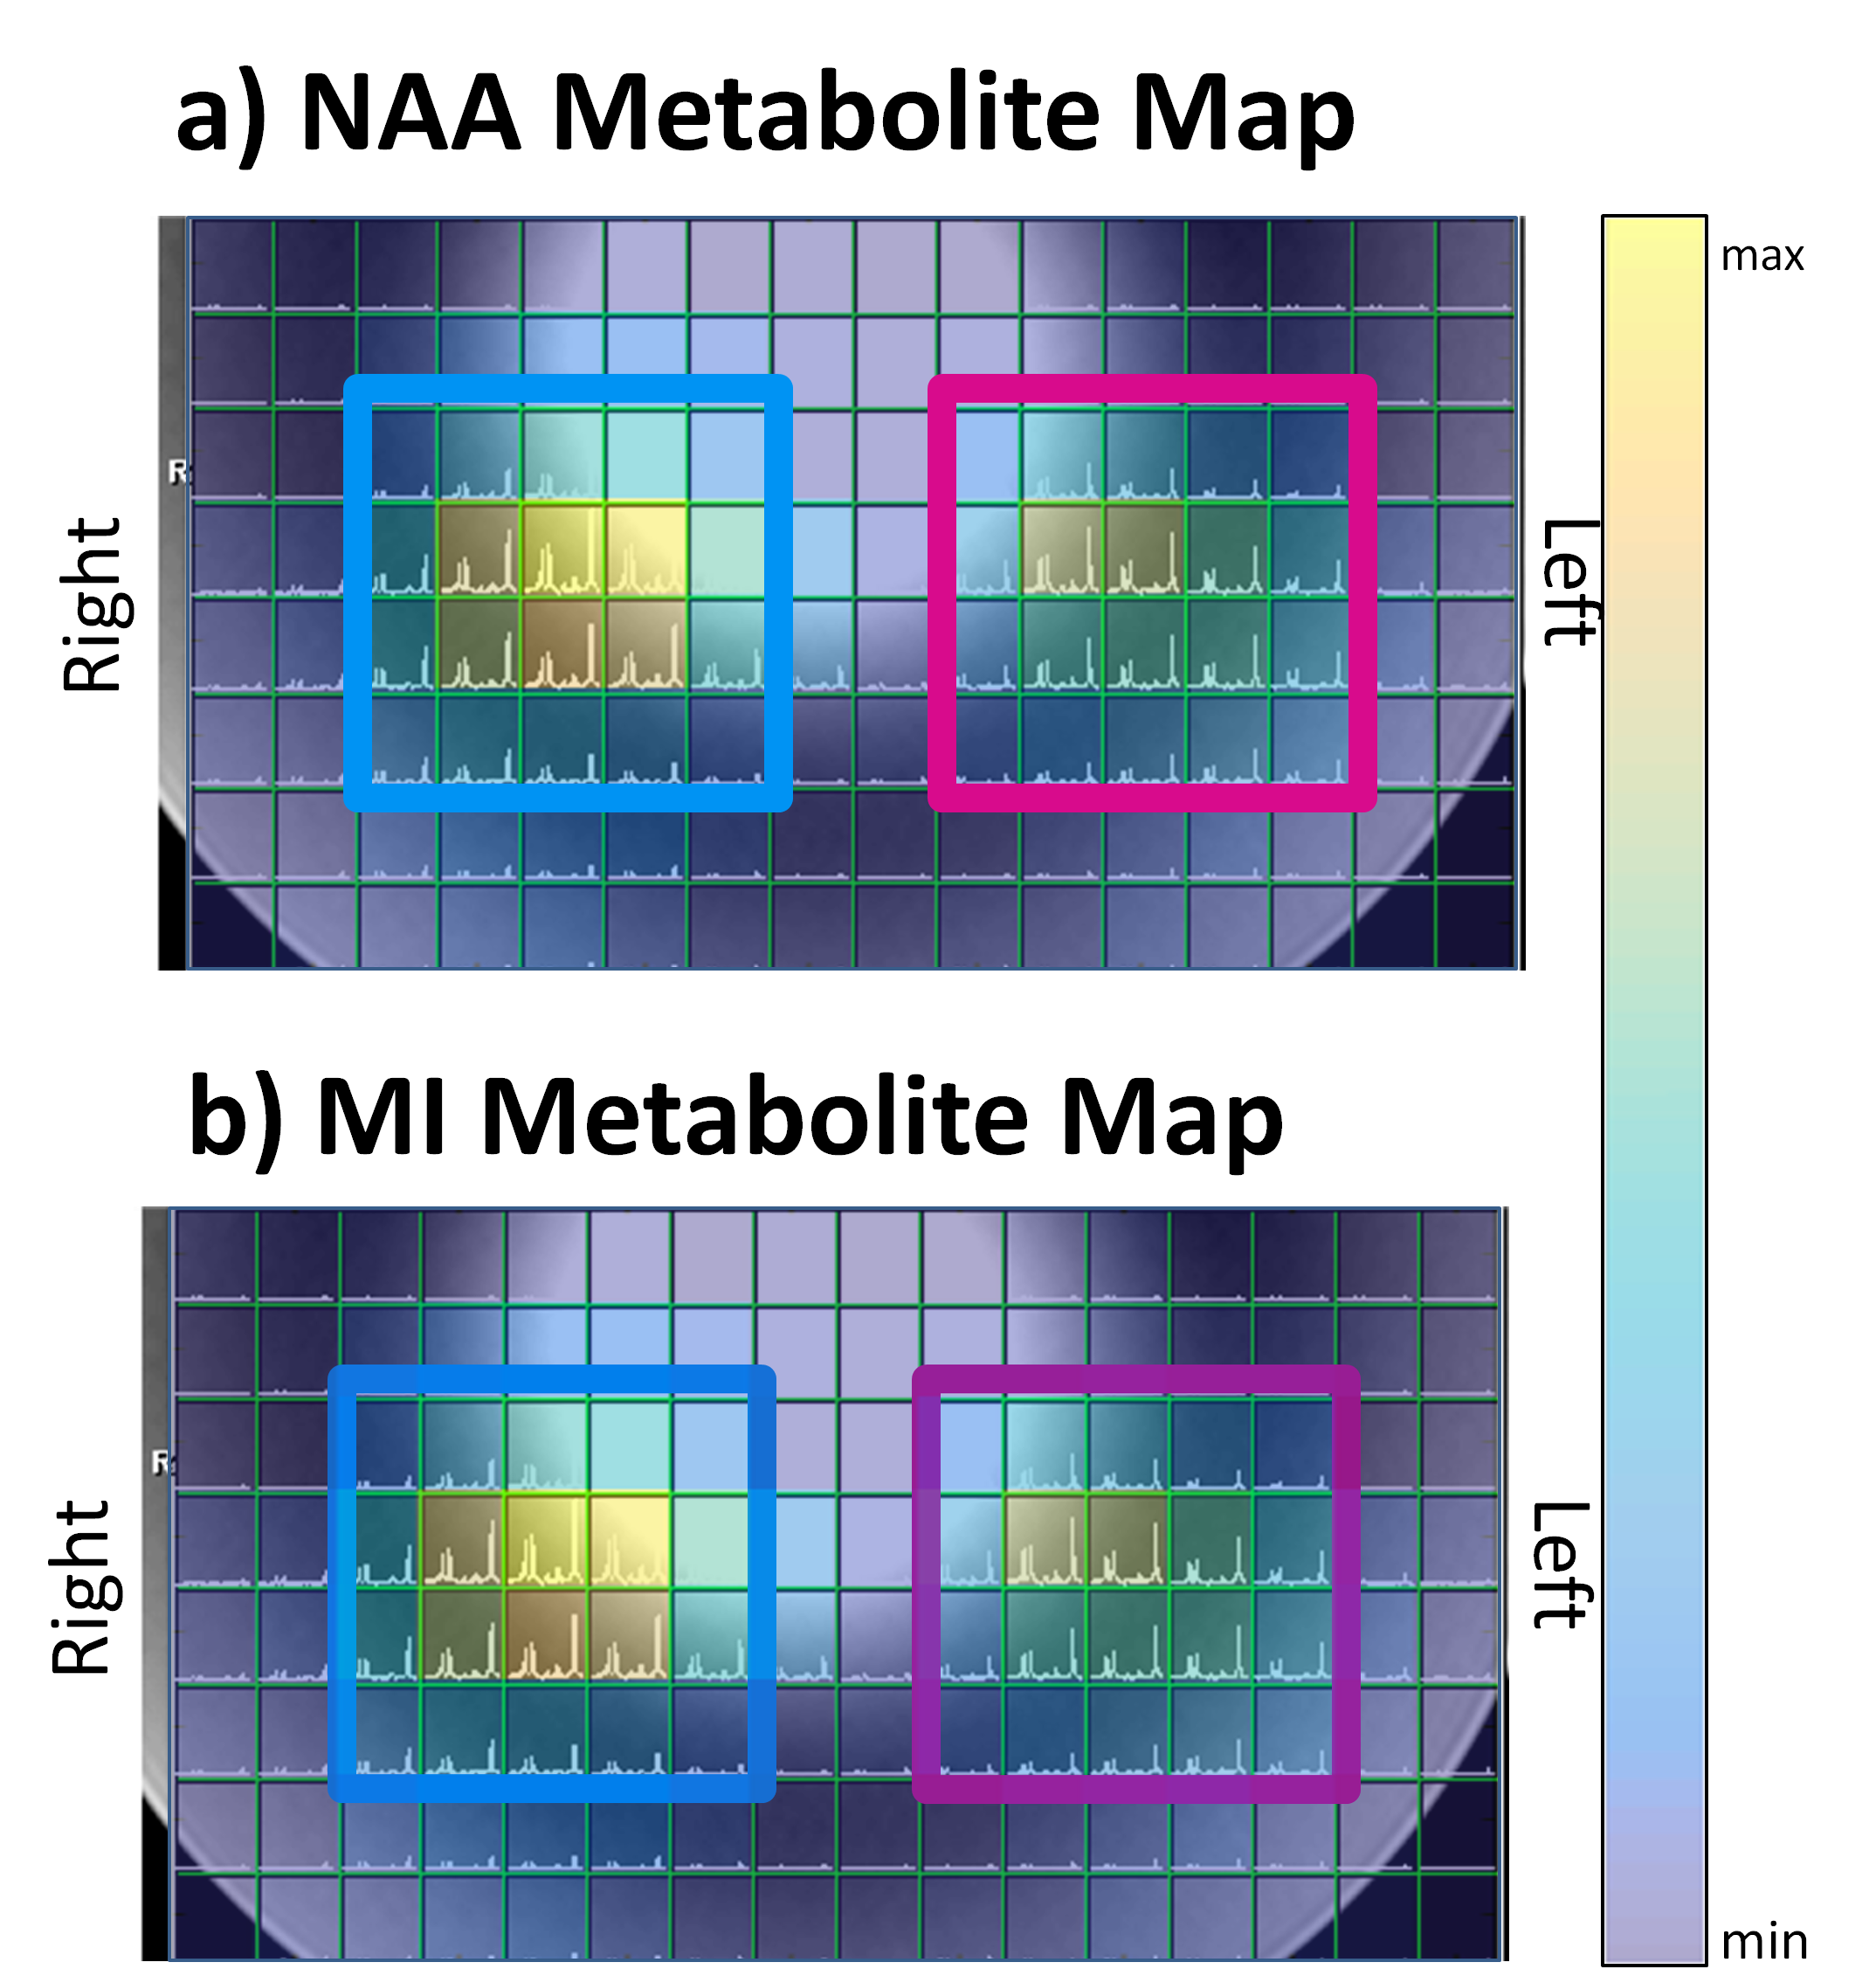
The simulation of the SPSP profile of the multi-region SASSI excitation (Figure 3) shows two clear excitation planes. While a conventional, dual spin echo pulse would see a 50% loss in signal over a 24% change in B1; the loss in signal for multi-region SASSI for that same B1 change is 8%. SAR relative to the sLASER sequence (at 100%) was 36% for the multi-region SASSI. On the right region, the ratio of NAA/Cr was 1.42. On the left, the ratio of NAA/Cr was 1.45. The metabolite maps of NAA, Cho, and Cr, acquired in cross-section to highlight the two regions, are shown in Figure 5. Chemical shift in the ROI was not detectable.Discussion
Creating an excitation pulse capable of exciting two slices simultaneously resulted in a SPSP excitation pulse with higher peak power and higher overall SAR than a single region excitation pulse. However, in the SASSI sequence, the non-adiabatic excitation contributes significantly less power than either of the adiabatic refocusing pulses, and therefore has some room for amplification. A similar modification of the spatial sub-lobes could be applied to either of the adiabatic pulses. However, the resulting sequence would deposit higher SAR without an increase in B1 insensitivity. The proposed multi-region SASSI is significantly less SAR intensive than other adiabatic MRSI sequences such as sLASER, making it a suitable candidate for augmentation into a simultaneous multi-region acquisition.Conclusion
We designed and implemented a low-SAR semi-adiabatic MRSI sequence capable of exciting multiple regions. The sequence retains the B1-insensitive volume selection and low chemical shift of SASSI while creating two spatially separated volumes of interest that could be acquired at the same time. Future work will combine this multi-region spectral excitation with parallel imaging and reconstruction techniques to simultaneously excite and disentangle multiple regions. This will provide an accelerated MRSI sequence with higher B1-insensitivity and reduced SAR, thereby providing a powerful alternative for high-resolution spectroscopic acquisition to measure and detect metabolic alterations associated with many diseases and disorders7,8,9,10.Acknowledgements
NIH R01 MH109544; Icahn School of Medicine Capital Campaign, Translational and Molecular Imaging Institute and Department of Radiology, Icahn School of Medicine at Mount SinaiReferences
[1] Strasser B, Považan M, Hangel G, Hingerl L, Chmelik M, Gruber S, Trattnig S, Bogner W. (2 + 1)D-CAIPIRINHA accelerated MR spectroscopic imaging of the brain at 7T. Magn Reson Med. 2016 Aug 22.
[2] Chatnuntawech I, Gagoski B, Bilgic B, Cauley SF, Setsompop K, Adalsteinsson E. Accelerated 1 H MRSI using randomly undersampled spiral-based k-space trajectories. Magn Reson Med. 2014 Jul 30.
[3] Feldman RE, Balchandani P. A semiadiabatic spectral-spatial spectroscopic imaging (SASSI) sequence for improved high-field MR spectroscopic imaging. Magn Reson Med. 2016 Oct;76(4):1071-82.
[4] Balchandani P, Pauly J, Spielman D. Designing adiabatic radio frequency pulses using the Shinnar-Le Roux algorithm. Magn Reson Med. 2010 Sep;64(3):843-51. doi: 10.1002/mrm.22473.
[5] Scheenen TW, Klomp DW, Wijnen JP, Heerschap A. Short echo time 1H-MRSI of the human brain at 3T with minimal chemical shift displacement errors using adiabatic refocusing pulses. Magn Reson Med. 2008 Jan;59(1):1-6.
[6] Provencher SW. Estimation of metabolite concentrations from localized in vivo proton NMR spectra. Magn Reson Med. 1993 Dec;30(6):672-9.
[7] Wijtenburg SA, Yang S, Fischer BA, Rowland LM. In vivo assessment of neurotransmitters and modulators with magnetic resonance spectroscopy: Application to schizophrenia. Neurosci Biobehav Rev 2015;51:276-295.
[8] Wilson M, Gill SK, MacPherson L, English M, Arvanitis TN, Peet AC. Noninvasive detection of glutamate predicts survival in pediatric medulloblastoma. Clin Cancer Res;20(17):4532-4539.
[9] Delorme S, Weber MA. Applications of MRS in the evaluation of focal malignant brain lesions. Cancer Imaging 2006;6:95-99.
[10] Wijnen JP, Idema AJ, Stawicki M, Lagemaat MW, Wesseling P, Wright AJ, Scheenen TW, Heerschap A. Quantitative short echo time 1H MRSI of the peripheral edematous region of human brain tumors in the differentiation between glioblastoma, metastasis, and meningioma. J Magn Reson Imaging 2012;36(5):1072-1082.
Figures