5523
Full-field of view GM and WM spectroscopy in vivo using spatial lipid pattern estimation and BASE-SLIM localization1Hoglund Brain Imaging Center, University of Kansas Medical Center, Kansas City, KS, United States, 2Department of Molecular & Integrative Physiology, University of Kansas Medical Center, 3Department of Neurology, University of Kansas Medical Center
Synopsis
The presence lipids of several orders of magnitude higher concentrations than metabolites in the extracranial tissues present significant challenges for the reliable acquisition and quantification of 1H MRSI, especially in the outer perimeter areas of the brain. We developed a novel spatial lipid reconstruction technique to remove nuisance lipid signals in 1H MRS. We applied lipid reconstruction to MRSI data and performed BASE-SLIM localization on the lipid-subtracted signal. Using this method, high quality compartment spectra of GM and WM could be obtained.
Introduction
Gray (GM) and white matter (WM) in the human brain are known to have different metabolic processes in health and disease, resulting in significantly different spectral patterns and metabolite concentrations as measured by 1H MRS. However, reliable 1H MRS measurement of GM or WM is quite challenging due to their highly convoluted geometry and the proximity of cortical GM to the subcutaneous lipids, whose signals are two orders of magnitude higher than those of brain metabolites. The volume of interest (VOI) in 1H MRSI is often significantly reduced using outer volume suppression (OVS) or localization pulses to prevent problematic interference by strong subcutaneous lipid signals, resulting in loss of most of cortical GM. Alternative approaches to reduce the lipid signals using inversion recovery face other drawbacks such as loss of SNR and unwanted spectral distortion. BASE-SLIM [1-2], an advanced form of Spectral Localization by Imaging (SLIM) [3], promises reliable measurement and quantification of 1H MRS signals in GM and WM by incorporating GM and WM structure information in the spatial reconstruction. Many methods have been proposed to reduce the nuisance lipid signals in truncated MRSI k-space acquisitions [4-9]. However the successful quantification of metabolites through non-lipid suppressed MRSI has been rarely demonstrated. In this study, we propose a new spatial-domain lipid extraction technique in combination with BASE-SLIM to reconstruct GM and WM spectra from full-field of view (FOV) MRSI data, which removes the nuisance outer lipid signals.Theory
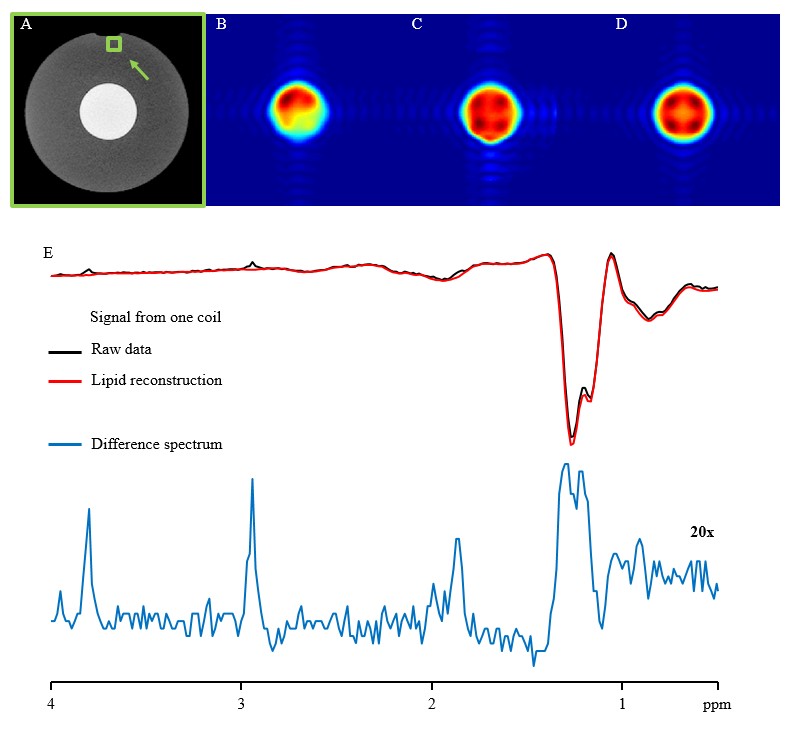
In a high spatial resolution domain, imaged subcutaneous lipid signals in MRSI data are both band-limited and spatially restricted at the source, therefore they can be expressed by a set of point spread functions numbering much less than the number of image pixels and potentially less than the number of independent acquired data. A matrix model can be expressed as, $$${ P_{psf} \; C_{lipid} = S_{field} \;\;\;\; [1] }$$$ where $$${P_{psf}}$$$ is the point spread function matrix, $$${S_{field}}$$$ the measured signal vector over a field of interest, and $$${C_{lipid}}$$$ the source lipid signal vector. Eq. 1 is solved for each chemical shift point and receiver coil and the reconstructed lipid signals are then subtracted from the raw MRSI data.Methods
Three healthy subjects were studied. All scans were performed on a 3 T (Skyra, Siemens) scanner with a 16 channel head receive coil. The 1H CSI was acquired using a semi-LASER sequence 4 (TE/TR=35/1600ms, matrix=16x16, FOV=20cm) with the slab positioned across the prefrontal to parietal lobes. B0 and coil sensitivity (B1) maps were acquired using gradient echo sequences (TE=4.92/7.38ms for B0, TE=2.07ms for B1). The subcutaneous lipid signal pattern was estimated and reconstructed as a lipid-only CSI signal data set, then subtracted from the raw CSI data for 16 channels. BASE-SLIM reconstruction was performed using the CSI k-space data, B0 and B1 maps, and high resolution GM and WM segmentation masks. Coil combination of each 1H MR spectrum from 16 channels was performed to maximize SNR with a maximal ratio combining scheme using the signal and noise spectral power estimates. Metabolite concentrations were quantified using LCModel3 and non-suppressed water scan as a concentration reference.Results and Discussion
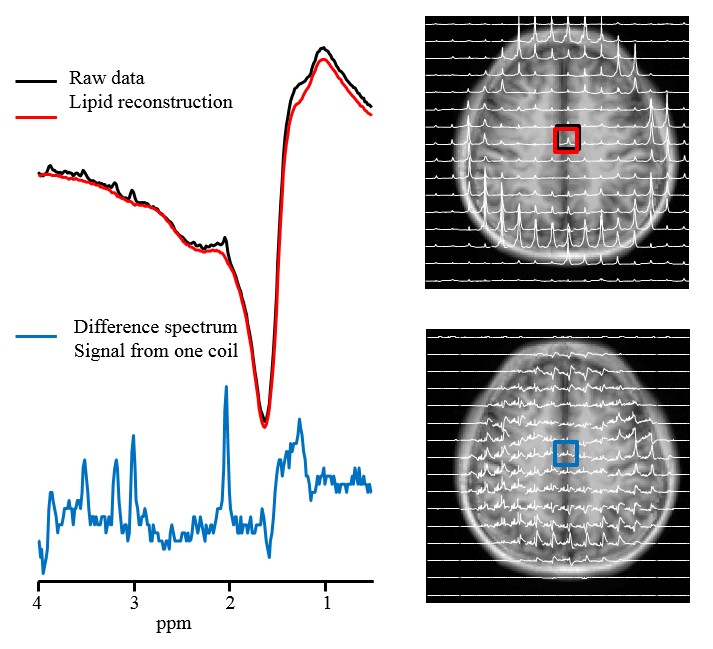
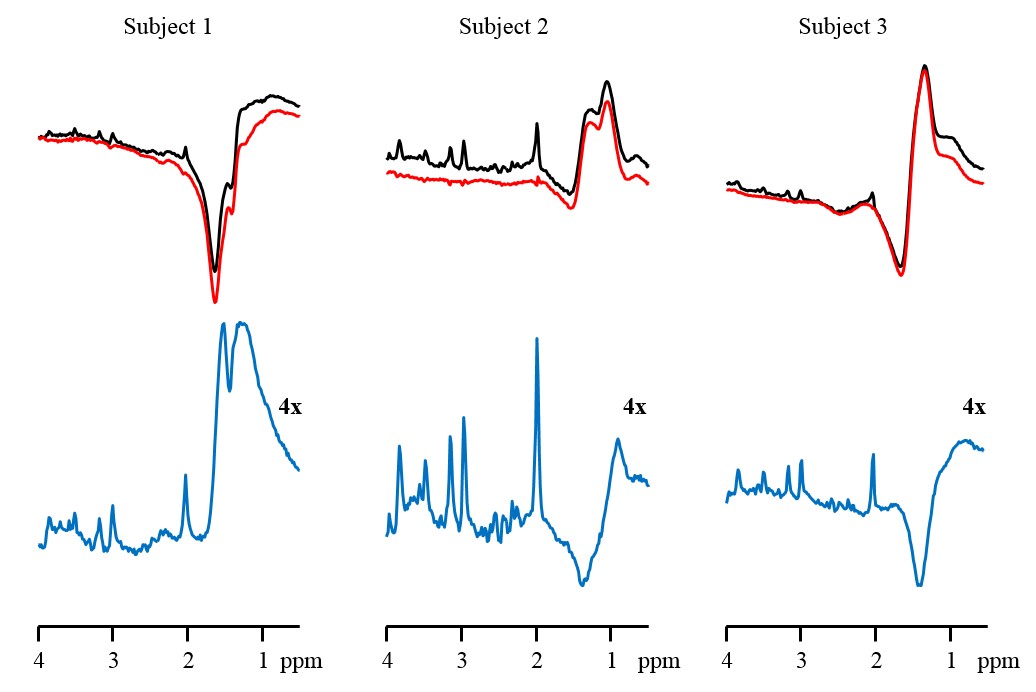
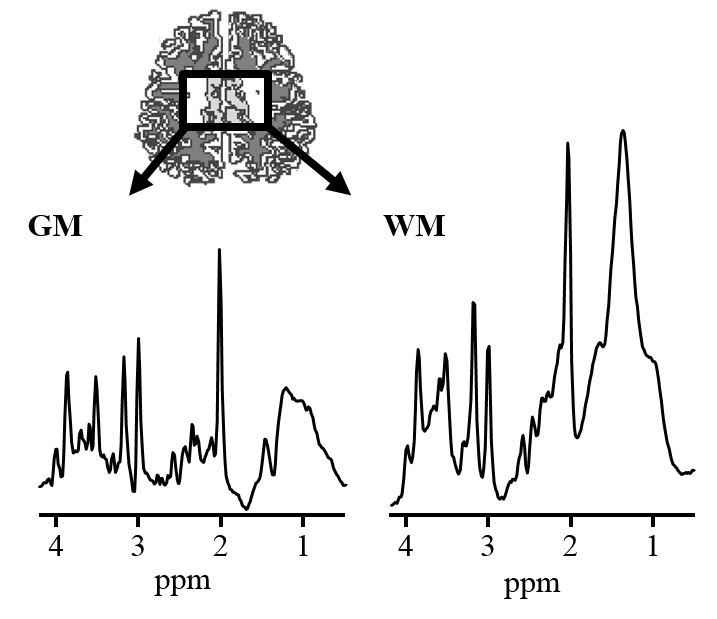
Effective estimation and removal of intense lipid signals originating from the inner compartment was demonstrated in the phantom experiment (Fig. 1). The successful removal of lipid signal was demonstrated in a human subject in vivo (Fig. 2.). The lipid removal processing was applied for 3 subjects, with sample CSI voxels shown (Fig. 3.). Finally, BASE-SLIM reconstruction was successfully performed using full-FOV MRSI data to obtain 1H MR spectra from GM and WM in the human brain (Fig. 4), using a novel lipid signal extraction technique. The lipid signal was reduced by approximately 97 % in the brain area prior to reconstruction of GM and WM compartment spectra using BASE-SLIM. Distinct expected spectral patterns of GM and WM were observed in all three subjects. Our novel spatial lipid reconstruction technique allowed us to remove nuisance lipid signals in 1H MRSI. This technique promises to allow full coverage of the brain in MRSI acquisition while minimizing SNR tradeoffs. By subtracting a reconstructed lipid signal from MRSI data prior to BASE-SLIM localization that corrects for B0 and B1 errors, high quality spectra of GM and WM could be obtained with good reliability.Acknowledgements
The Hoglund Brain Imaging Center is supported by the NIH (S10RR029577) and the Hoglund Family Foundation.References
1. Adany et al., PISMRM
4720 (2015).
2. Adany et al.,
NeuroImage 134:355-364 (2016).
3. Hu X. et al., Magn
Reson Med, 8: 314–322 (1988) .
4. Papoulis, IEEE
Trans. Circ. Sys. 19:735-742 (1975).
5. Plevritis et al.
IEEE Trans. Med. Im. 1995.
6. Patel et al. IEEE
Trans. Med. Im. 1993.
7. Bhattacharya et al.,
PISMRM 0384 (2016).
8. Ning et al., PISMRM
2361 (2016).
9. Hangel et al., PISMRM
2354 (2016).
10. Scheenen T. W. et
al., Magn Reson Med, 59:1 (2008) .
Figures