5522
Metabolite-Cycling Short-Echo Time Magnetic Resonance Spectroscopic Imaging using a Concentric Ring k-space Trajectory1Oxford Centre for Functional MRI of the Brain (FMRIB), University of Oxford, Oxford, United Kingdom, 2Department of Oncology, University of Oxford, Oxford, United Kingdom, 3Department of Radiological Sciences, University of California, Los Angeles, CA, United States
Synopsis
In this study, the feasibility of acquiring and quantifying short-echo (TE = 14 ms), two-dimensional (2D) STEAM MRSI spectra from the motor cortex was demonstrated by utilizing a non-water-suppressed metabolite-cycling technique. The increase in measurement time by the metabolite-cycling is counterbalanced by a time-efficient concentric ring k-space trajectory. High quality spectra were acquired from 36 localized 2mL voxels in 8 minutes. The metabolite spectra and estimated concentrations were in agreement between non-water-suppressed and water-suppressed MRSI techniques. Findings of this study demonstrate that a non-water-suppressed metabolite-cycling MRSI technique can perform robustly on clinical MRI scanners and within a clinically feasible acquisition time.
Introduction
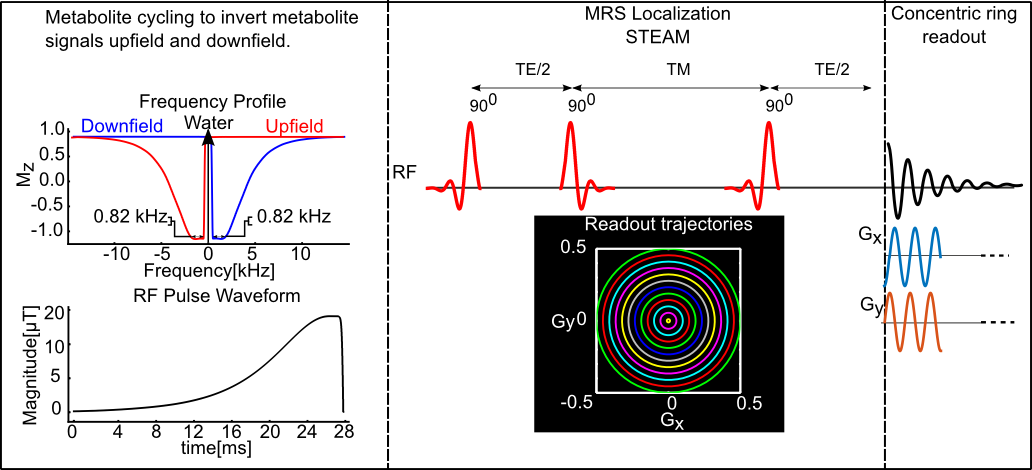
Water-suppressed MRS acquisition techniques have been the standard approach used in research and clinical MRI scanners to date. The acquisition of a non-water-suppressed spectrum is used for artifact correction, reconstruction of phased-array coil data, and metabolite quantification. The intent of this work is to develop a non-water-suppressed MRSI acquisition technique. To achieve this, a non-water-suppressed metabolite-cycling (1) two-dimensional (2D) MRSI acquisition technique is developed for simultaneous detection of the metabolite and water signal at a short echo time (TE = 14 ms) using stimulated echo acquisition mode (STEAM) localization. The doubling of the measurement time caused by the doubling in the number of acquisitions required for the metabolite-cycling is counterbalanced by a time efficient concentric ring k-space trajectory (2). We compare profiles quantified from non-water-suppressed and conventionally-water-suppressed STEAM MRSI scans acquired from the motor cortex.Methods
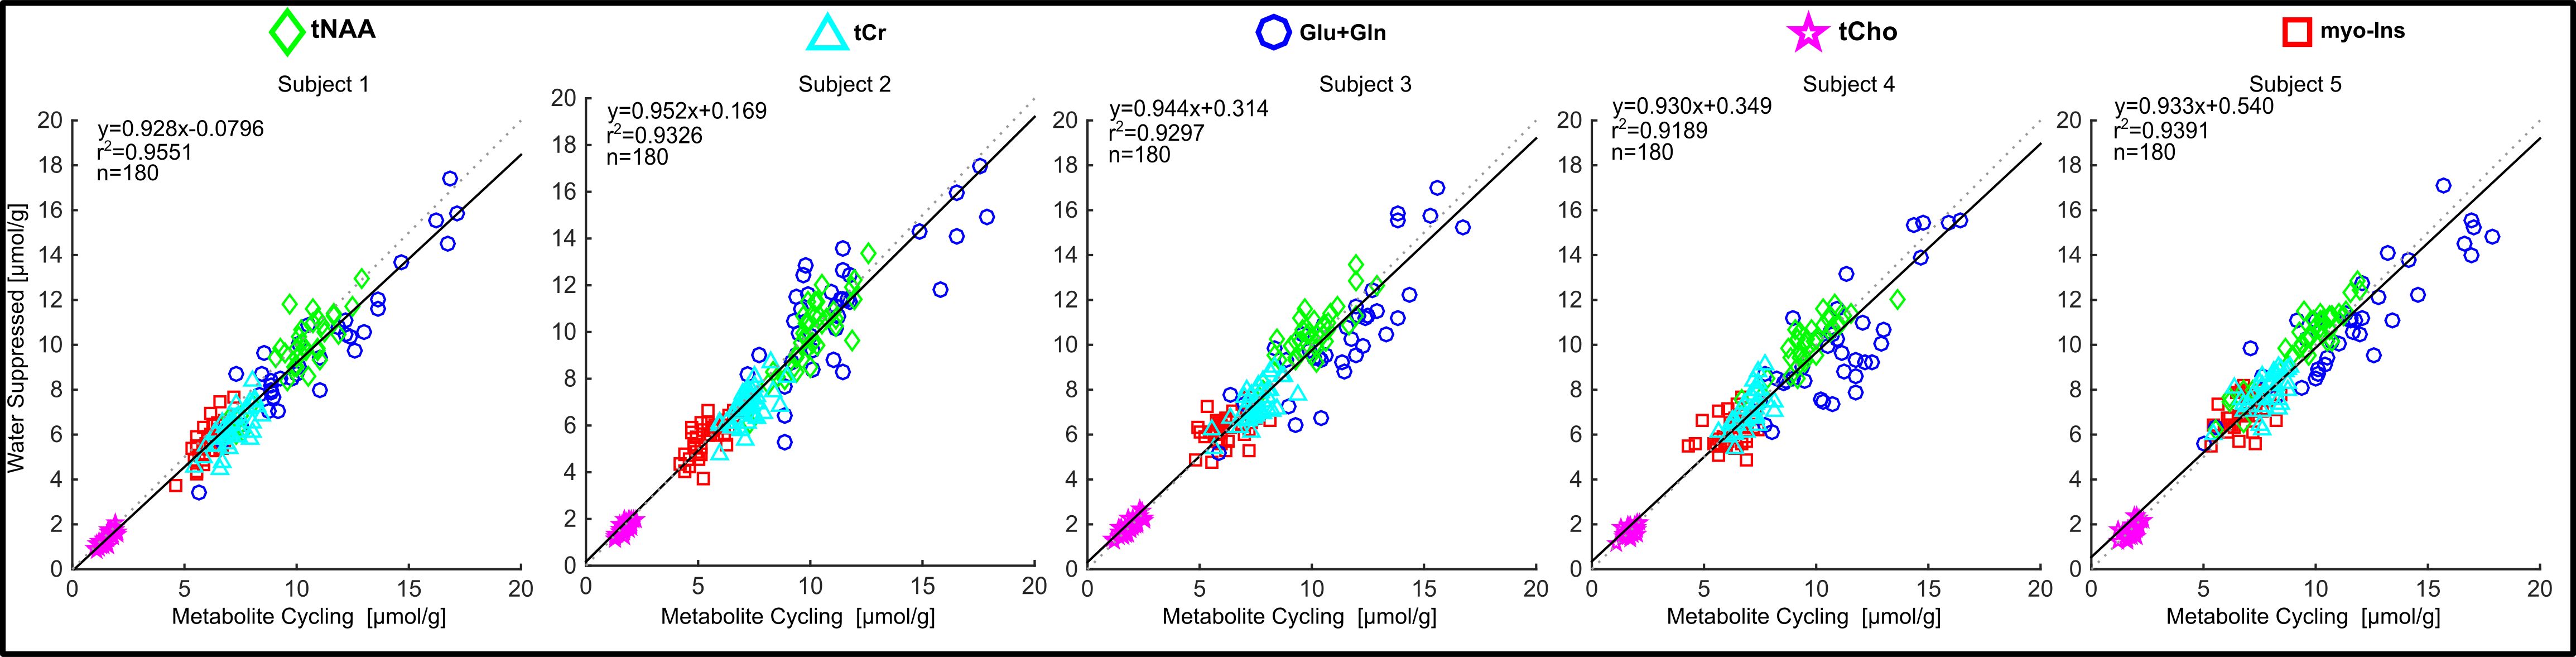
Five healthy volunteers (3 males /2 females; aged 28.8±3.4 (mean±sd) years) participated in this study after giving informed consent under an institutionally approved technical development protocol. All scans were acquired using a Siemens Prisma 3-Tesla (Siemens, Erlangen, Germany) whole body MRI scanner and a 32-channel head array receive coil. B0 shimming was achieved using GRESHIM (3). The non-water-suppressed metabolite-cycling MRSI acquisition was achieved by utilizing two asymmetric narrow-transition-band adiabatic RF pulses with mirrored inversion profiles applied in alternate scans for the inversion of the upfield and downfield (relative to water) spectral ranges before the STEAM localization with a gap of 9.6 ms. For comparison, a water-suppressed MRS acquisition was achieved by utilizing 3D outer volume suppression (OVS) and VAPOR (variable-power RF pulses with optimized relaxation delays) water suppression before the STEAM localization (4). STEAM localization (TR = 2 s, TE = 14 ms, mixing time (TM) = 32 ms, number of averages, Navg = 20) was used to excite a 65 mm x 65 mm x 20 mm region centrally within the field of view (FOV). A 2D concentric k-space trajectory was used to sample polar 2D MRSI k-space data. To cover the 24×24 grid, 12 rings (Nring = 12), resulting in an individual voxel size of 2 mL, were acquired in 8 min (Nring x Navg x TR = 480 s) with an effective spectral bandwidth of 1250 Hz (2). This corresponded to a fully excited 6 x 6 voxel region with a ½ voxel margin outside the STEAM localization. The averaged metabolite spectrum was quantified using the LCModel package (5). The residual water peak was filtered with the Hankel-Lanczos singular value decomposition (HLSVD) algorithm prior to the LCModel analysis (6). Concentrations were calculated using the unsuppressed water spectrum as an internal reference. To evaluate the discrepancy between non-water-suppressed and water-suppressed techniques and the limits of agreement, a correlation analysis was performed on those brain metabolites that had Cramer-Rao lower bounds smaller than 20% (tNAA, tCr, tCho, myo-Ins and Glu+Gln).Results
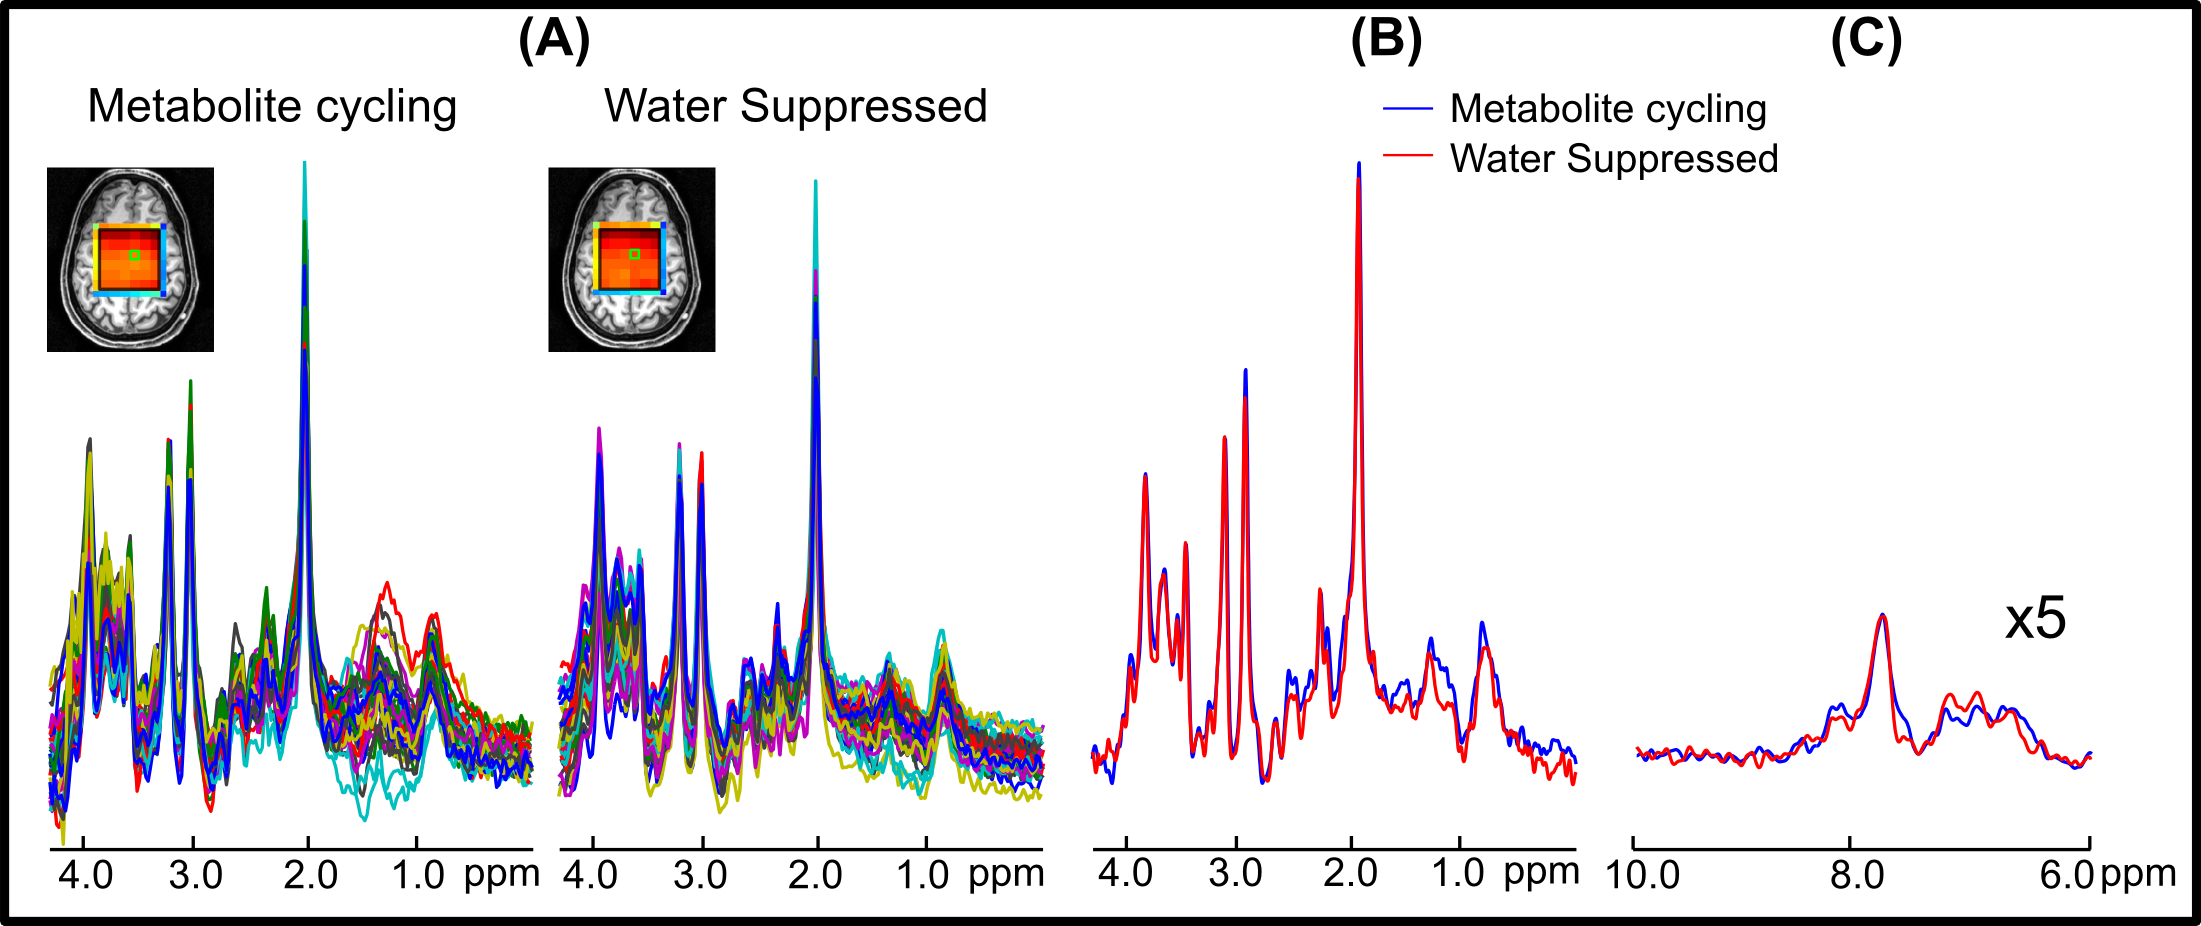
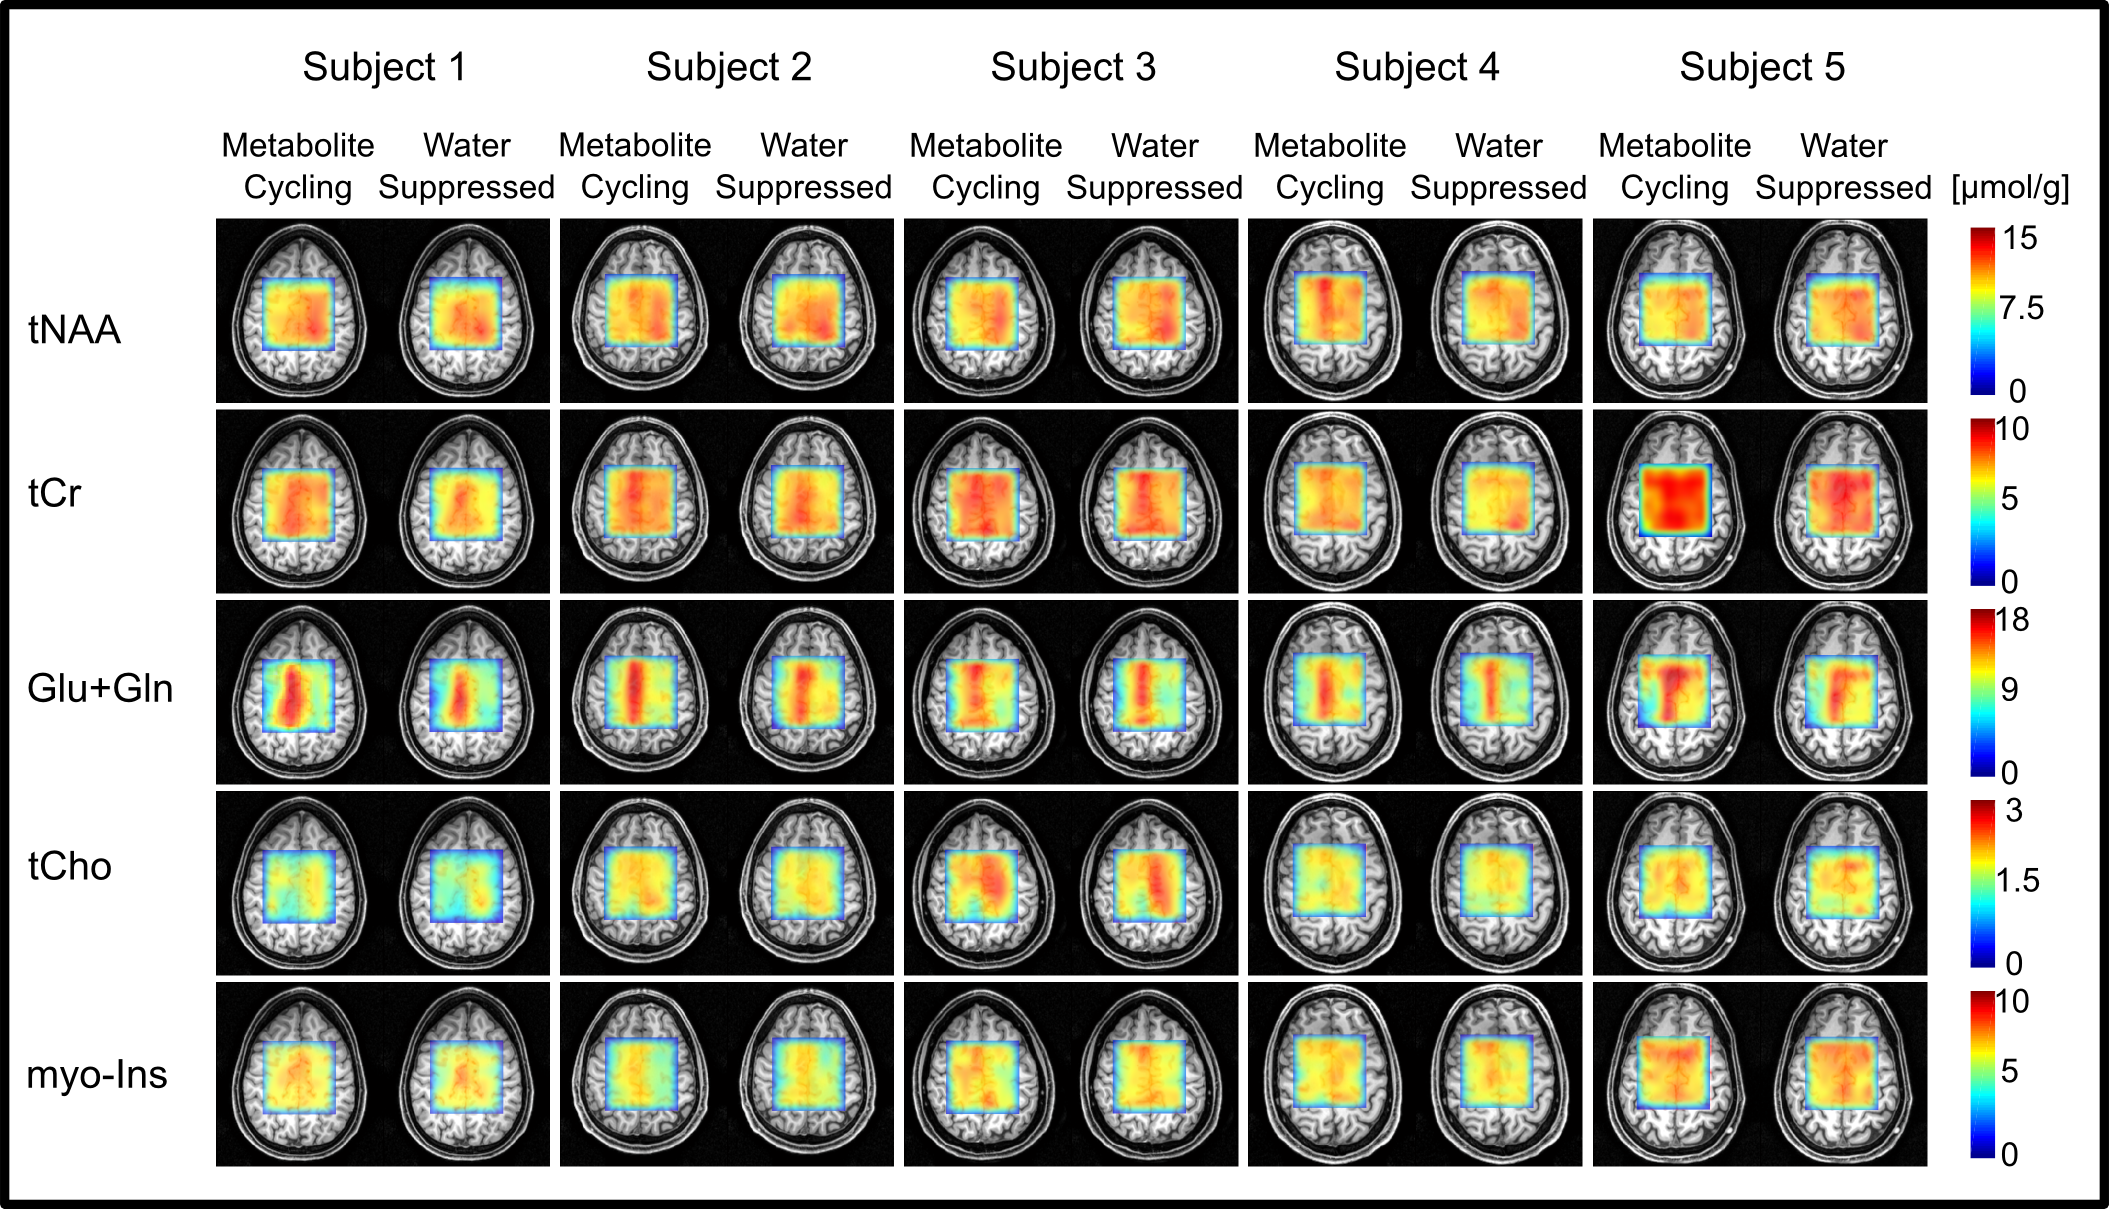
Figure 2 illustrates in vivo MRSI results from a volunteer. Reasonable agreement was found among the spectra from non-water-suppressed and water-suppressed MRSI spectra between 1.8 and 4.2 ppm in the 36 localized voxels (Figure 2a). An overlaid comparison of representative downfield and upfield spectra acquired by non-water-suppressed and water-suppressed methods is illustrated in Figure 2b and 2c. Figure 3 shows the results across all five subjects of quantification with LCModel. A strong positive correlation (r2 > 0.91, p < 0.01) between concentrations obtained from non-water-suppressed and water-suppressed MRSI was found for five brain metabolites across all subjects (36 voxels and 5 metabolites) (Figure 4)Conclusion
In conclusion, we have developed and demonstrated a non-water-suppressed metabolite-cycling MRSI technique that performs robustly on clinical MRI scanners and within a clinically feasible acquisition time. The proposed novel MRSI technique will minimize the required operator intervention and subjectivity, since it does not require any water suppression adjustment prior to the MRSI exam. These advancements can easily be extended to whole brain MRSI via advanced post-processing and reconstruction techniques (7).Acknowledgements
The authors would like to acknowledge the following: the Welcome Trust and the Dunhill Medical Trust.References
1. Dreher W, Leibfritz D. New method for the simultaneous detection of metabolites and water in localized in vivo 1H nuclear magnetic resonance spectroscopy. Magn Reson Med 2005;54(1):190-195.
2. Furuyama JK, Wilson NE, Thomas MA. Spectroscopic imaging using concentrically circular echo-planar trajectories in vivo. Magn Reson Med 2012;67(6):1515-1522.
3. Shah S, Kellman P, Greiser A, Weale P, Zuehlsdorff S, Jerecic R. Rapid Fieldmap Estimation for Cardiac Shimming. Proceedings 17th Scientific Meeting, International Society for Magnetic Resonance in Medicine. Honolulu 2009. p 565.
4. Emir UE, Auerbach EJ, Van De Moortele PF, Marjanska M, Ugurbil K, Terpstra M, Tkac I, Oz G. Regional neurochemical profiles in the human brain measured by (1)H MRS at 7 T using local B(1) shimming. NMR Biomed 2012;25(1):152-160.
5. Provencher SW. Automatic quantitation of localized in vivo 1H spectra with LCModel. NMR Biomed 2001;14(4):260-264.
6. Cabanes E, Confort-Gouny S, Le Fur Y, Simond G, Cozzone PJ. Optimization of residual water signal removal by HLSVD on simulated short echo time proton MR spectra of the human brain. J Magn Reson 2001;150(2):116-125.
7. Ma C, Lam F, Ning Q, Johnson CL, Liang ZP. High-resolution H-MRSI of the brain using short-TE SPICE. Magn Reson Med 2016.
Figures