5520
Comparison of different acceleration methods for high-resolution metabolite mapping using 1H FID MRSI at 9.4T1MPI for Biological Cybernetics, Tuebingen, Germany, 2IMPRS for Cognitive and Systems Neuroscience, Eberhard Karls University of Tübingen, Tuebingen, Germany, 3Institute of Physics, Ernst-Moritz-Arndt University Greifswald, Greifswald, Germany
Synopsis
Reliable metabolite mapping of the human brain using ultra-short TE and TR 1H FID-MRSI is possible at ultra-high fields. However, MRSI studies with high spatial resolutions and brain coverage suffer from long scan times. To make these studies clinically relevant, different acceleration methods are used at the price of losing SNR. The aim of this study is to implement and compare different in-plane acceleration methods: SENSE, GRAPPA and compressed sensing for high-resolution metabolite mapping of the human brain at 9.4T without lipid suppression.
Introduction
Reliable metabolite mapping of the human brain using ultra-short TE and TR 1H FID-MRSI is possible at ultra-high fields1-5. However, MRSI studies with high spatial resolutions and brain coverage suffer from long scan times. To make these studies clinically relevant, different acceleration methods are used at the price of losing SNR2-10. However, there is still a need for a comparison of the different methods with respect to their effect on the quality of the spectra and metabolite maps.
The aim of this study is to implement and compare different in-plane acceleration methods: SENSE6-8, GRAPPA2-4 and compressed sensing9 for high-resolution metabolite mapping of the human brain at 9.4T without lipid suppression.
Methods
Studies were performed on a 9.4T whole-body Siemens human scanner with a 16Tx/31Rx in-house developed coil11. Single-slice FID-MRSI datasets were acquired from the brains of 3 healthy volunteers with: FOV 200x200mm, slice thickness 10mm, matrix size 64x64, flip angle 28, bandwidth 4000Hz, acquisition time 128ms, TR 220ms.
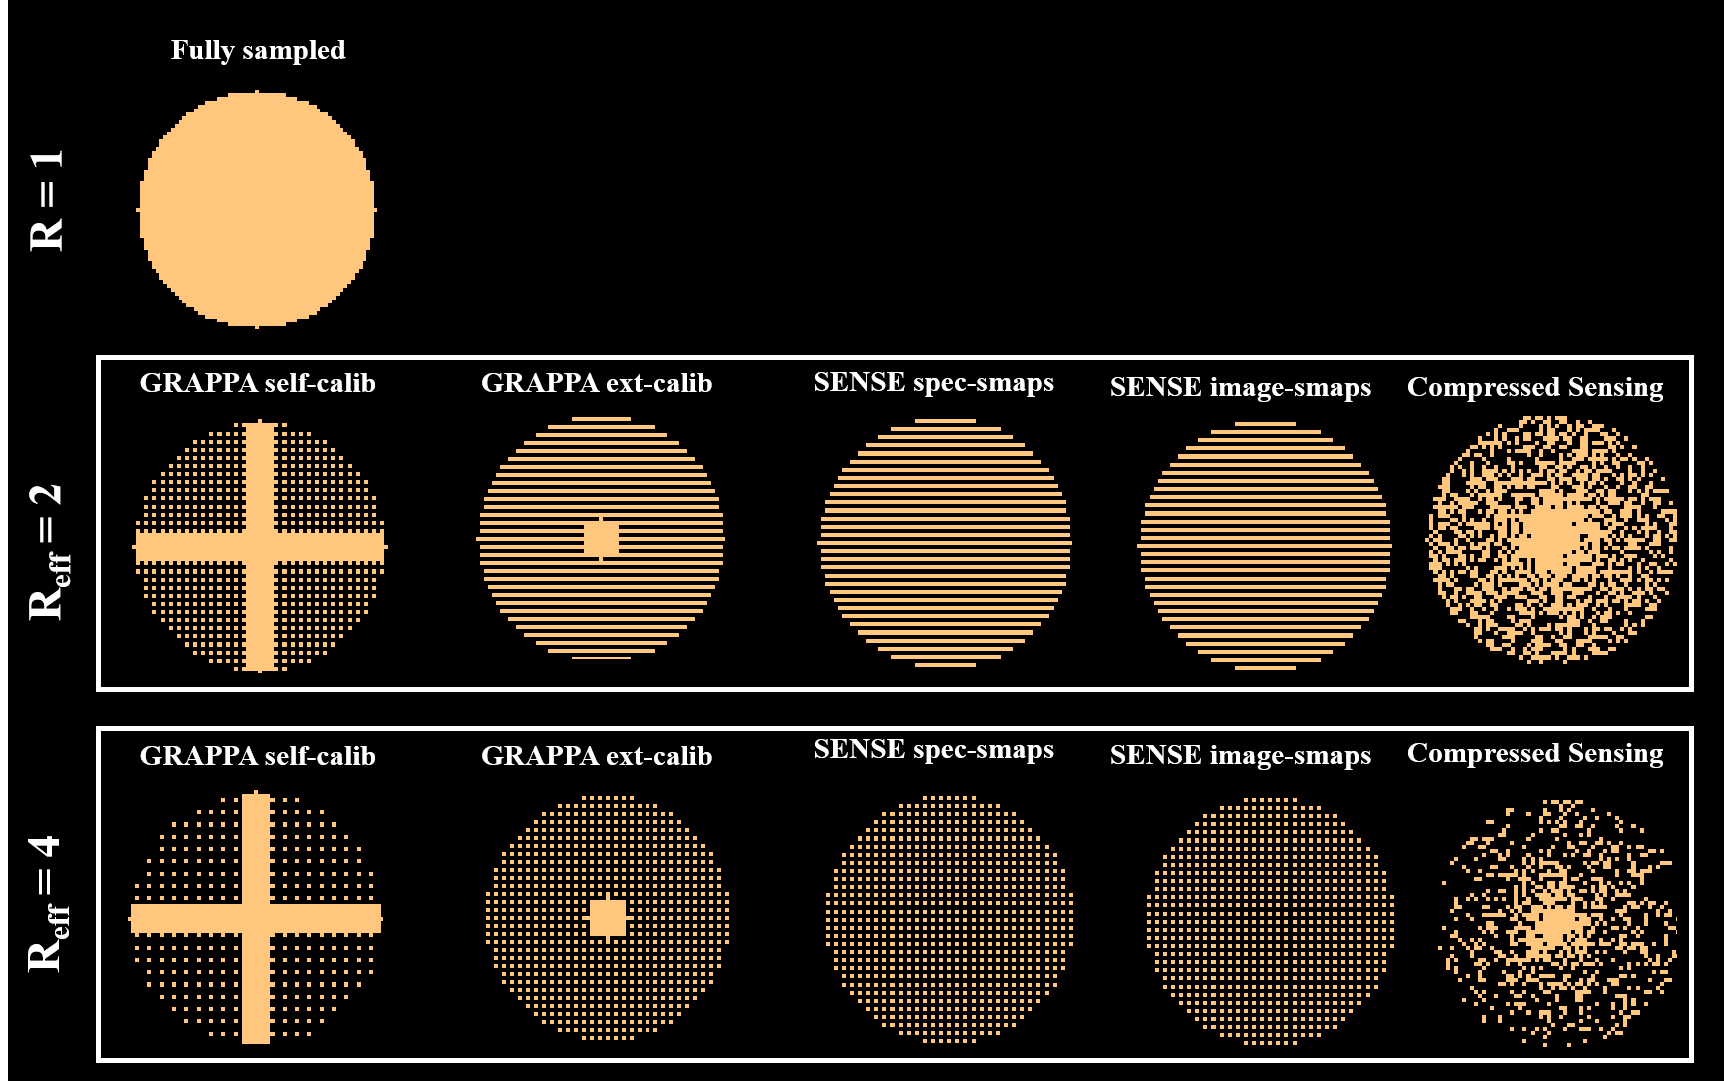
10 different acceleration schemes were implemented in the sequence and were acquired (fully-sampled data were acquired as the reference):
1-4: Two variations of GRAPPA acceleration (each with R=2 and R=4): 1) six lines fully-sampled in each direction and used for self-calibration, and 2) the center of k-space fully-sampled up to the variable density radius and the auto-calibration lines acquired from an external image (namely, a fast non-water suppressed image acquired with a TR of 25ms).
5-8: Two variations of SENSE acceleration (each with R=2 and R=4) with sensitivity maps acquired from: 1) a 2D FLASH scan (TR = 312ms) with resolution of 8x8 times more than that of the MRSI scan, or 2) a fast non-water suppressed spectroscopic image (TR=25ms) with the same resolution as the MRSI scan.
9-10: Compressed sensing with effective R=2 and R=4, where the k-space is always fully sampled up to the variable density radius. The reconstruction of the compressed sensing was done using a modified version of Lustig12:
$$min_m||F_u m-y||^2_2+\lambda_1 ||\Psi m||_1+\lambda_2 TV(m)$$
where the sparsifying transform was the wavelet transform in the kx-t domain and total variation was minimized in the spatial domain.
Figure 1 shows the different acquisition schemes used for each acceleration method. Reconstructed spectra were processed in MATLAB and fit using LCMODEL13.
Results
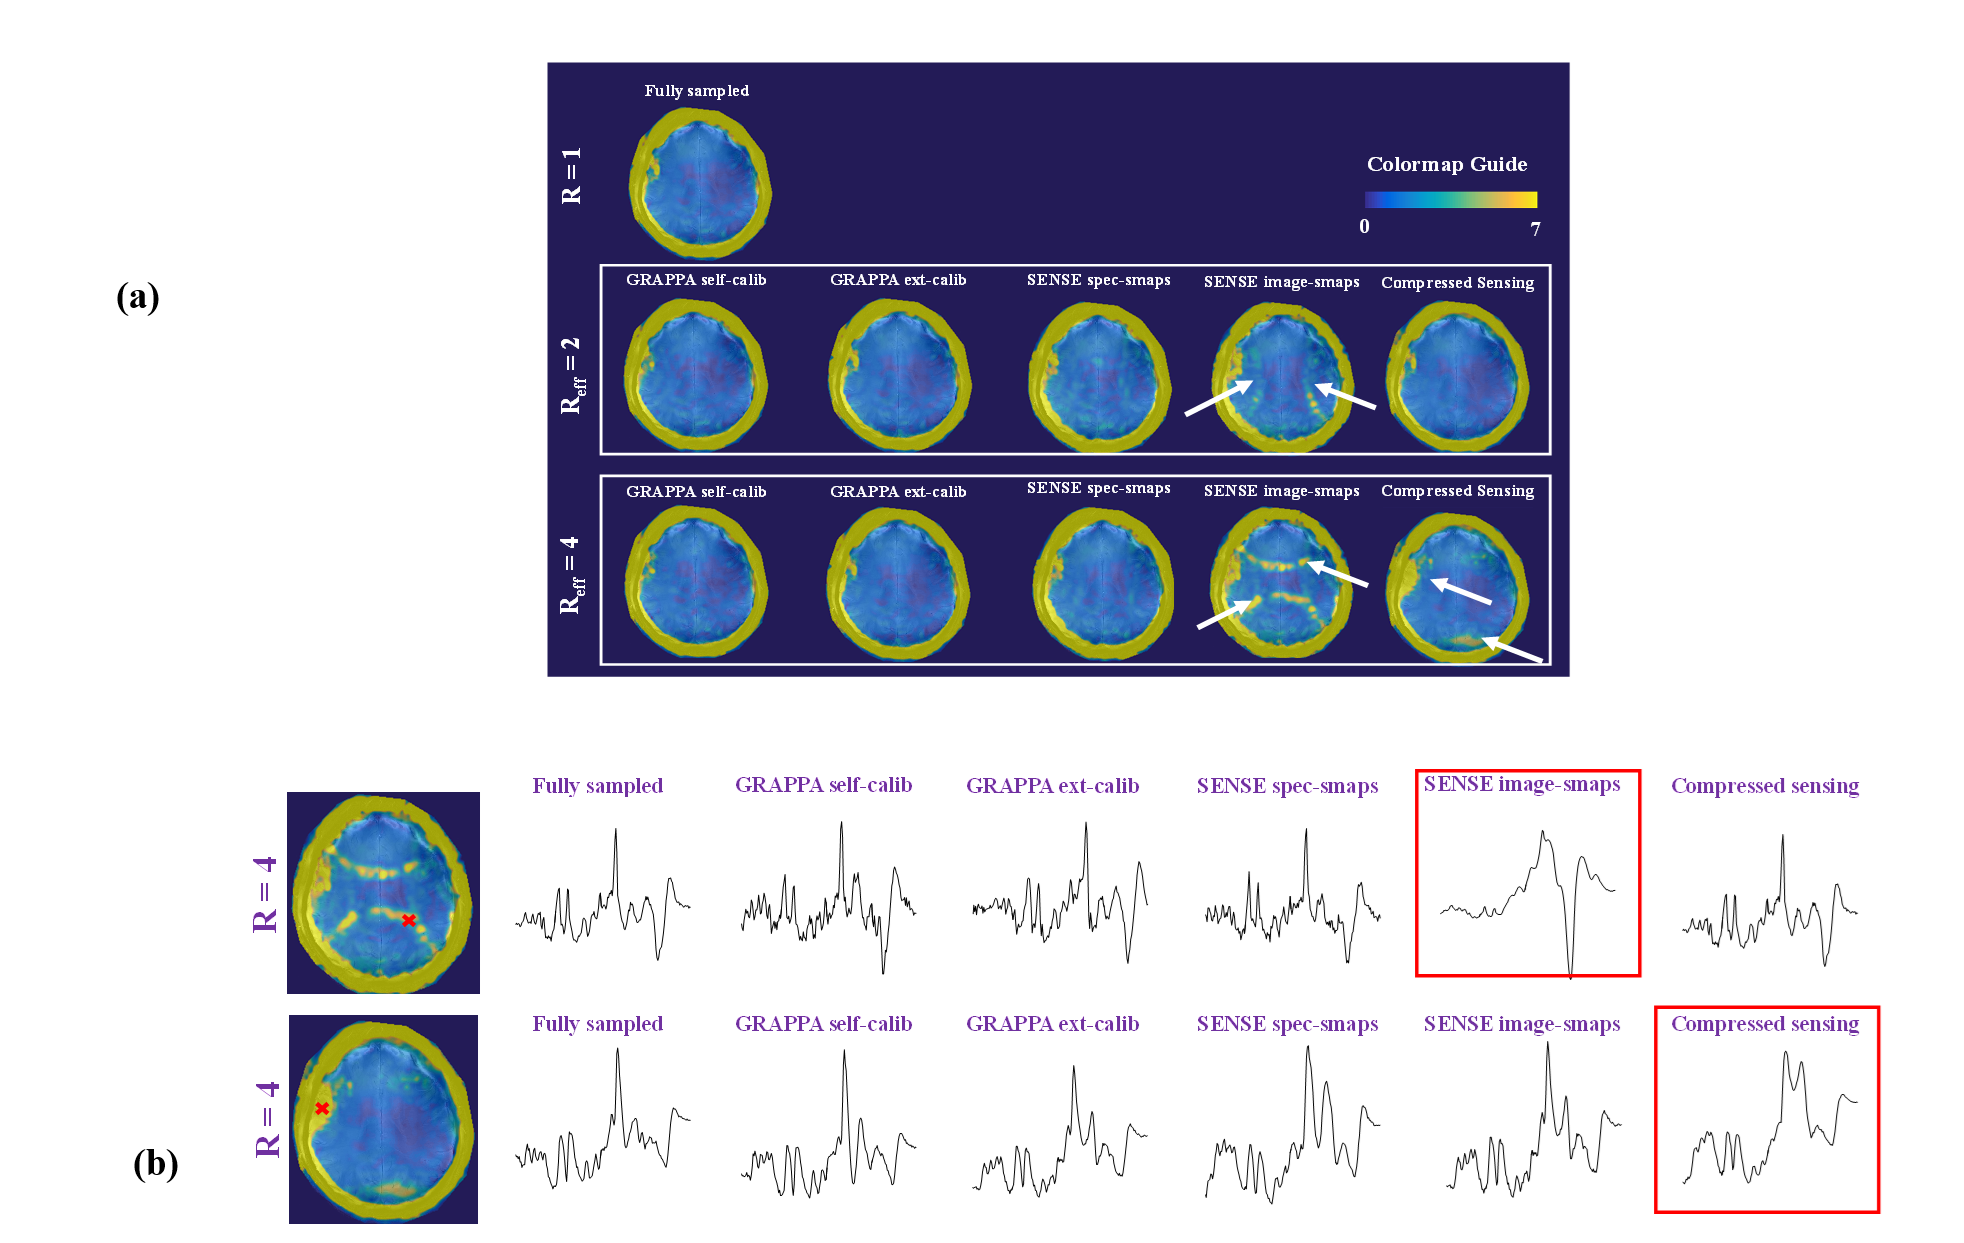
Since no lipid or outer-volume suppression was used, fat contamination as a result of acceleration can be a problem. Figure 2 shows the fat contamination maps and sample spectra for all acceleration schemes.
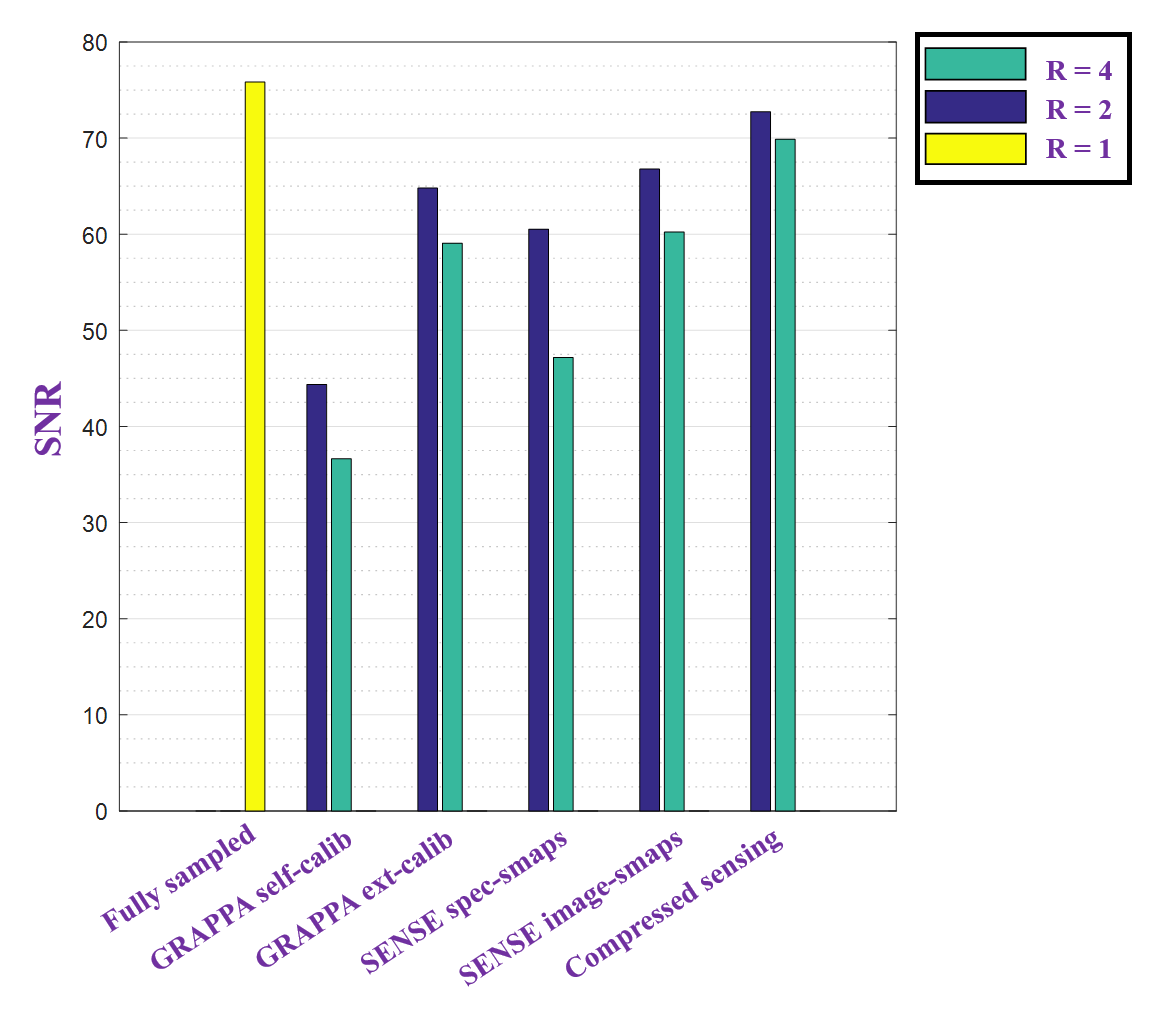
Figure 3 shows the average SNR (averaged over all volunteers) for different acceleration schemes. Compressed sensing has the least SNR drop (as it is inherently a denoising method), this is followed by SENSE (only when the high resolution scout image is used to de-correlate the noise of different coils) and the externally calibrated GRAPPA.
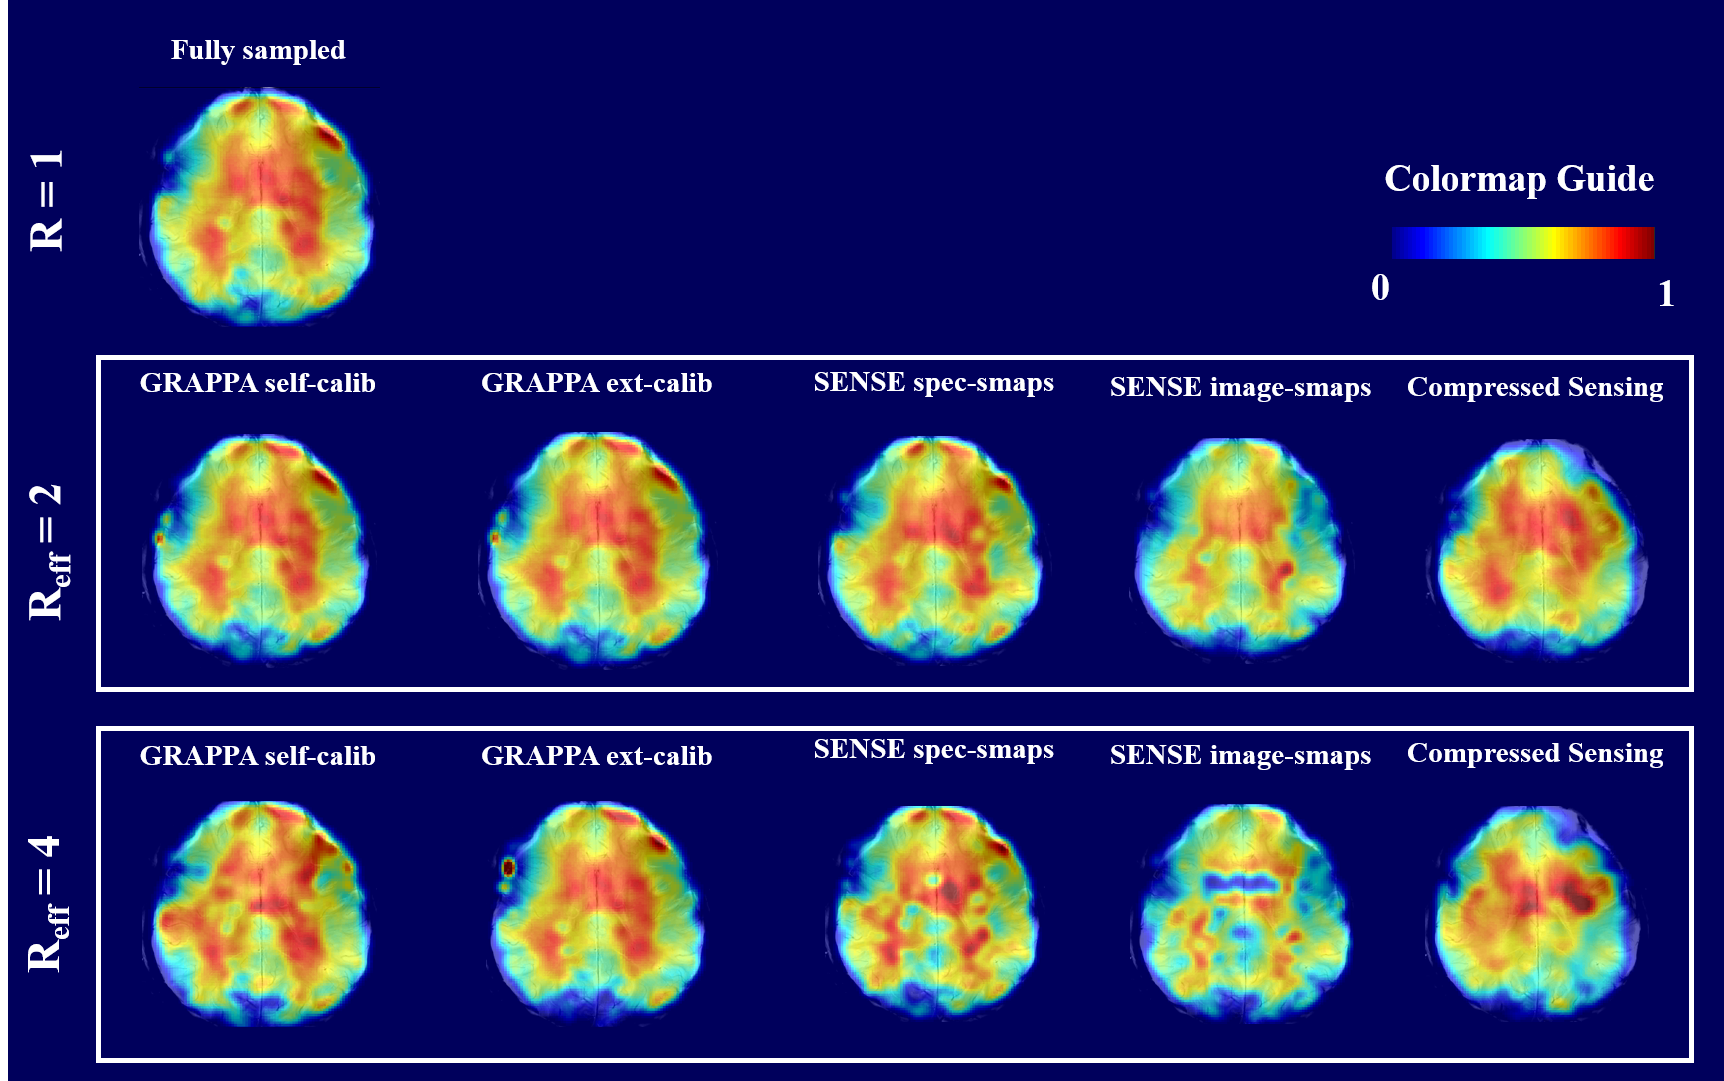
The overall effect of the different acceleration schemes only becomes apparent when we look at the resulting metabolite maps. Figure 4 and 5 show maps of tCho and Glu that inherently have strong white vs. gray matter contrasts. It can be seen that the R=2 accelerated maps preserve almost all the anatomical details. However, for higher acceleration, the quality of the maps deteriorate for acquisition schemes such as self-calibrated GRAPPA, SENSE (with scout images), and compressed sensing. This is a combined effect of the lower SNR or fat contamination. The most similar maps are from the externally calibrated GRAPPA.
Discussion
The SENSE acceleration scheme using the scout image results in unwrapping artifact and fat rings showing up in the image. This can be due to inconsistencies between the MRSI dataset and the FLASH image and may be improved by more sophisticated reconstruction schemes8. This artifact is not present in the other SENSE scheme because the fast non-water suppressed spectroscopic image is used to determine coil sensitivities. The compressed sensing (R=4) also shows some residual fat contaminations because the large lipid peak present in the spectra of the voxels close to the skull make those spectra less sparse. Hence, the reconstruction is not able to fully recover the lower concentrated metabolites. Higher acceleration may be possible with more sophisticated schemes such as CAIPIRINHA14, overdiscrete SENSE with image prior knowledge8 or for compressed sensing using k-t sparse reconstruction15.Conclusion
10 different acceleration schemes were compared
for high resolution FID MRSI metabolite mapping of the brain. The acceleration
method that best preserves the quality of the maps even at higher acceleration factors
is GRAPPA with the additional non-water suppressed image used for the
calibration of the reconstruction kernel.Acknowledgements
This study was supported by the European Research Council Starting grant, project SYNAPLAST MR #679927.References
[1] Henning et al, NMR in Biomed 2009
[2] Povazan et al., NeuroImage 2015
[3] Strasser et al., MRM 2016
[4] Hangel et al., NMR in Biomed 2015
[5] Boer et al., MRM 2015
[6] Pruessman et al., MRM 1999
[7] Dydak et al., MRM 2001
[8] Kirchner et al., MRM 2015
[9] Otazo et al., ISMRM 2009
[10] Maudsley et al., NMR Biomed 2012
[11] Shajan et al., MRM 2014
[12] Lustig et al., MRM 2007
[13] Provencher, MRM 1993
[14] Strasser et al., MRM 2016
[15] Otazo et al., MRM 2010
Figures