5518
Macromolecule Mapping with Ultrashort-TE Acquisition and Metabolite Spectral Prior1Beckman Institute for Advanced Science and Technology, University of Illinois at Urbana-Champaign, Urbana, IL, United States, 2Department of Electrical and Computer Engineering, University of Illinois at Urbana-Champaign, Urbana, IL, United States
Synopsis
This work presents a novel method for macromolecule mapping and quantification. The proposed method integrates an FID-based MRSI acquisition with a generalized series (GS) model based extrapolation scheme. The FID acquisition allows for the use of ultrashort echoes and short repetition times for fast imaging with improved SNR efficiency. The GS model effectively makes use of the spectral priors from single voxel spectroscopy and allows for reformulating the back-extrapolation of metabolite signals as a linear problem (in contrast to conventional nonlinear methods). Results from in vivo experiments demonstrate that MM signals estimated by the proposed method are consistent with an inversion recovery based method and lead to better metabolite quantification.
Introduction
There has been a growing interest in the mapping and quantification of macromolecules (MMs) in the brain, because their potential implications in various physiological and pathological conditions and the improved metabolite quantification by incorporating a properly estimated MM component1-3. One main approach for MM estimation is to use inversion recovery (IR) based acquisitions that exploit the T1 differences between MMs and metabolites1-3. This prolongs the acquisitions due to the typically long IR periods (~500-700ms) needed for nulling metabolite. Another approach is to use parametric models for jointly fitting metabolite and MM signals, exploiting their T2 differences4,5. This does not rely on special acquisitions but can lead to large estimation variances due to the nonlinearity of the problem. In this work, we propose a new method for MM mapping that integrates an FID-based acquisition and a generalized series (GS) model based metabolite extrapolation. The FID acquisition uses ultrashort-TE and short-TR for fast data collection with improved SNR efficiency. The GS model takes advantages of spectral priors available from single voxel spectroscopy (SVS) experiments and reformulates the metabolite extrapolation as a linear problem. In vivo experiments have been performed to evaluate the proposed method.Theory
Signal model
The proposed method represents the MRSI signals $$$s\left(\mathbf{r},f\right)$$$ using the following GS-based model
\begin{eqnarray*} s\left(\mathbf{r},f\right) & = & \sum_{p=1}^{P}g_{p}(\mathbf{r})\phi_{p}(f)+s_{MM}\left(\mathbf{r},f\right)\\ & = & \sum_{p=1}^{P}g_{p}(\mathbf{r})s_{ref}(f)e^{-i2\pi fp\Delta t}+s_{MM}\left(\mathbf{r},f\right). \quad\quad [1]\end{eqnarray*}
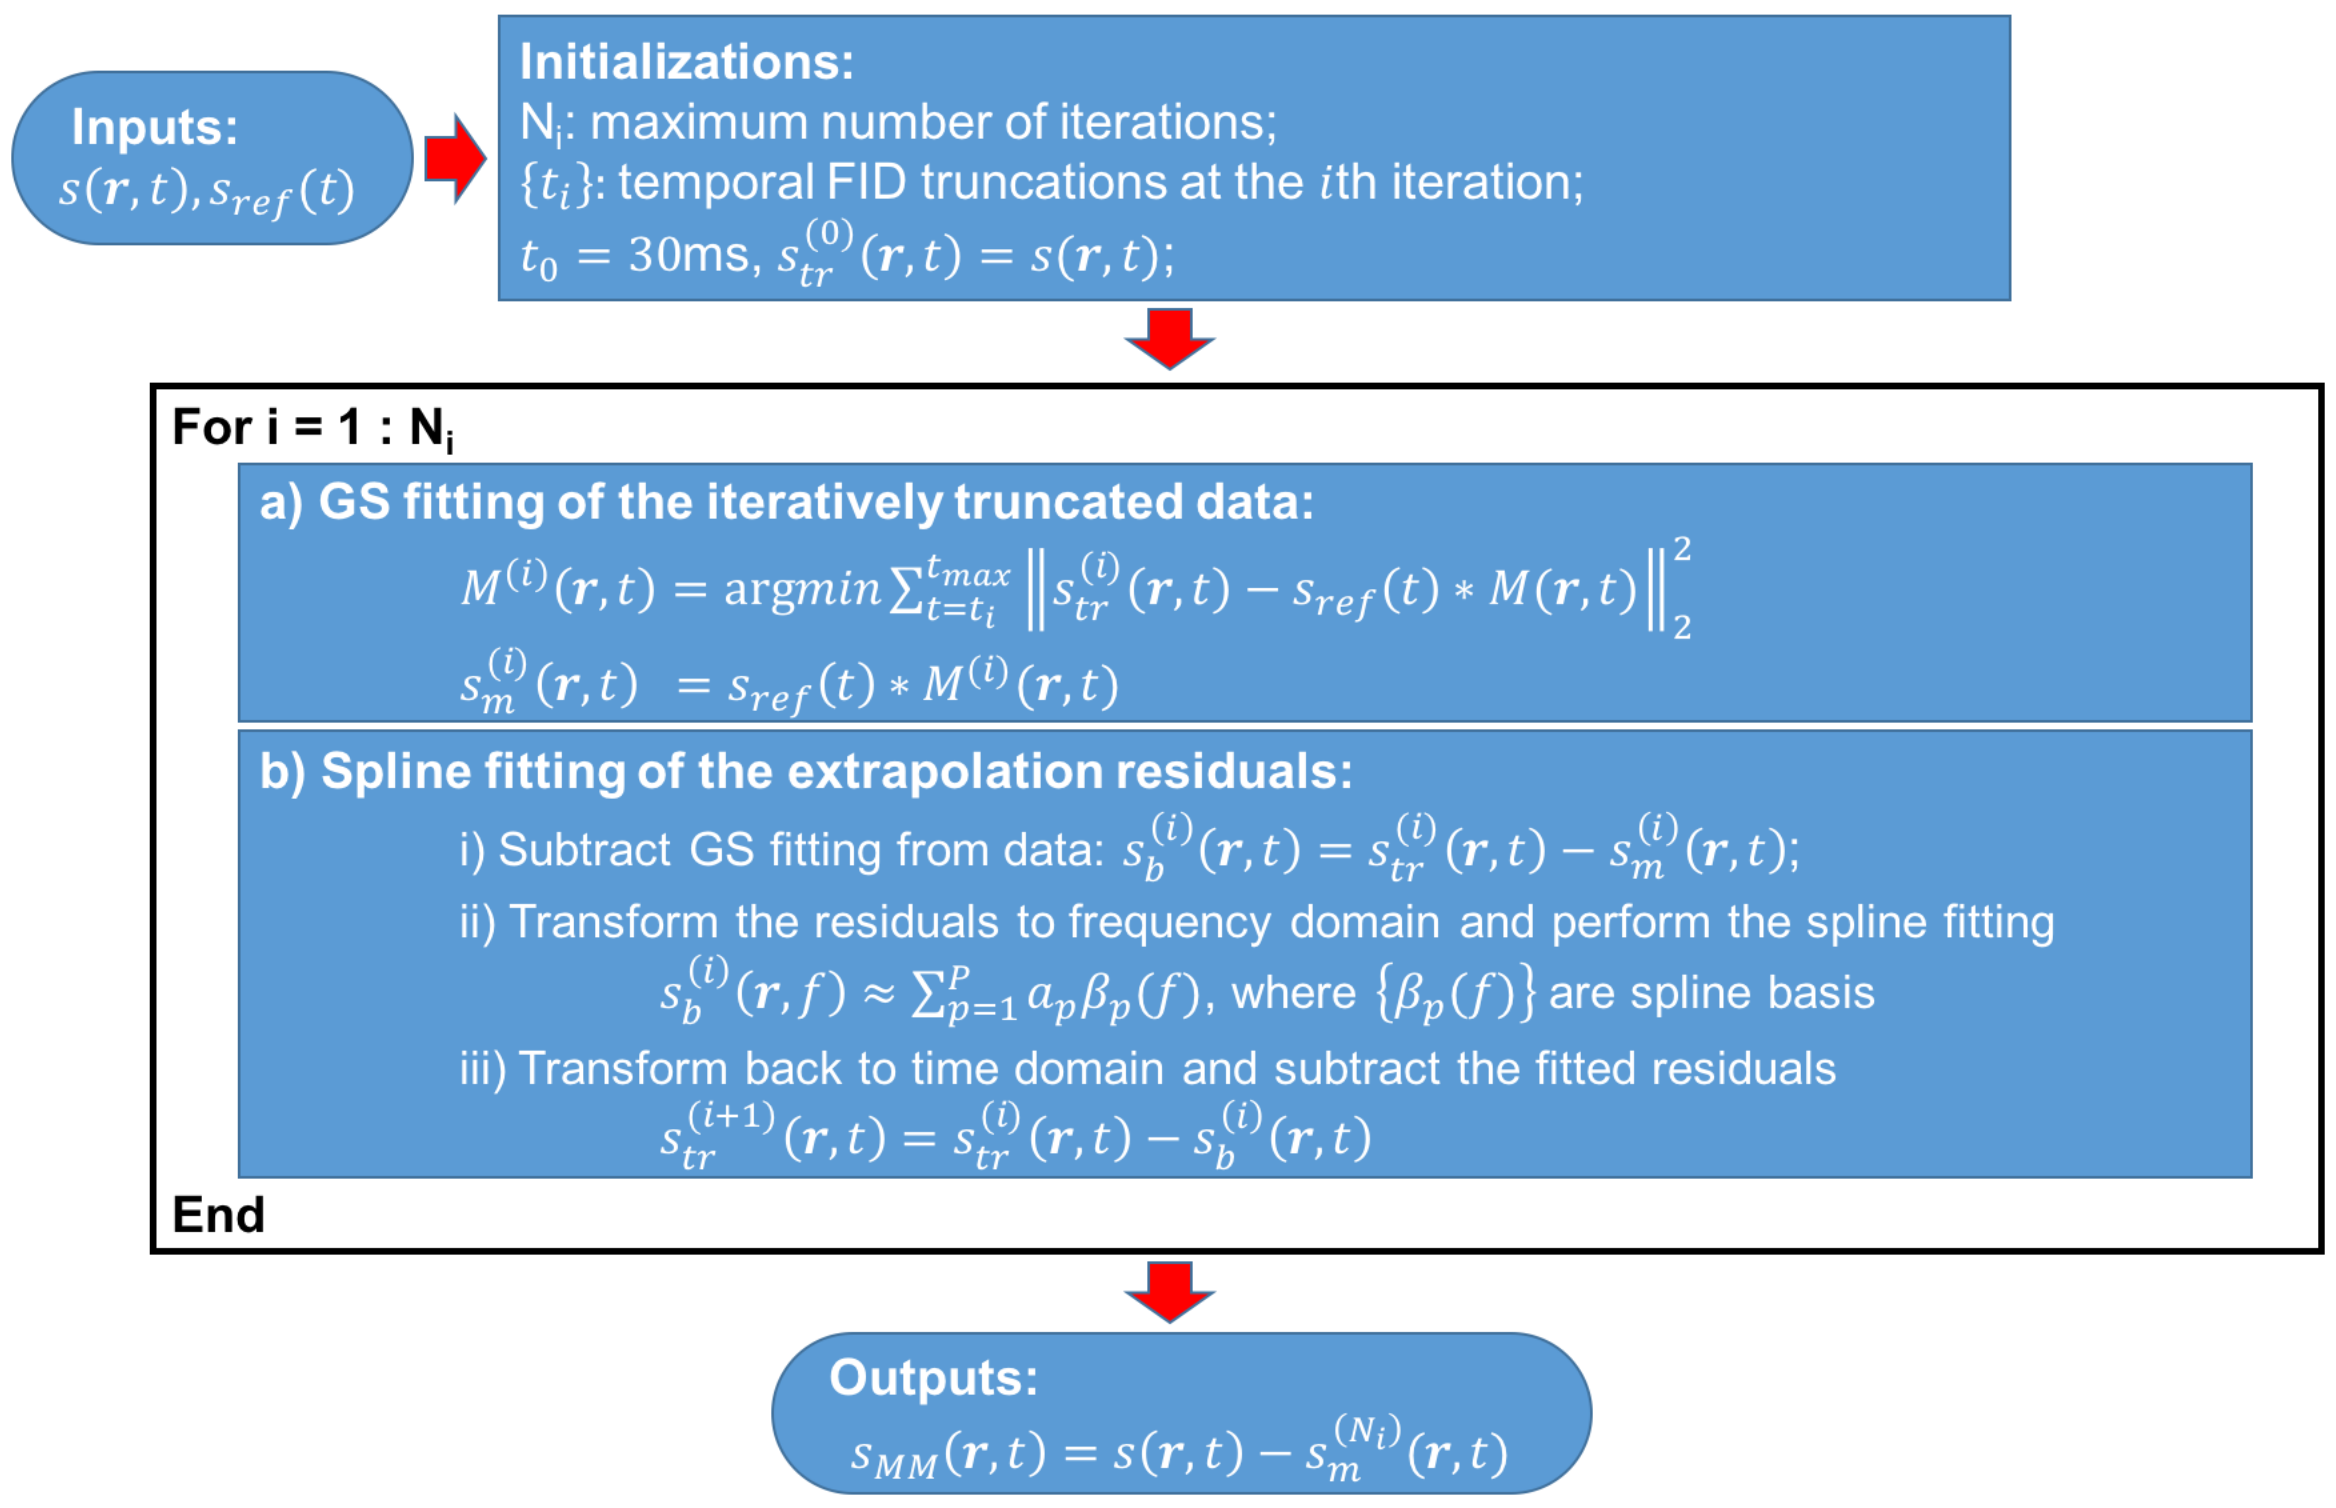
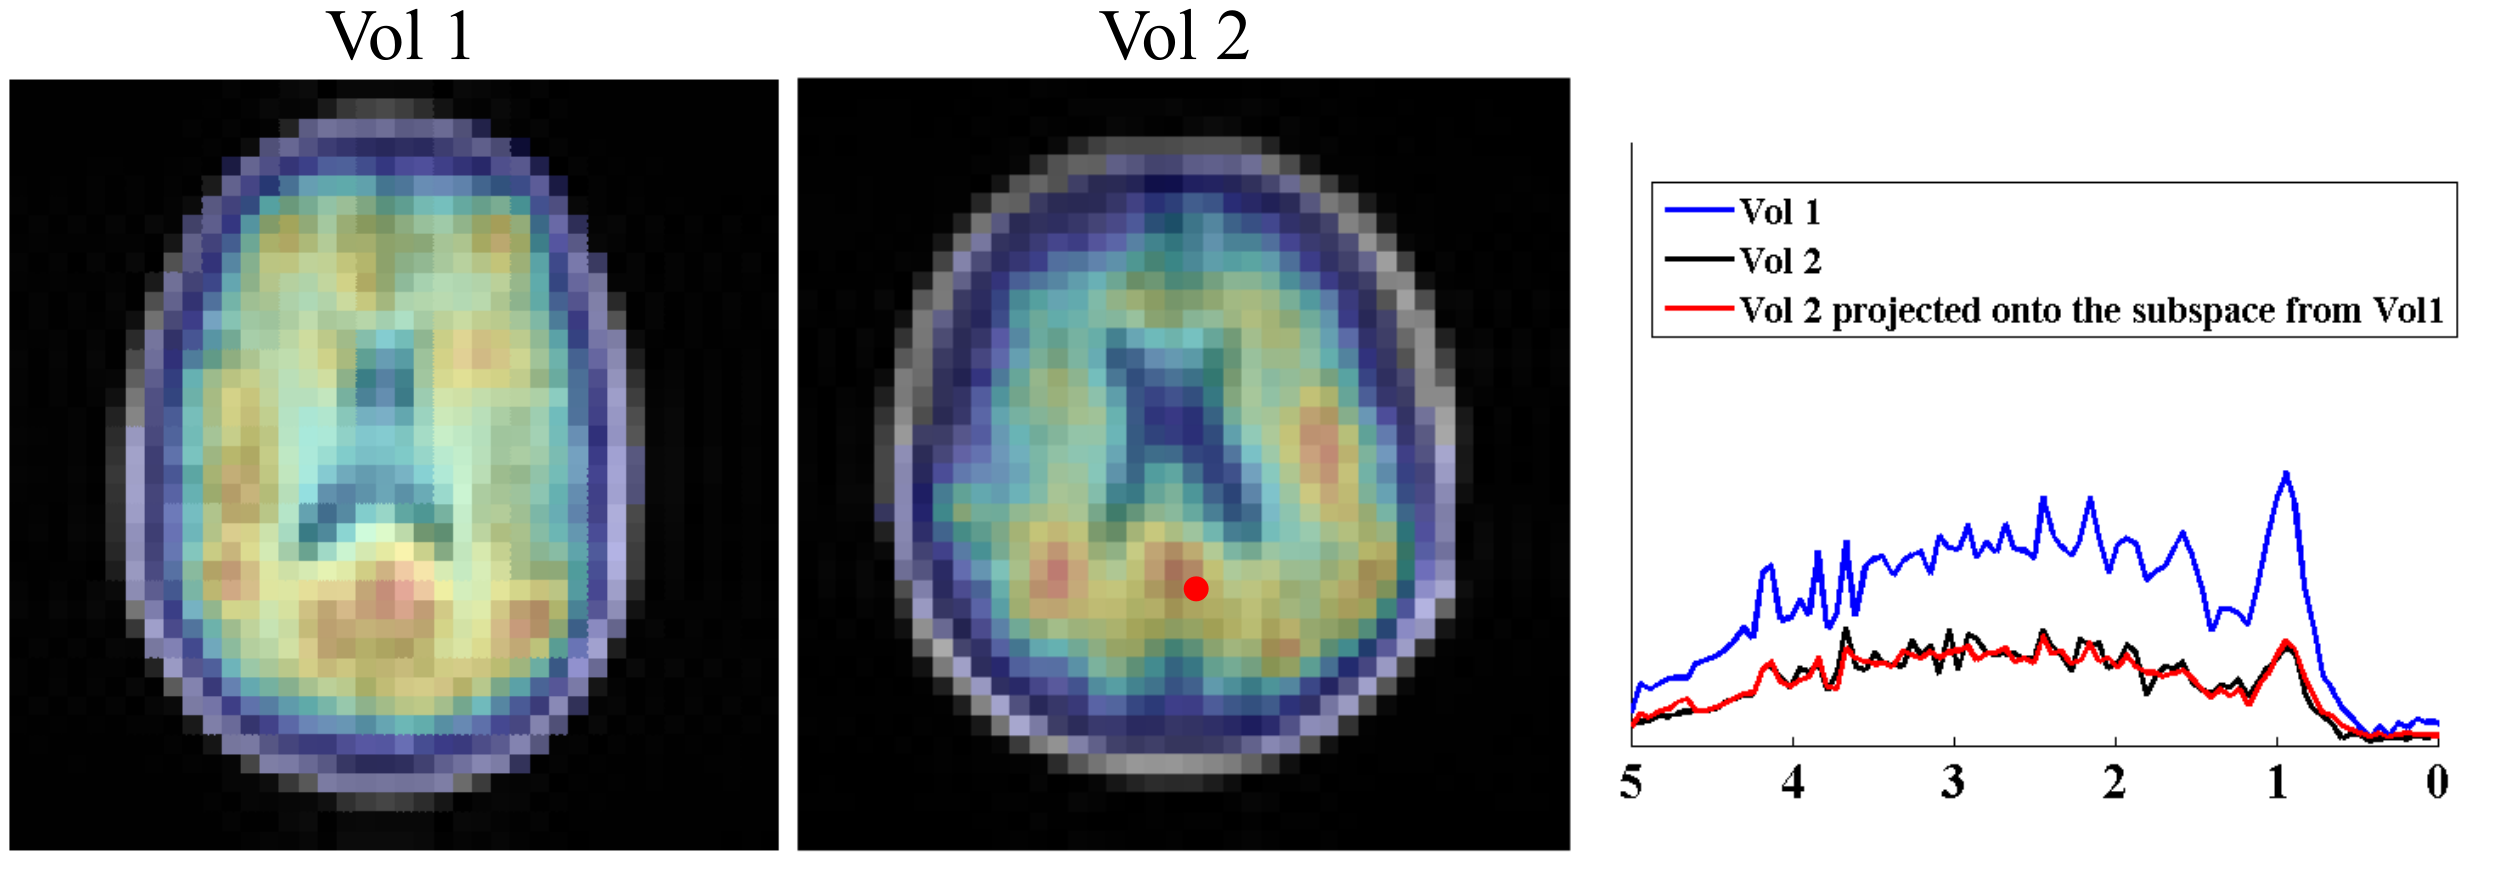
$$$\left\{\phi_{p}(f)\right\}$$$ are the GS bases constructed under maximum cross entropy principle with a metabolite reference $$$s_{ref}(f)$$$6 and $$$\left\{g_{p}(\mathbf{r})\right\}$$$ the corresponding coefficients. $$$s_{MM}\left(\mathbf{r},f\right)$$$ represents the MM component. The use of GS model is motivated by its representation efficiency and success in data extrapolation provided a good reference6. This is very desirable for MRSI since high-quality spectral priors can be obtained from SVS experiments. Given $$$s_{ref}(f)$$$ and the model in Eq. [1], we developed an iterative FID-truncation and back-extrapolation algorithm to remove the metabolite component from $$$ s\left(\mathbf{r},f\right)$$$ and extract $$$s_{MM}\left(\mathbf{r},f\right)$$$. This algorithm is described Fig. 1.
Estimation of $$$s_{ref}(f)$$$/$$$s_{ref}(t)$$$
To construct a good reference, $$$s_{ref}(f)$$$, we acquire a set of high-SNR SVS data and perform the following spectral fitting
\begin{eqnarray*}\hat{T}_{2,m},\hat{a}_{m,TE_{i}},\delta f & = & \sum_{TE_{i}=1}^{I}\sum_{n=1}^{N}\left|s_{TE_{i}}(t_{n})-env(t_{n})\sum_{m=1}^{M}a_{m,TE_{i}}e^{-t_{n}/T_{2,m}}\phi_{m,TE_{i}}\left(t_{n}\right)e^{-i2\pi\delta ft_{n}}\right|_{2}^{2},\\\end{eqnarray*}
where $$$s_{TE_i}$$$ denotes the SVS data with different TEs. $$$\phi_{m,TE_i}$$$, $$$T_{2,m}$$$, $$$a_{m,TE_i}$$$ denote the basis functions, relaxation parameters and relative concentrations for different metabolites. $$$\delta f$$$ accounts for a global frequency discrepancy and $$$env(t)$$$ denotes an envelope function. Using more than one TEs further exploits the J-coupling differences between MMs and metabolites thus improves their separation2. $$$s_{ref}(t)$$$ is then synthesized as $$$s_{ref}(t)=\sum_{m=1}^{M}\hat{a}_{m,TE_1}e^{-t/\hat{T}_{2,m}}\phi_{m,TE_1}\left(t\right)$$$ and fed into the proposed algorithm.
Results
In vivo data were acquired on a Siemens Trio 3T system to evaluate the proposed method. To this end, an FID-CSI sequence with ultrashort-TE, short-TR and IR capabilities was developed. The SVS data were acquired at two TEs (30 and 100ms, 2s TR, WET water suppression, PRESS localization) and water FIDs were acquired for estimating $$$env(t)$$$ (32 TEs, 30ms-340ms, 1min). MPRAGE images and B0 field maps were acquired to provide the information for nuisance removal7 and B0 inhomogeneity correction8 for the CSI data.
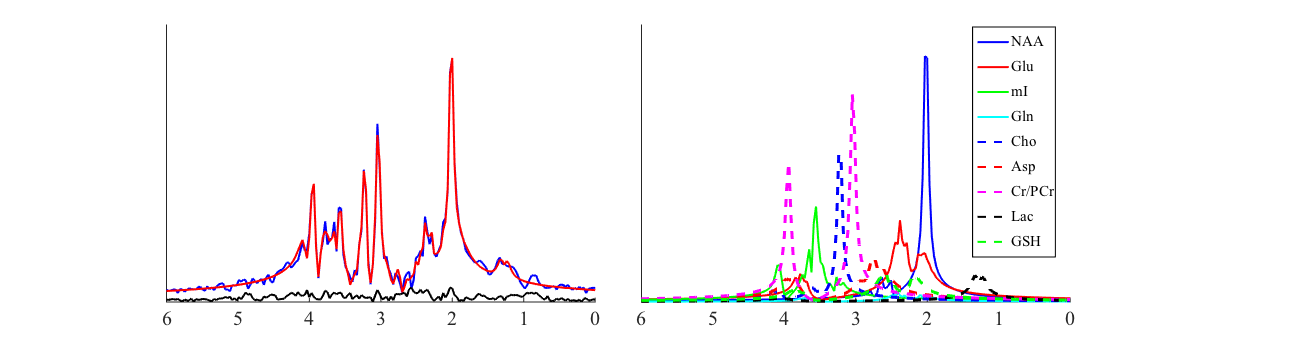
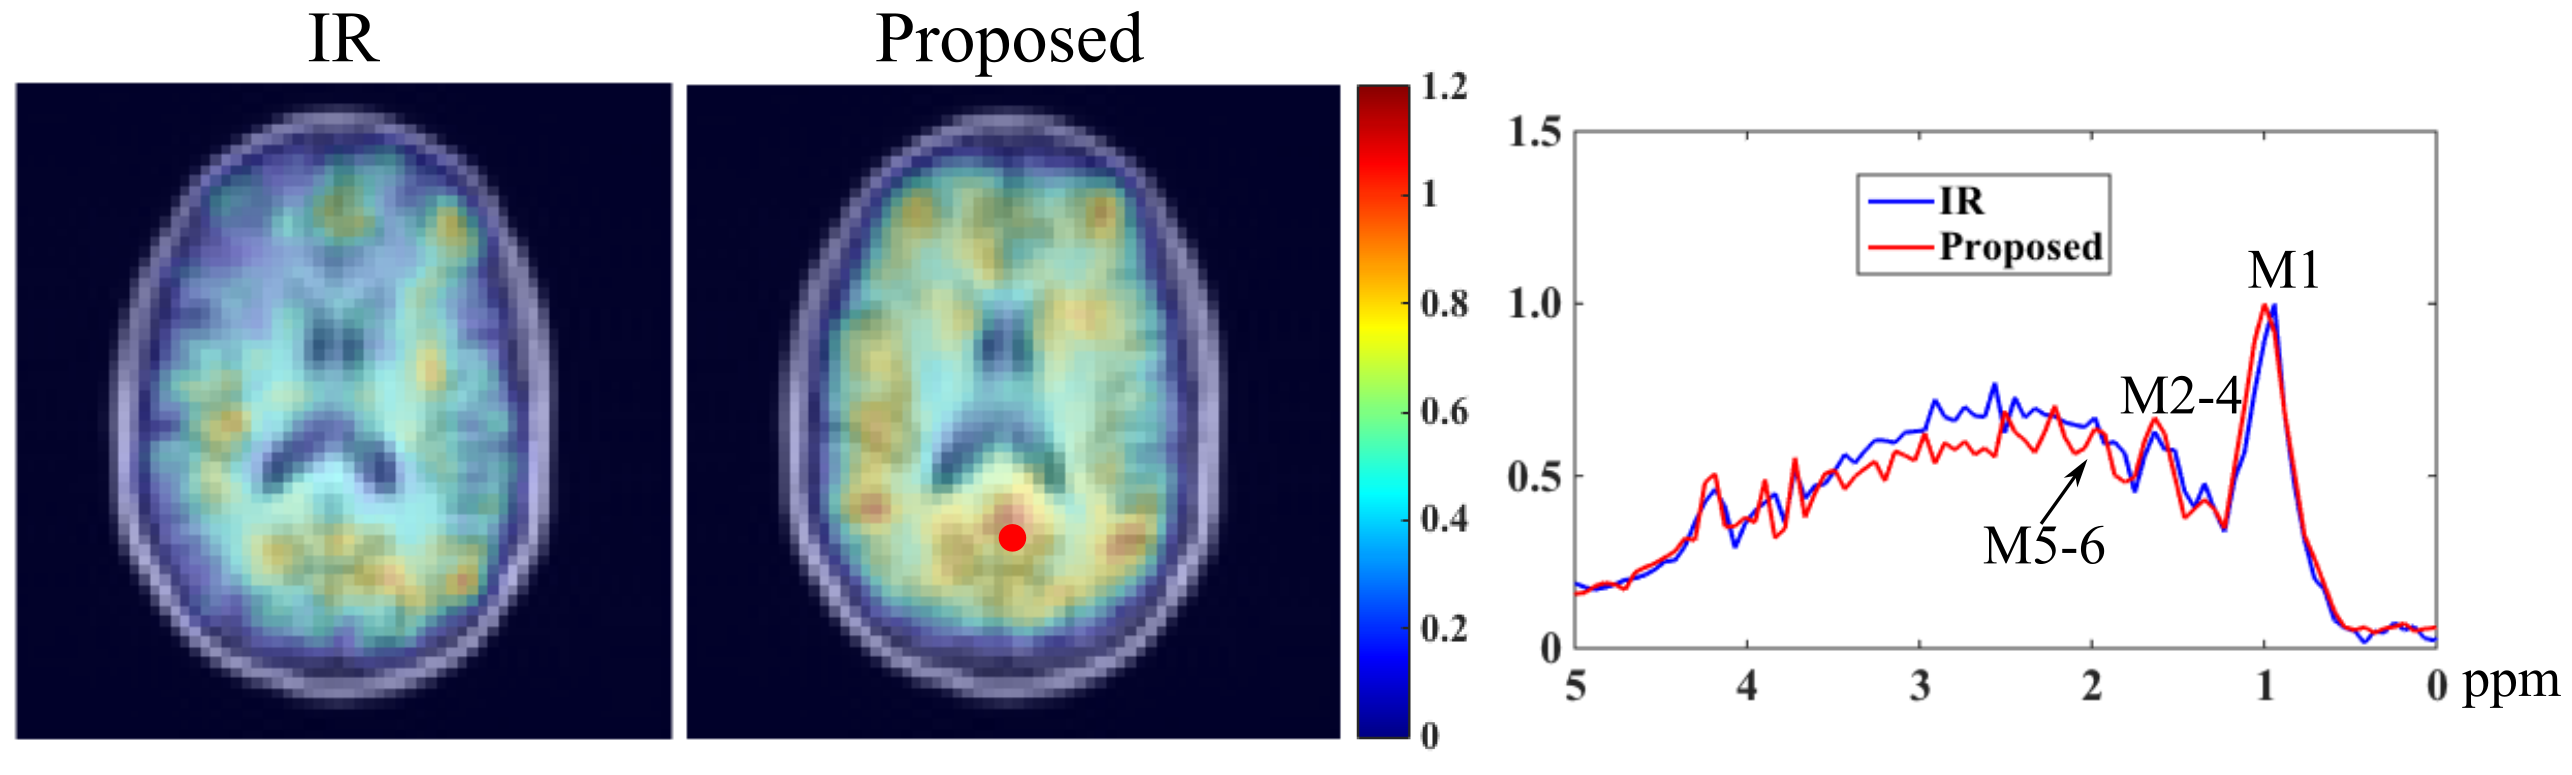
Figure 2 illustrates the spectral fitting results from a set of representative SVS data. A low residual level and good separation of different metabolite components can be obtained, which was used to synthesize $$$s_{ref}$$$. The MM distribution and a representative spectrum obtained by the proposed method from an FID-CSI dataset (TR/TE=800/4ms, 36x36 matrix size, elliptical sampling) are shown in Fig. 3, with comparison to the results from an IR acquisition (TI=600ms, same resolution and TR/TE). Consistent results can be observed.
To demonstrate the utility of the measured MM signals, a set of MM bases $$$\left\{v_{l}(t)\right\}$$$ were estimated from $$$s_{MM}\left(\mathbf{r},t\right)$$$ (by SVD analysis) and incorporated into the following model to quantify the CSI data:
\begin{eqnarray*}s(\mathbf{r},t) & = & \sum_{m=1}^{M}c_{m}(\mathbf{r})e^{-t/T_{2,m}^{*}(\mathbf{r})+i2\pi\delta f_m(\mathbf{r})t}\phi_{m}(t)+\sum_{l=1}^{L}b_{l}(\mathbf{r})v_{l}(t)\\\end{eqnarray*}
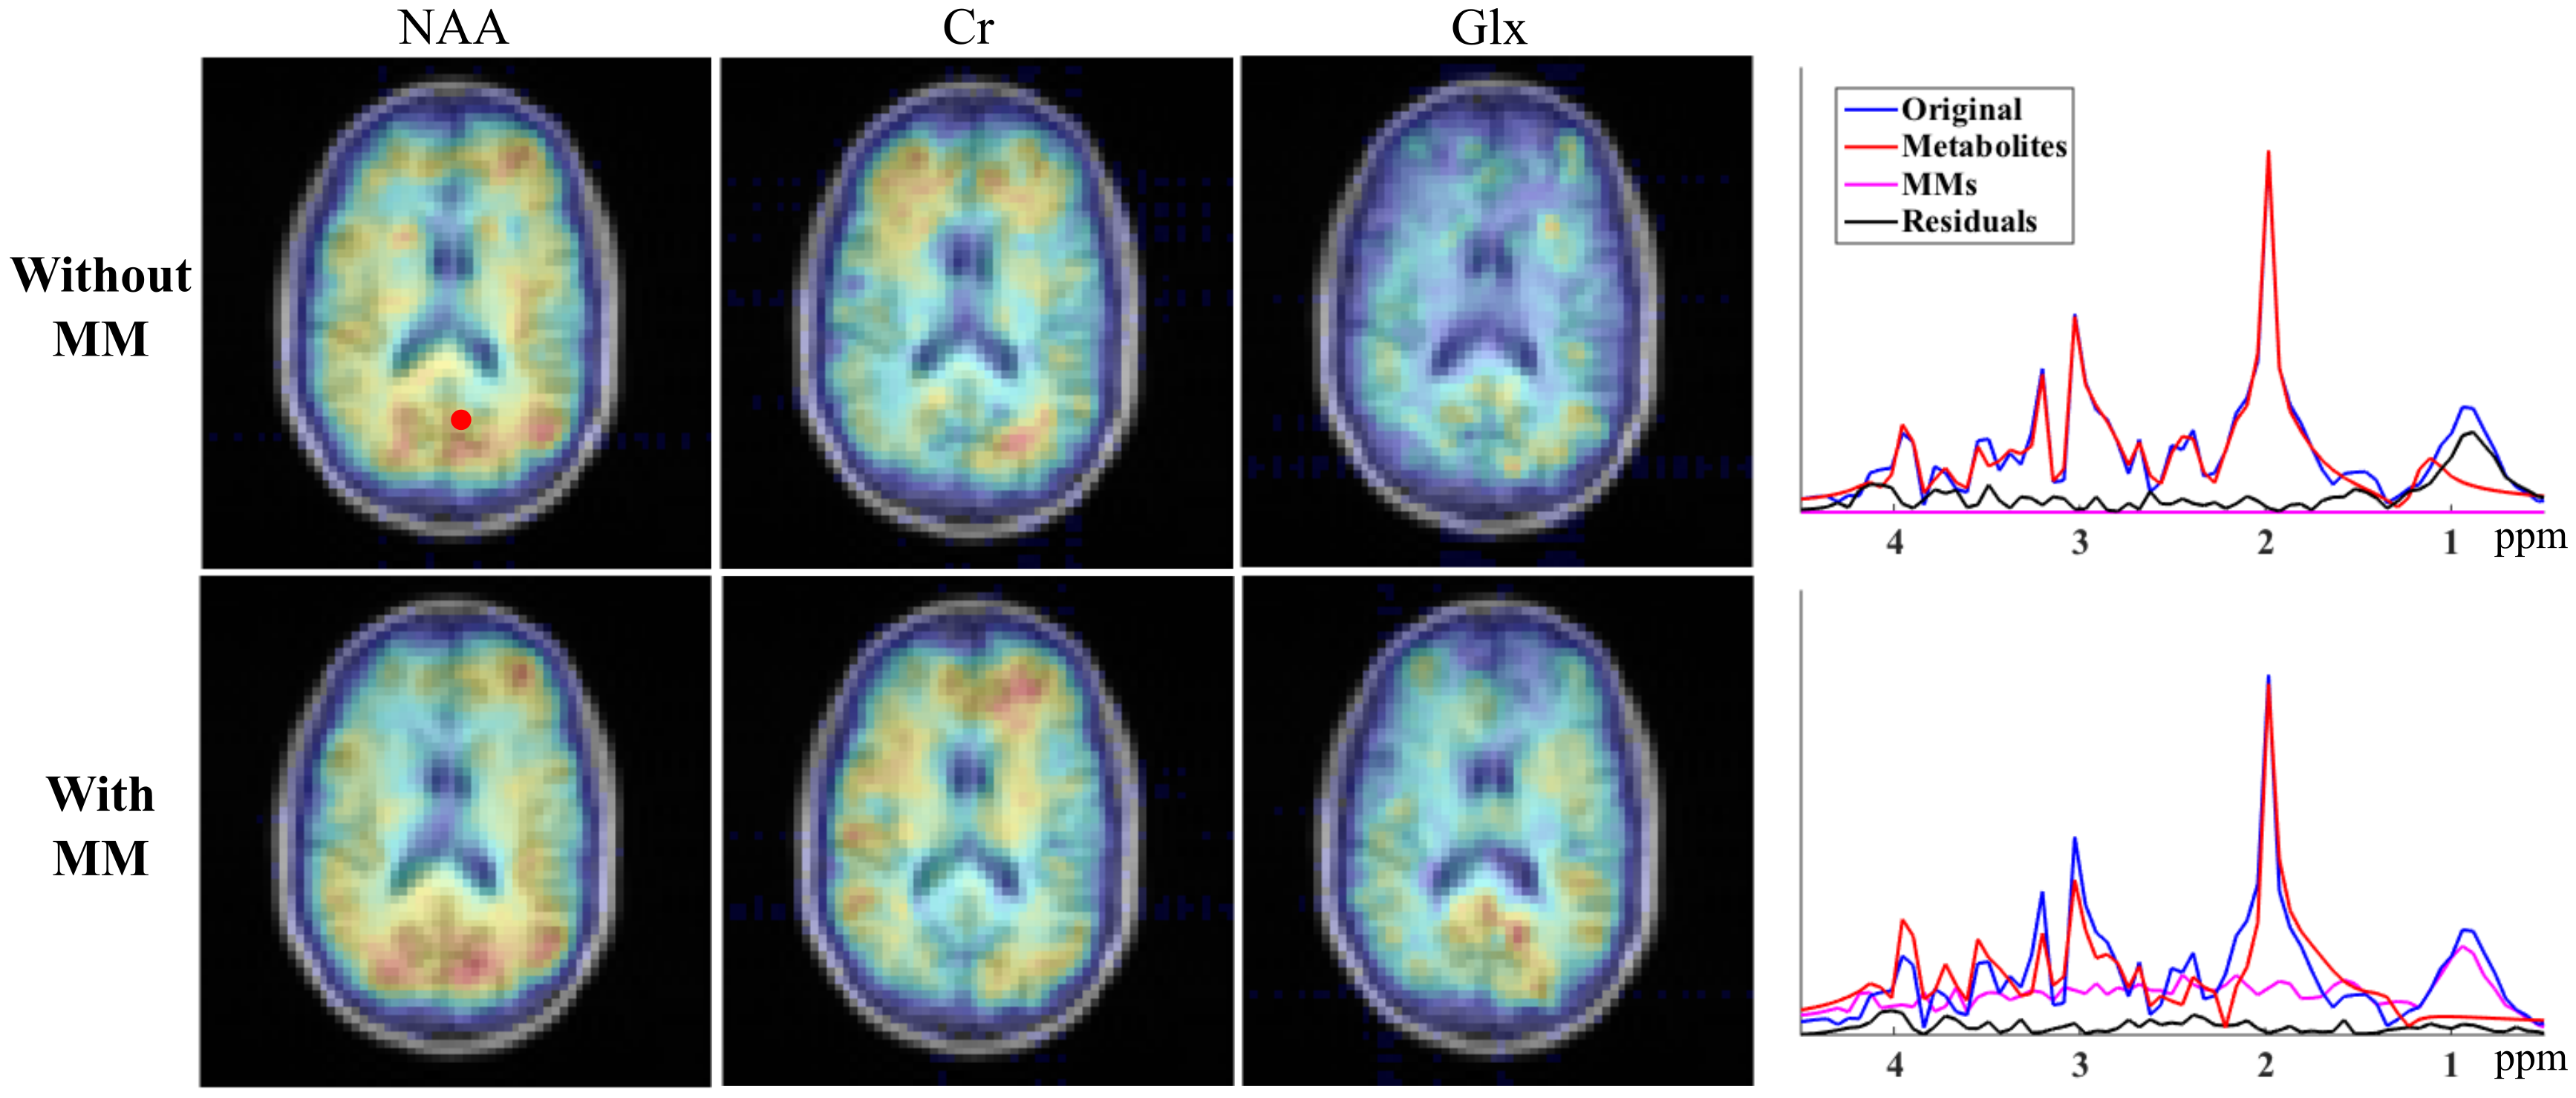
where $$$\left\{b_{l}(.)\right\}$$$ denotes the spatially-dependent coefficients and $$$\delta f_m(\mathbf{r})$$$ accounts for residual frequency discrepancy. Figure 4 compares the quantified metabolite maps with and without $$$\left\{v_l(t)\right\}$$$. As can be seen, incorporating MM bases leads to higher-quality metabolite maps with less spatial variation. We note that the 800ms TR, chosen to match the IR acquisition, can be shortened significantly for the proposed method. MM maps and spectra from different subjects are shown in Fig. 5.
Conclusion
We have presented a novel method for macromolecule mapping, integrating FID-based ultrashort-TE acquisition and a GS-based metabolite extrapolation. Experimental results demonstrate that the proposed method produces MM spatiospectral distribution consistent with those from an IR-based method but offers more flexibility in acquisition. Better quantification results can be obtained by incorporating the estimated MM signals in the form of a set of bases, which are stable across different subjects.Acknowledgements
This work was supported in part by the following research grants: NIH-R21-EB021013-01 and NIH-1RO1-EB013695, and a Beckman Institute Postdoctoral Fellowship.References
[1] Behar KL, Rothman DL, Spencer DD, and Petroff OA, Analysis of macromolecule resonances in 1H NMR spectra of human brain. Magn. Reson. Med., 1994;32:294-302.
[2] Cudalbu C, Mlynarik V, and Gruetter R, Handling macromolecule signals in the quantification of the neurochemical profile. J. Alzheimers Dis., 2012;31:S101-115.
[3] Povazan M, Hangel G, Strasser B, Gruber S, Chmelik M, Trattnig S, and Bogner W, Mapping of brain macromolecules and their use for spectral processing of 1H-MRSI data with an ultra-short acquisition delay at 7T. NeuroImage, 2015;121:126-135.
[4] Seeger U, Klose U, Mader I, Grodd W, and Nagele T, Parameterized evaluation of macromolecules and lipids in proton MR spectroscopy of brain diseases. Magn. Reson. Med., 2003;49:19-28.
[5] Ratiney H, Coenradie Y, Cavassila S, van Ormondt D, and Graveron-Demilly D, Time-domain quantitation of 1H short echo-time signals: Background accommodation. Magn. Reson. Mater. Phys. Biol. Med., 2004;16:284-296.
[6] Liang ZP and Lauterbur PC, An efficient method for dynamic magnetic resonance imaging. IEEE Trans. Med. Imag., 1994;13:677-686.
[7] Ma C, Lam F, Johnson CL, and Liang ZP, Removal of nuisance signals from limited and sparse 1H MRSI data using a union-of-subspaces model. Magn. Reson. Med., 2016;75:488-497.
[8] Peng X, Nguyen H, Haldar JP, Hernando D, Wang XP, and Liang ZP, Correction of field inhomogeneity effects on limited k-space MRSI data using anatomical constraints. Proc. IEEE Eng. Med. Biol. Soc., 2010, pp. 883-886.Figures