5517
Low-Rank TGV Reconstruction of High-Resolution 1H-FID-MRSI of whole brain slices1Department of Radiology and Medical Informatics, University of Geneva, Geneva, Switzerland, 2Institute of Bioengineering, École Polytechnique Fédérale de Lausanne, Lausanne, Switzerland
Synopsis
High resolution MRSI data were acquired with 2D FID-MRSI at 3T and a post-processing including lipid suppression, low-rank approximation and TGV-reconstruction is proposed. The resulting metabolic images of tNAA, tCre, Cho, Ins and Glx showed a substantial gain in quality, CRLB values associated and the SNR. This effect was particularly marked for lower signal metabolite: Ins and Glx. In addition, the proposed post-processing reconstructed efficiently under-sampled data allowing a 2- or 4-fold acquisition acceleration.
Introduction
High-resolution FID-MRSI sequences proved to be particularly efficient to detect metabolic profiles across the whole brain.1-3 Combining the advantages of a ultra shot echo time and no Chemical Shift Displacement Error, the technique provides an unbiased characterization of the metabolite distribution. Moreover, the simple design of the sequence permits to use optimal Ernst flip angle and therefore allows to reduce TR and acquisition time correspondingly. FID-MRSI sequence, however, does not include volume selection to fully prevent leakage of lipid signal from the skull. Outer volume suppression (OVS) together with appropriate post-processings3-5 provide efficient way to decontaminate metabolic signal from the lipids. One remaining open problem at high-resolution is the low metabolic signal-to-noise resulting from the small voxel volume (<0.1ml). It has been shown that MRSI datasets can be denoised using partial separability of the data6 and that MRI data can be reconstructed using a TGV regularization.7 The objective of this research is to optimize a post-processing pipeline including lipid suppression, data denoising and reconstruction of high-resolution 2D FID-MRSI. The performance of the technique is assessed on metabolic images of tNAA (N-acetylaspartate and N-acetylaspartylglutamate), tCre (total creatine), Cho (choline-containing compounds), Ins (myo-inositol) and Glx (glutamate and glutamine), and their respective Cramer-Rao lower bound (CRLB) values. In addition, performances of the reconstruction for 50% and 25% undersampled data are also evaluated.Method
Sequence:
A slice selective high resolution 2D FID-MRSI1 included WET water suppression, 8 OVS was implemented. TE was reduced to 1.6ms and FID signal was acquired with 1024 points at 4000Hz leading to TR of 460ms. Considering an average metabolite T1 value of 1300ms, the Ernst angle for the excitation pulse was set to 45 degree.
Experiment:
MRSI Data were acquired with a 3T scanner (Prisma/Siemens/Erlangen/Germany) with a 20-channel receiver headcoil. Structural images were obtained with a 3D-T1-weighted MPRAGE. The FID-MRSI was planned on three 10mm-thick axial slices. Elliptical 64x64 encoding over a FOV of 200x200mm resulted in voxel size of 0.098ml and acquisition duration of 24min per slice. A B0-field map was also acquired for post-processing needs.
Lipid Suppression:
Similarly to the work of Bilgic
et al.4,
a temporal basis was constructed using lipid signal located at
the skull. With this basis, a projector onto the lipid temporal
subspace
$$$P^L(s,t)$$$ was defined. MRSI dataset in k-space, noted
$$$S(\mathbf{k},t)$$$ was
then projected in the lipid subspace to determine the lipid component
$$$S_{lipid}(\mathbf{k},t)$$$
and lipid-free component
$$$S_{free}(\mathbf{k},t)$$$ by subtraction:$$\:S_{lipid}(\mathbf{k},t)=\int P^{L}(t,t')S(\mathbf{k}, t' ) dt',\:\:S_{free}(\mathbf{k},t)=S(\mathbf{k},t)-S_{lipid}(\mathbf{k},t)$$
Low-Rank approximation and TGV Reconstruction:
The remaining non-lipid signal of the MRSI dataset was assumed to be partially separable to the $$$N_S$$$-th order and could be expressed by6
$$S_{free}(\mathbf{k},t)\approx\sum_n^{N_S}R_n(\mathbf{k})F_n(t)$$
Because of the randomness, noise cannot be separated and this low-rank approximation (LRA) results in a first denoising step. Further, the real-space components of the MRSI dataset $$$r_n (\mathbf{r})$$$ were reconstructed with a TGV regularization7:
$$r_n=\arg\min_{\:r_n}\:\:\left\|R_n-\mathscr{F}\{r_n\}\right\|^2_{\mathbf{k}\in acquired}+\lambda\:TGV(r_n)$$
with $$$\mathscr{F}\{\}$$$being the spatial Fourier transform operator. The reconstructed denoised resulting dataset is then
$$\sum_n^{N_s}r_n(\mathbf{r})F_n(t)=\tilde{S}(\mathbf{r},t)$$
Quantification and comparison:
$$$\tilde{S}(\mathbf{r},t)$$$ was quantified with LCModel8 using a simulated basis. The CRLB values of tNAA, tCre, Cho, Ins and Glx were compared for two different post-processing pipeline: the complete pipeline including lipid suppression, LRA denoising and TGV reconstruction and the short pipeline including the lipid suppression and inverse spatial Fourier transform only. This efficiency of the TGV reconstruction was also observed by running the complete pipeline on randomly undersampled data by $$$50\%$$$ and $$$25\%$$$.
Results
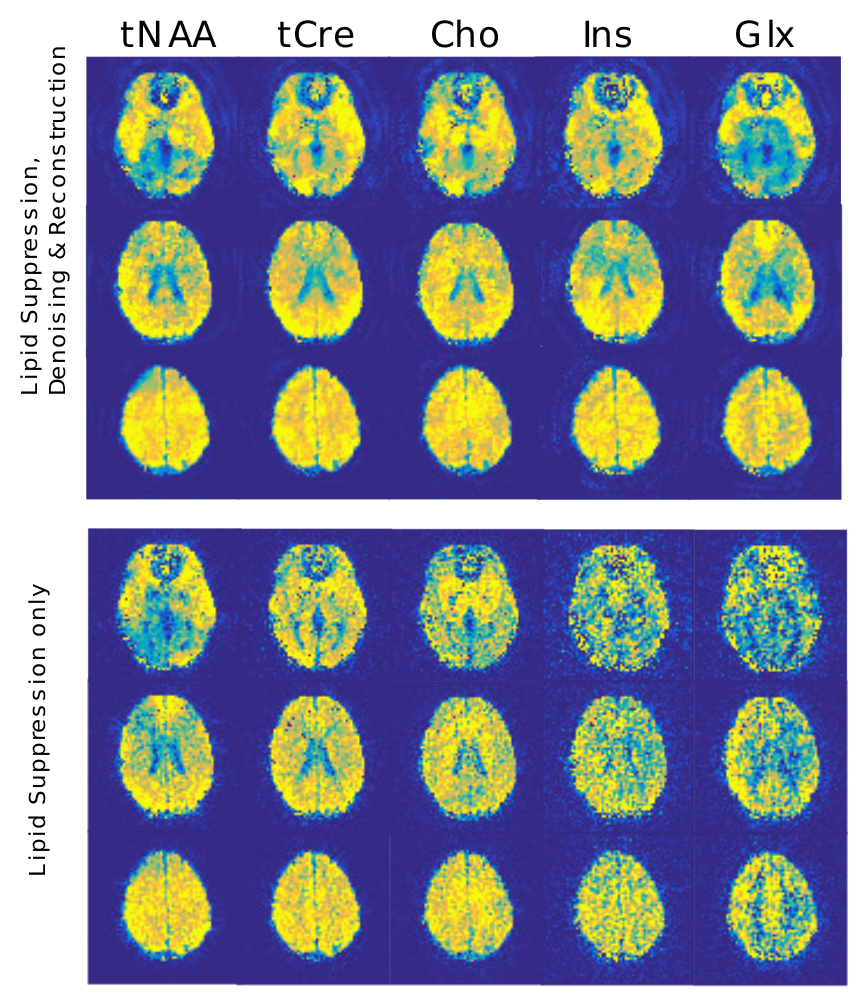
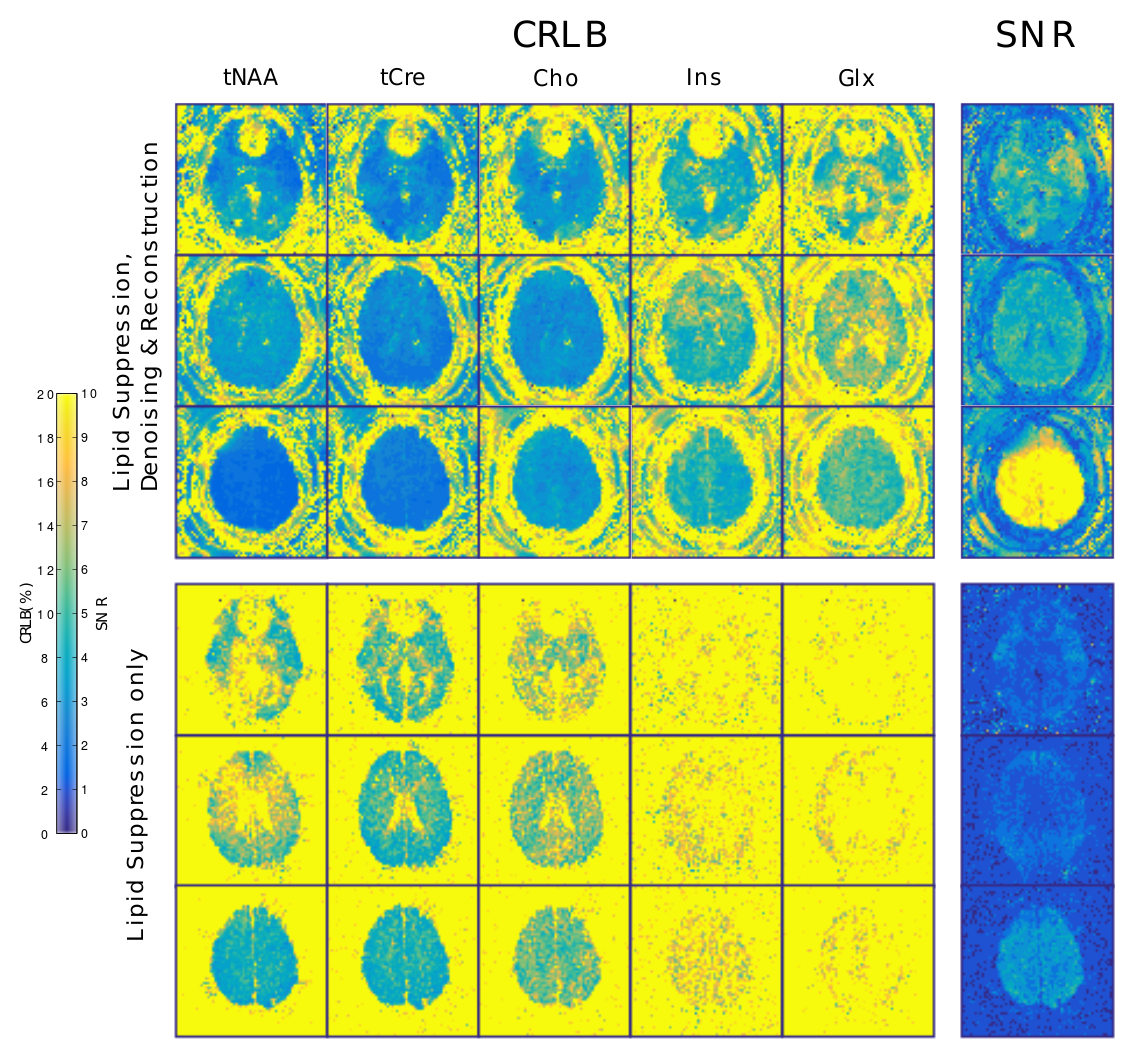
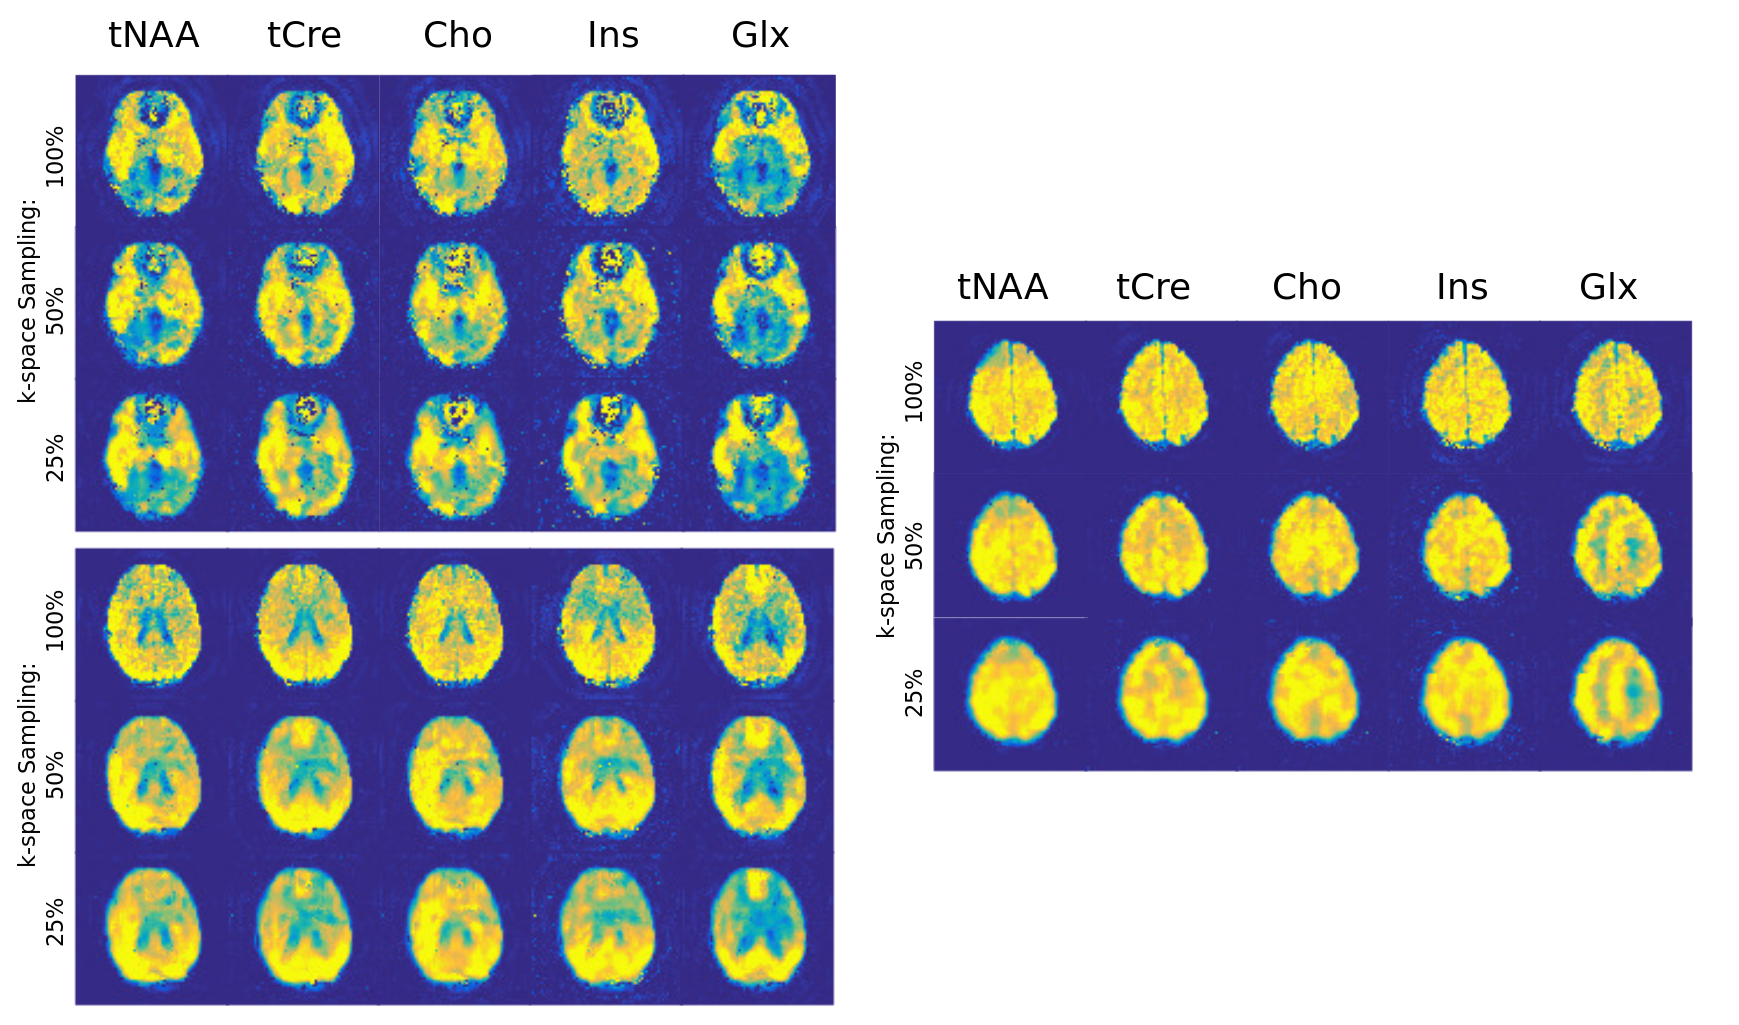
In Fig.1, metabolic images, results from the complete pipeline are shown in comparison with short pipeline. The differences are the most pronounced for the metabolite with low signal: Ins and Glx. In Fig.2, CRLB values resulting from LCModel fitting and the signal-to-noise ratio (SNR) estimates by LCModel are shown for both pipelines. Both CRLB and SNR are sensibly improved by LRA denoising. Fig.3 illustrates the compressed sensing performances of the complete pipeline intrinsic to the TGV-reconstruction. While acceleration factor of 2 and 4 (50% and 25% random undersampling) are applied, incoherent artifacts are absent and metabolic distributions are preserved.Conclusion:
The qualitative comparison of the metabolic images between post-processing pipelines including only lipid suppression and inverse Fourier transform or lipid suppression, LRA and TGV-reconstruction, shows a substantial gain in the quality of the metabolic images, CRLB values associated and SNR. This was particularly marked for lower signal metabolite: Ins and Glx. In addition, the proposed post-processing pipeline reconstructed efficiently under-sampled data allowing acquisition acceleration. A quantitative comparison shall be carried on each step separately and for different parameters values to provide more accurate information on the improvements.Acknowledgements
No acknowledgement found.References
[1] Henning, A., Fuchs, A., Murdoch, J.B. and Boesiger, P. (2009). Slice-selective FID acquisition, localized by outer volume suppression (FIDLOVS) for (1)H-MRSI of the human brain at 7 T with minimal signal loss. NMR Biomed 22, 683-696.
[2] Bogner, W., Gruber, S., Trattnig, S. and Chmelik, M. (2012). High-resolution mapping of human brain metabolites by free induction decay (1)H MRSI at 7 T. NMR Biomed 25, 873-882.
[3] Bogner, W., Strasser, B., Povazan, M., Hingerl, L., Chmelik, M., Gruber, S., Trattnig, S., Bogner, W. (2012). Metabolic mapping of the brain using ultra-high resolution MRSI at 7 T. (2016) ISMRM 24th Annual Meeting, #0387.
[4] Bilgic, B., Gagoski, B., Kok, T. and Adalsteinsson, E. (2013) Magn Reson Med 69, 1501-1511
[5] Klauser, A., Kasten, J., Van De Ville, D. ,Lazeyras, F. (2016). High Definition 2D MRSI of a Whole Brain Slice with Sparse k-space Sampling. (2016) ESMRMB 33rd Annual Scientific Meeting, preceeding #221
[6] Nguyen, H.M., Peng, X., Do, M.N. and Liang, Z. (2013). Denoising MR spectroscopic imaging data with low-rank approximations. IEEE Trans Biomed Eng 60, 78-89.
[7] Florian Knoll, Kristian Bredies, Thomas Pock and Rudolf Stollberger (2011). Second order total generalized variation (TGV) for MRI. Magn Reson Med 65(2), 480-491.
[8] Provencher, S.W. (1993). Estimation of metabolite concentrations from localized in vivo proton NMR spectra. Magn Reson Med 30, 672-679.
Figures