5516
Evaluation of Compressed Sensing reconstructions of 3D Echo Planar Spectroscopic Imaging using TV, Wavelet-$$$\ell_{1}$$$, and TV+Wavelet-$$$\ell_{1}$$$ based regularization.1Radiological Sciences, University of California, Los Angeles, Los Angeles, CA, United States
Synopsis
Magnetic Resonance Spectroscopic Imaging (MRSI) is a valuable tool to characterize metabolic concentrations and changes in several spatial locations in a single recording. However, the long acquisition time of conventional three-dimensional (3D) MRSI limits its practical application. Non-uniformly sampled 3D echo planar spectroscopic imaging (EPSI) has been proposed to accelerate the scan time, combined with compressed sensing (CS) to retain reconstruction fidelity. We apply the novel approach of reconstructing 3D EPSI data by applying TV, Wavelet-$$$\ell_{1}$$$, and TV + Wavelet-$$$\ell_{1}$$$ CS-based regularization on both the combined spectral and two undersampled spatial dimensions. These three reconstruction methods were evaluated in both simulated and in retrospectively undersampled data of a brain phantom.
Introduction
Magnetic Resonance Spectroscopic Imaging (MRSI) is a valuable tool to characterize metabolic concentrations and changes in several spatial locations from a single recording. However, the long acquisition time of conventional three-dimensional (3D) MRSI limits its practical application. 3D Echo Planar spectroscopic imaging (EPSI) significantly reduces the scan time by simultaneously encoding one spatial and spectral dimension1 (x-f plane), but it comes at the cost of decreased sensitivity compared to conventional MRSI and is still limited by the inherently slow phase-encoding along the ky, kz dimensions2 . Compressed sensing (CS) reconstruction has been applied to further reduce the scan time in MRSI, and is well-suited for the low-sensitivity of EPSI data due to its intrinsic denoising effect3. Previous methods have applied total variation (TV), Wavelet-$$$\ell_{1}$$$, or a combination of TV and Wavelet-$$$\ell_{1}$$$ based regularization to reconstruct non-uniformly undersampled (NUS) data in 2D MRSI acquisitions4,5,6. In this study, we apply a novel approach in reconstructing 3D EPSI data, in which both the TV and/or wavelet transforms are applied on the combined set of spectral and undersampled spatial data (y-z-f). We compare these three types regularization techniques, and results are evaluated in both simulated and in retrospectively undersampled 3D EPSI data of a brain phantom.Materials and Methods
CS reconstruction was performed using the Split-Bregman7 algorithm with three different types of sparsifying transforms applied on the y-z-f space for each point along the readout direction x, namely TV-, Wavelet-$$$\ell_{1}$$$-, and TV+Wavelet-$$$\ell_{1}$$$-based regularization. In addition to spatial sparsity, this approach exploits the increased sparsity available in the spectral domain with respect to the TV and/or wavelet transforms. The minimization is cast as $$ \min_{u} \mu\frac{1}{2}∥Fu−y∥^{2}_{2}+λTV(u)+γ∥Wu∥_{1} \quad \text{subject to} \quad ∥Fu−y∥^{2}_{2}<σ^{2}$$ where $$$ F $$$ is the undersampled Fourier transform, $$$ u $$$ is the desired data in y-z-f space, $$$ y $$$ is the acquired data in ky-kz-t, W is the wavelet transform (Daubechies 4, level 5), and $$$ \sigma $$$ is an estimate of the noise. The parameters $$$ \lambda $$$ and $$$ \gamma $$$ are set to zero to remove the $$$ TV $$$ or $$$ \|W \cdot \|_{1} $$$ regularization terms, respectively. Each reconstruction was run for 300 iterations or until the stopping criterion was satisfied. The regularization parameters were scaled according to the undersampled data, with the ratios $$$\mu:\lambda:\gamma \approx 1:0.01:0.01. $$$
A 3D EPSI sequence was used to acquire a fully sampled brain phantom data set on a 3T scanner with the following parameters: FOV = 240×240×120 mm3 , matrix = 32×32×8, spectral bandwidth = 1190 Hz, number of spectral points = 256, TE = 41ms, TR = 1.5s, number of averages = 8. This data was retrospectively undersampled along the spatial ky-kz dimensions at acceleration factors of 2x, 3x, 4x, and 5x. A 3D virtual phantom was created using a 32×32×8 Shepp-Logan spatial profile, in which each voxel contained a 256-length FID generated using the GAMMA library8. Simulated metabolites included NAA, Cr3.0, Ch, Glx, mI, and Cr3.9. This virtual data was undersampled at 2x, 3x, 4x, and 5x.
Reconstruction performance was quantified using the normalized root-mean-square error (nRMSE) of metabolite concentrations and ratios, and was qualitatively evaluated with comparisons of spatial maps and spectra.
Results
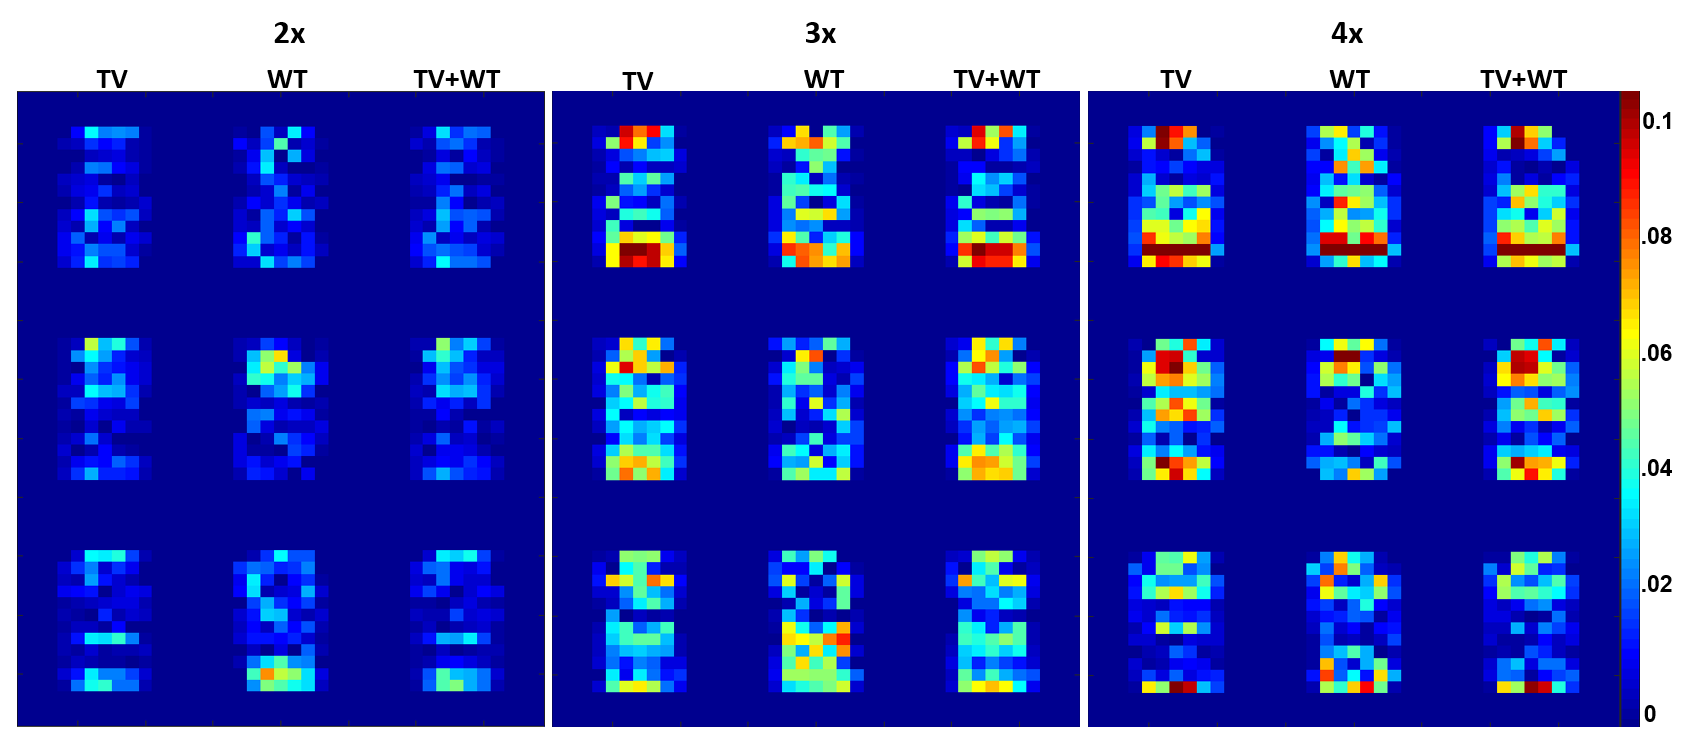
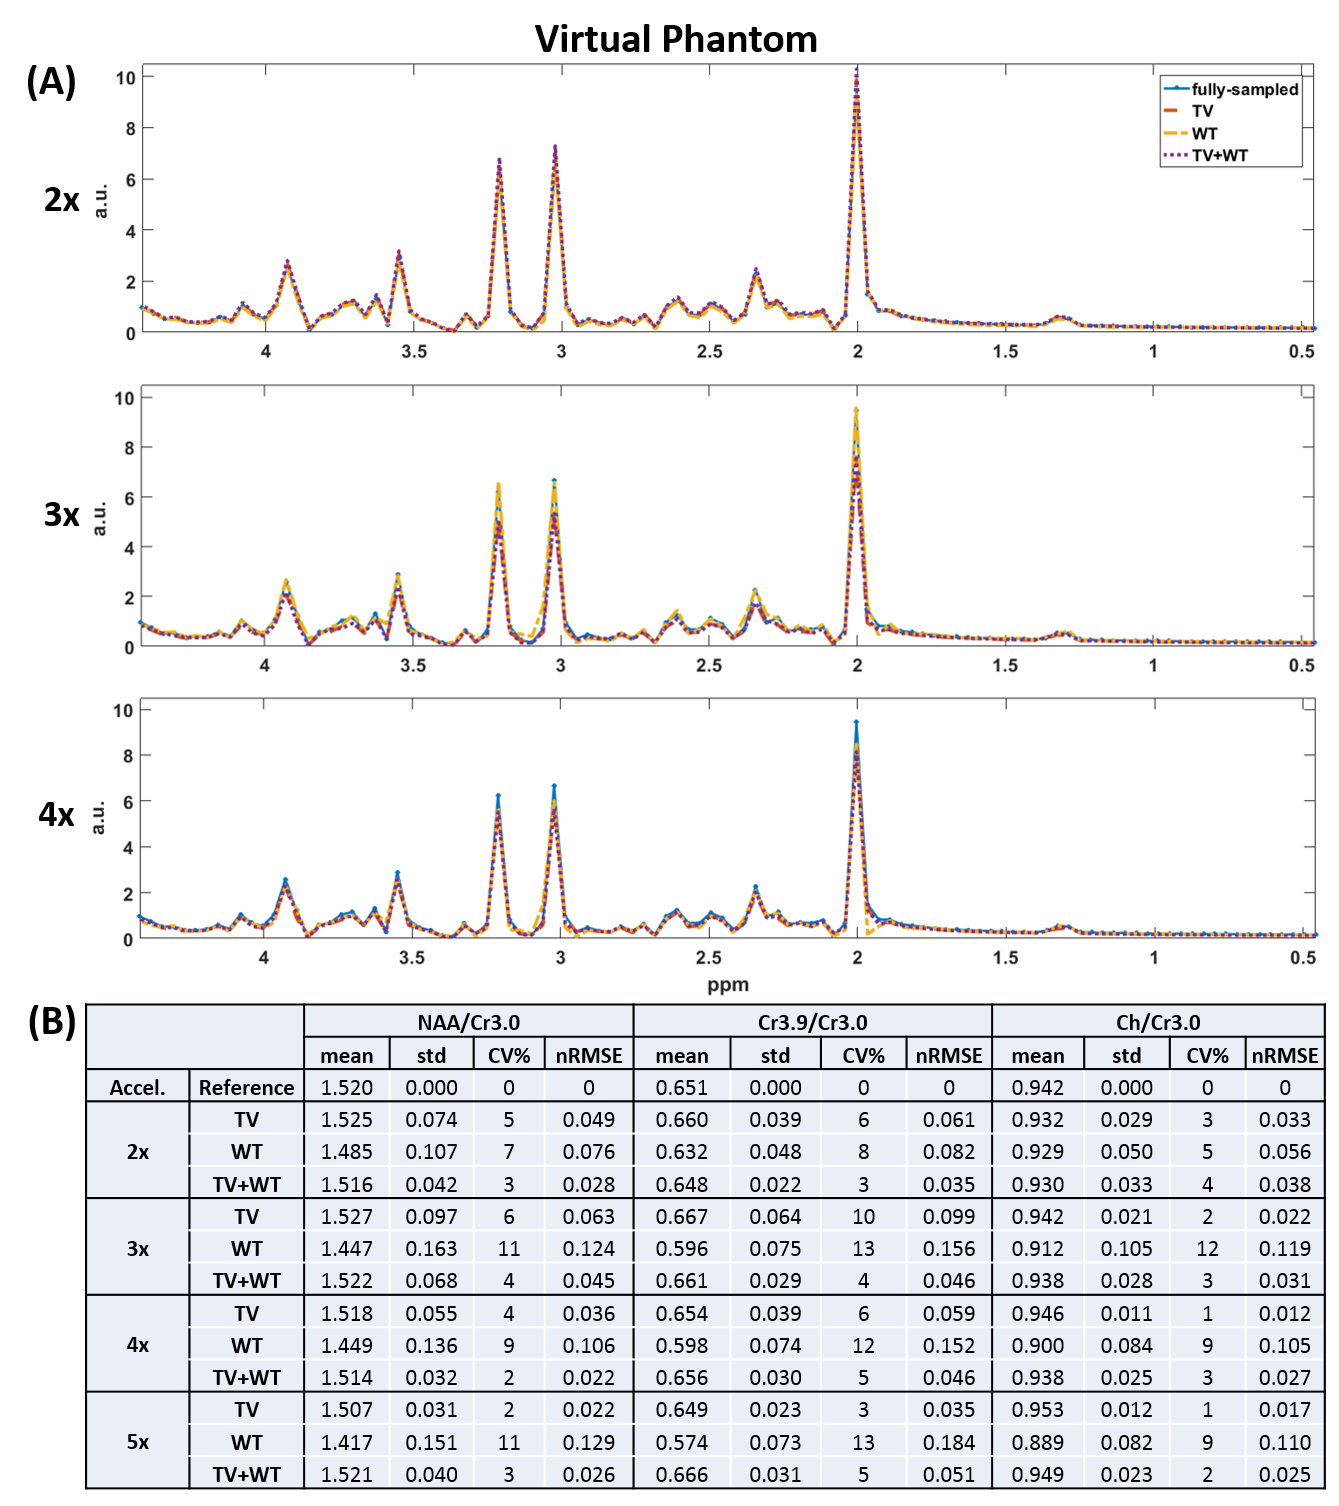
NAA metabolite maps computed from retrospective reconstructions are shown in Figure 1. Figure 2 shows the corresponding nRMSE maps. Figures 3 and 4 display the mean, standard deviation, coefficient of variation, and nRMSE values for the reconstructed metabolite ratios NAA/Cr3.0, Cr3.9/Cr3.0, and Ch/Cr3.0, as well as reconstructed spectra from the virtual and brain phantoms, respectively.Discussion
This study evaluates the novel approach of reconstructing 3D EPSI data by applying the TV and wavelet transforms on the three-dimension spectral-spatial set y-z-f, in which y-z are the undersampled dimensions. Results from the reconstructed spectra, metabolite ratios, and spatial metabolite maps generally indicate that Wavelet-$$$\ell_{1}$$$ regularization performs less optimally than regularization involving the TV term. As seen in Figures 3 and 4, the combination of TV + Wavelet-$$$\ell_{1}$$$ leads to lower nRMSE values in comparison to TV alone, while Wavelet-$$$ \ell_{1} $$$ regularization retains higher nRMSE's. The spectral quality and accuracy of metabolite maps are consistent with these trends. Both TV and TV + Wavelet-$$$\ell_{1}$$$ methods produce similar results, though the latter is more robust to higher acceleration factors, as indicated in Figures 3 and 4.
Conclusion
Preliminary results show that the approach of including the spectral dimension in the reconstruction from 3D EPSI can produce viable MRSI spectra. The combination of TV and wavelet transforms is either equivalent or performs slightly better in terms of nRMSE than regularization based solely on TV.Acknowledgements
Grant support: NIH/NIBIB-1R21EB020883-01A1References
1. Mansfield P. Spatial mapping of the chemical shift in NMR. Magnetic Resonance in Medicine, 1984; 1(3): 370-386.
2. Posse S. et al. High Speed 1H Spectroscopic Imaging in Human Brain by Echo Planar Spatial-Spectral Encoding. Magnetic Resonance in Medicine, 1995; 33(1):34-40.
3. Furuyama JK, Wilson NE, Burns BL, Nagarajan R, Margolis DJ, Thomas MA. Application of Compressed Sensing to Multidimensional Spectroscopic Imaging in Human Prostate. Magnetic Resonance in Medicine, 2012; 67:1499-1505.
4. Cao P, Wu E. Accelerating Phase-Encoded Proton MR Spectroscopic Imaging by Compressed Sensing. Journal of Magnetic Resonance Imaging, 2015; 41:487-495.
5. Askin NC, Atis B, Ozturk-Isik E. Accelerated phosphorus magnetic resonance spectroscopic imaging using compressed sensing. 2012 Annual International Conference of the IEEE Engineering in Medicine and Biology Society, pp. 1106-1109, IEEE, 2012.
6. Geethanath S. et al. Compressive Sensing Could Accelerate 1H Metabolic Imaging in the Clinic. Radiology, 2012; 262(3): 985-994.
7. Goldstein T, Osher S. The Split Bregman Method for L1-Regularized Problems. SIAM J. Imaging Sciences, 2009; 2(2):323-343.
8. Smith S, Levante T, Meier BH, Ernst RR. Computer simulations in magnetic resonance. An object-oriented programming approach. Journal of Magnetic Resonance, Series A 1994; 106:75-105.
Figures