5514
semi-adiabatic SPECIAL-based 1H MRSI at 9.4T: Implementation and preliminary validation in a rat brain1Department of Biomedical Sciences, Seoul National University, Seoul, Korea, Republic of, 2Department of Radiology, Seoul National University Hospital, Seoul, Korea, Republic of, 3Department of Transdisciplinary Studies, Graduate School of Convergence Science and Technology, Seoul National University, Suwon, Korea, Republic of
Synopsis
Given the issues of chemical shift displacement error, B1 inhomogeneity and short T2 at high field, a semi-adiabatic SPECIAL-based MRSI sequence was implemented at 9.4T, which is equipped with a pair of broad-band hyperbolic secant adiabatic full passage pulses for refocusing, and yet, allows a minimum TE of as short as 4.98 ms. In phantom, the effect of the prolonged minimum TE on the J-evolution of coupled spins is negligible. In a rat brain, preliminary quantitative results are in close agreement with the previous results obtained by using single-voxel MRS.
Target Audience
Those who are interested in metabolite quantification using MRSI at high field.Purpose
In magnetic resonance spectroscopic imaging (MRSI), a PRESS-based volume-localization (PRESS-MRSI) is often used for effective outer volume suppression (OVS). However, at high field, the narrow-band refocusing pulses used therein are more subject to chemical shift displacement error (CSDE) and B1 inhomogeneity. The prolonged minimum echo time (TE) attainable due to the double-spin-echo nature of the approach is another important issue at high field in consideration of T2 relaxation and J-evolution of spin systems. Recently, the SPin-ECho, full Intensity Acquired Localized (SPECIAL1) sequence-based volume-localized MRSI (SPECIAL-MRSI) has been reported at 3.0T,2 which addresses the prolonged minimum TE issue by the single-spin-echo nature of the sequence. However, at high field, the CSDE and B1 inhomogeneity can still be problematic with this approach, which can also be addressed by replacing the narrow-band refocusing pulse with a pair of broad-band adiabatic refocusing pulses (semi-adiabatic SPECIAL) as previously demonstrated in single-voxel MRS,3 but not in MRSI at high field. The purpose of the study was to implement a semi-adiabatic SPECIAL-based MRSI (semi-SPECIAL-MRSI) sequence and demonstrate its performance at 9.4T.Methods
The animal study was approved by IACUC. All data were acquired on a 9.4T scanner with a 1H Tx/Rx surface coil (Agilent). A PRESS sequence (a MAO refocusing pulse; duration=1 ms, bandwidth=8 kHz) was modified to a PRESS-MRSI sequence. A SPECIAL sequence (a SLR refocusing pulse; duration=0.82 ms, bandwidth=7.8 kHz) was modified to a SPECIAL-MRSI and a semi-SPECIAL-MRSI sequences. For the semi-SPECIAL-MRSI sequence, a pair of broad-band hyperbolic secant adiabatic full passage (HS-AFP) pulses (duration=1 ms, bandwidth=16 kHz) were used for refocusing. The minimum TEs were 12.41, 3.30, and 4.98 ms for PRESS-, SPECIAL-, and semi-SPECIAL-MRSI sequences.
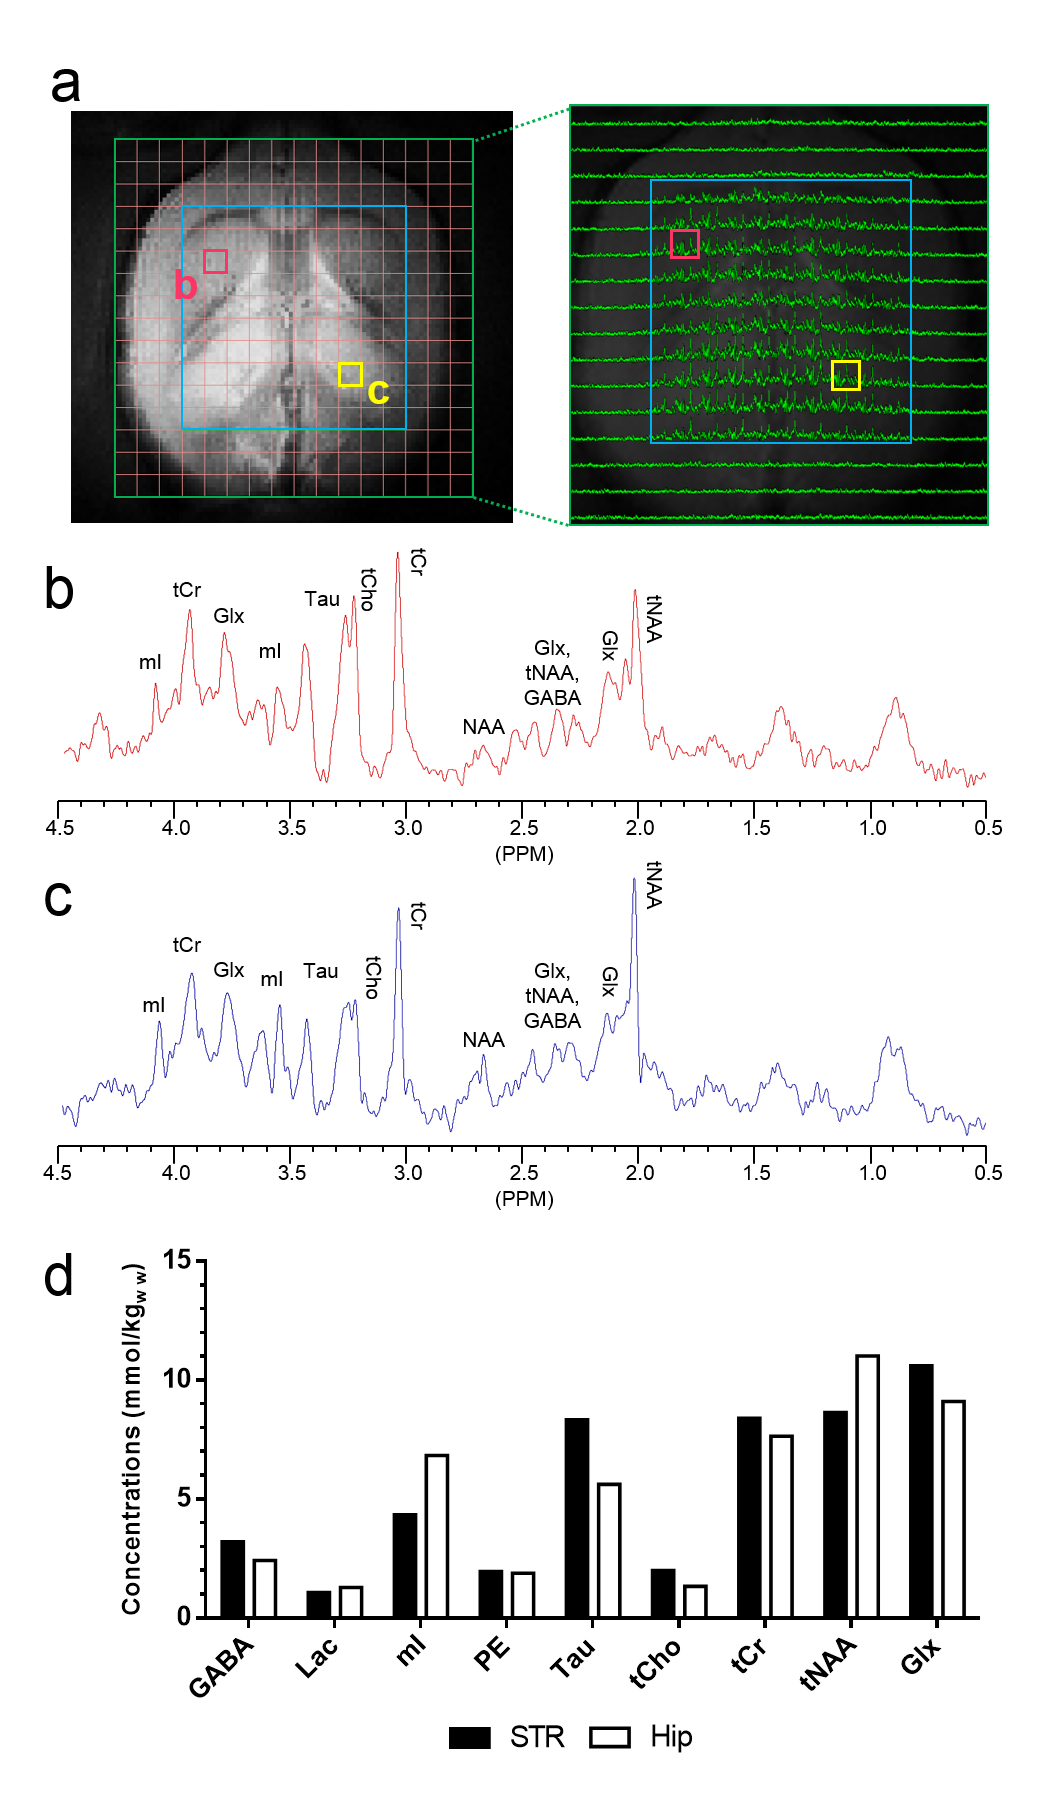
To investigate the impact of the different minimum TEs of the sequences on the J-evolution of coupled spins, spectra were collected from a phantom (an aqueous solution of Cr, GABA, Gln, Glu, mI, NAA, PCho and Tau) using all MRSI sequences in single-voxel MRS mode (i.e., without phase encoding). After acquisition of T2-weighted scout images, in vivo MRSI data were collected from a rat brain using semi-SPECIAL-MRSI (TR/TE=2000/4.98 ms, VOI size=10x10x2.5mm3, FOV=16x16 mm2, matrix size=16x16 (nominal voxel size=2.5mm3), and 16 signal averages). Two voxels in the imaging plane were selected, one from the striatum (STR) and the other from the hippocampus (Hip) for metabolite quantification. For these two voxels, water-unsuppressed spectra (2 signal averages) and metabolite-nulled spectra as a surrogate of spectral baseline (double inversion; TI1/TI2/TR=2830/680/4650ms, 160 signal averages) 4 were also acquired in single-voxel MRS mode for metabolite quantification.
Using the acquired MRSI data, individual metabolite maps were generated by peak integration (VNMRJ, Agilent). Those spectra from the STR and Hip were quantitatively analyzed using QUEST 5 with 19 simulated metabolite bases and the metabolite-nulled spectra.4
Results
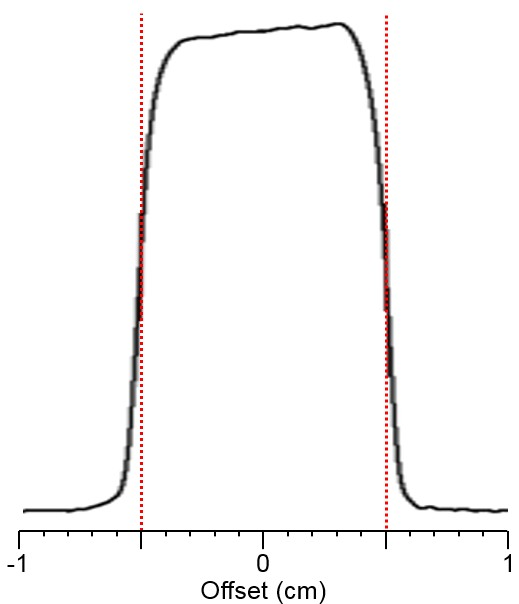
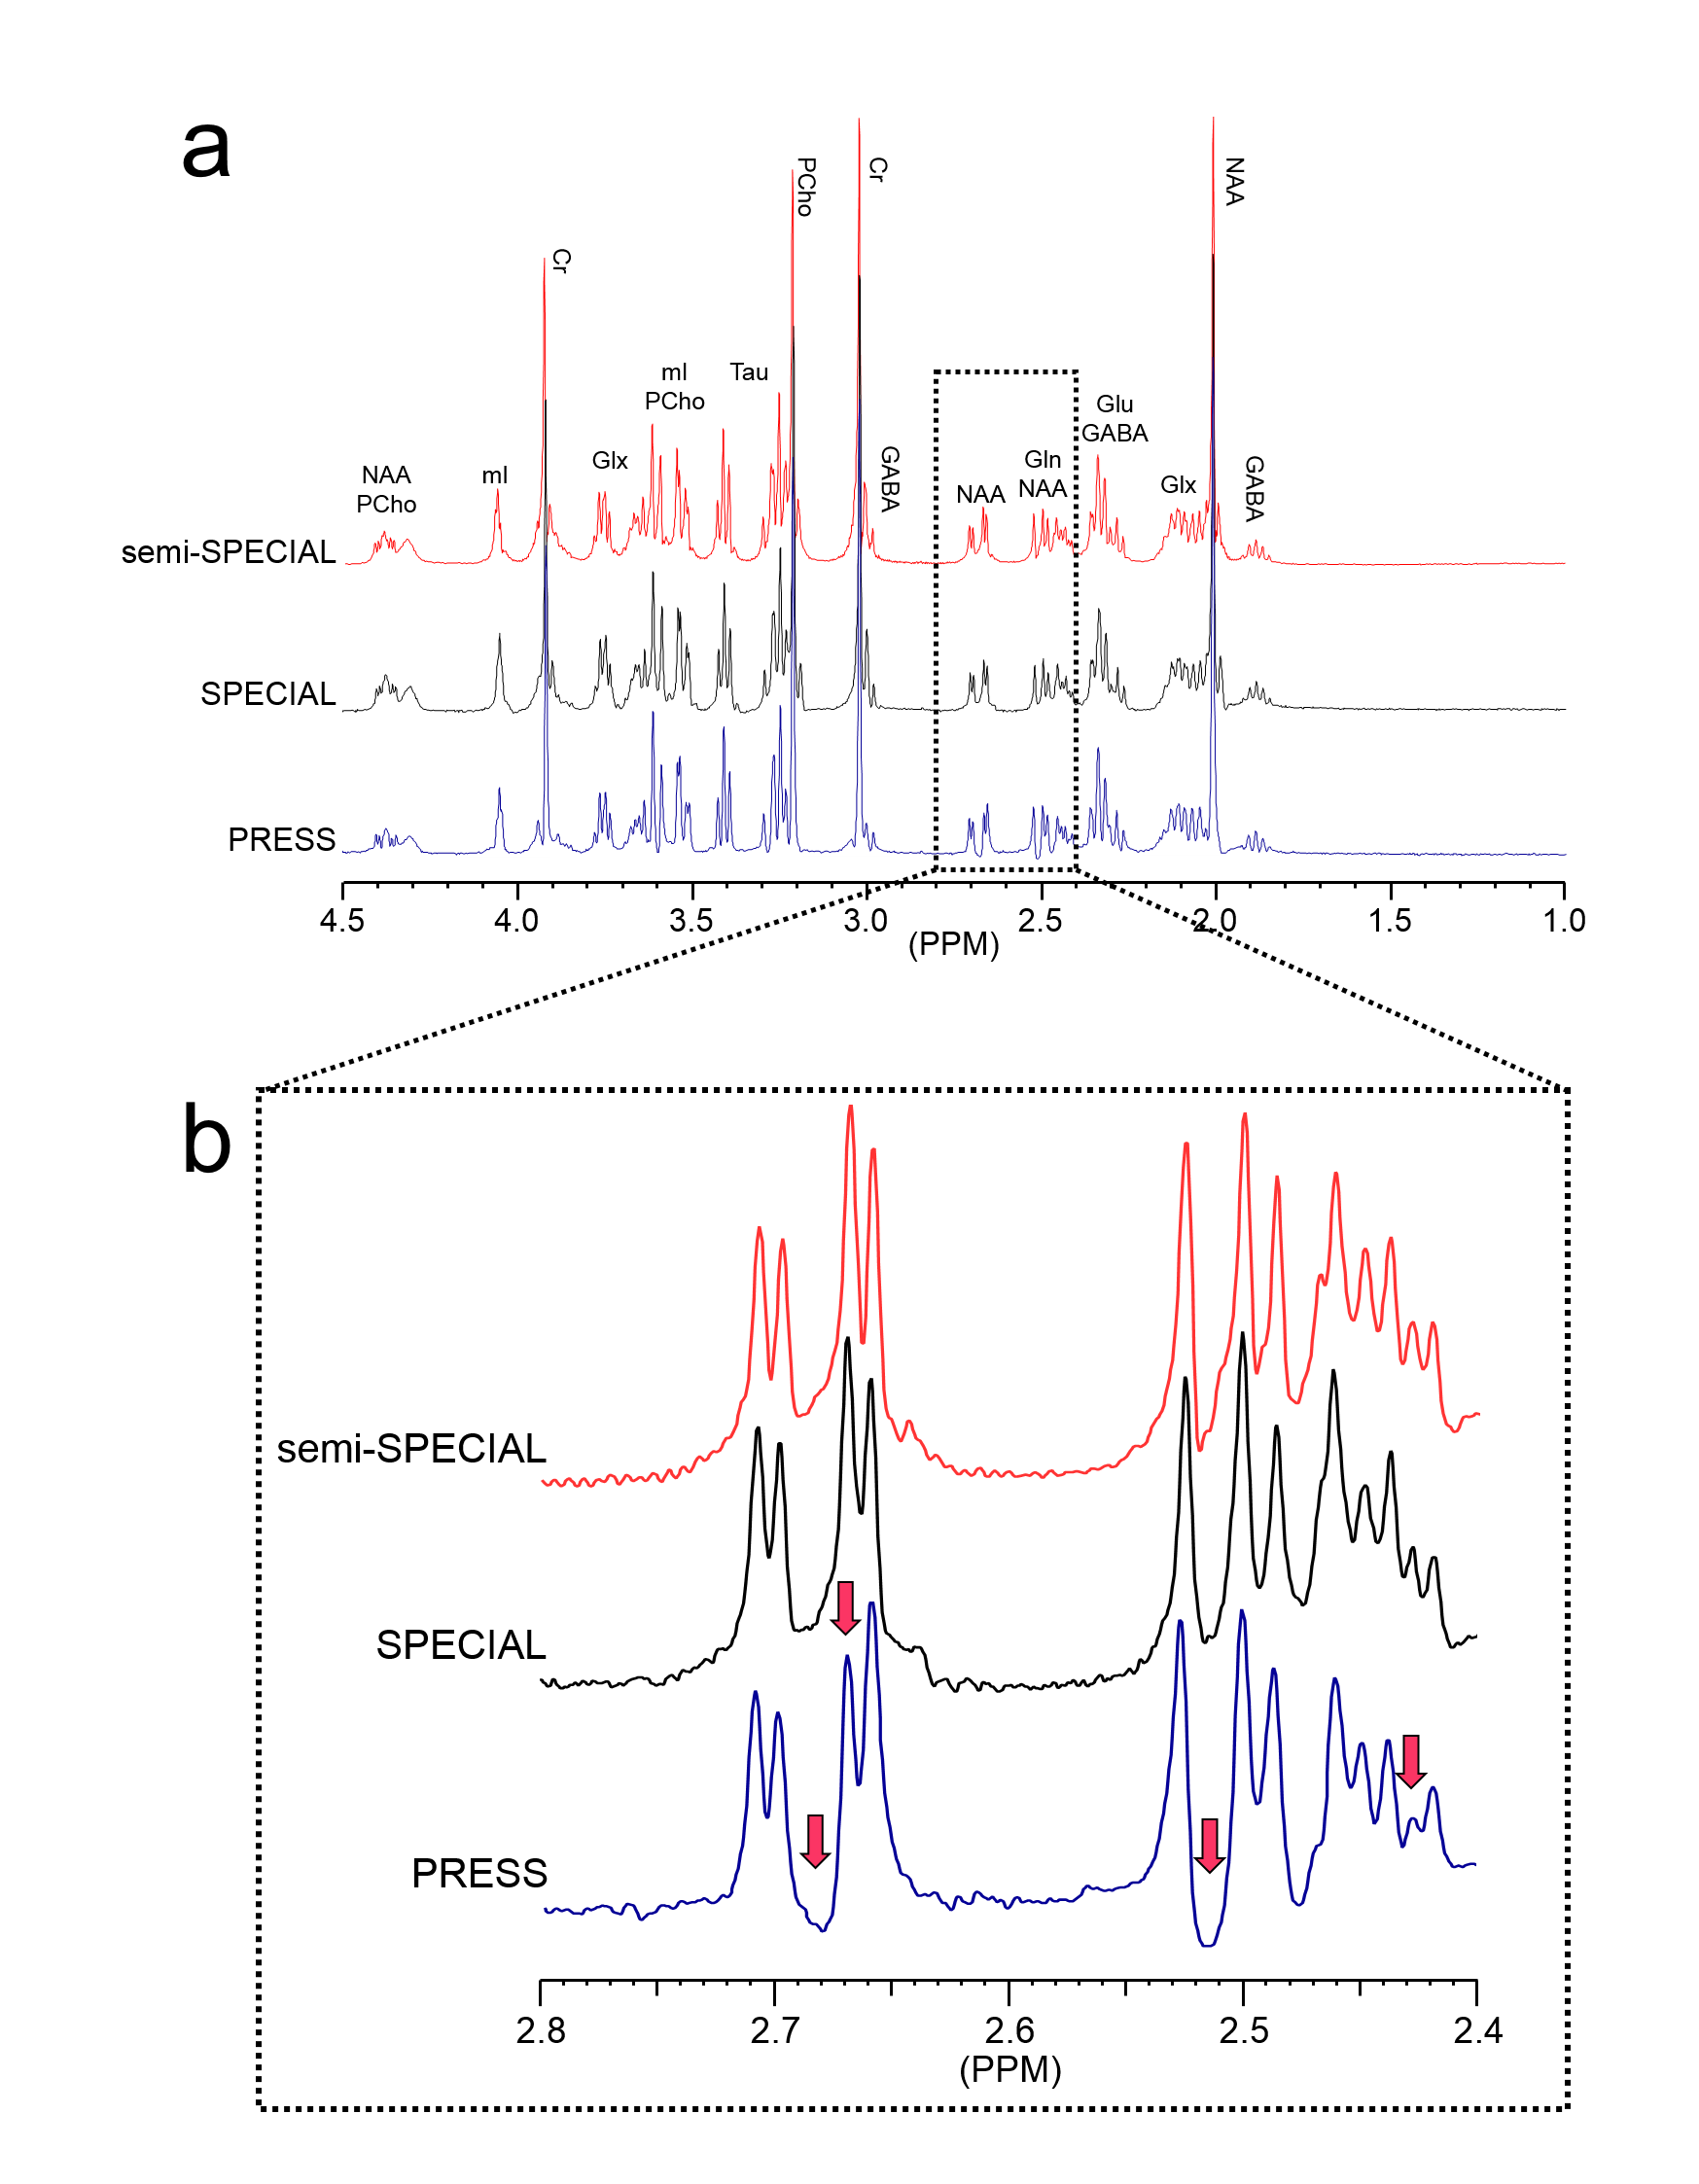
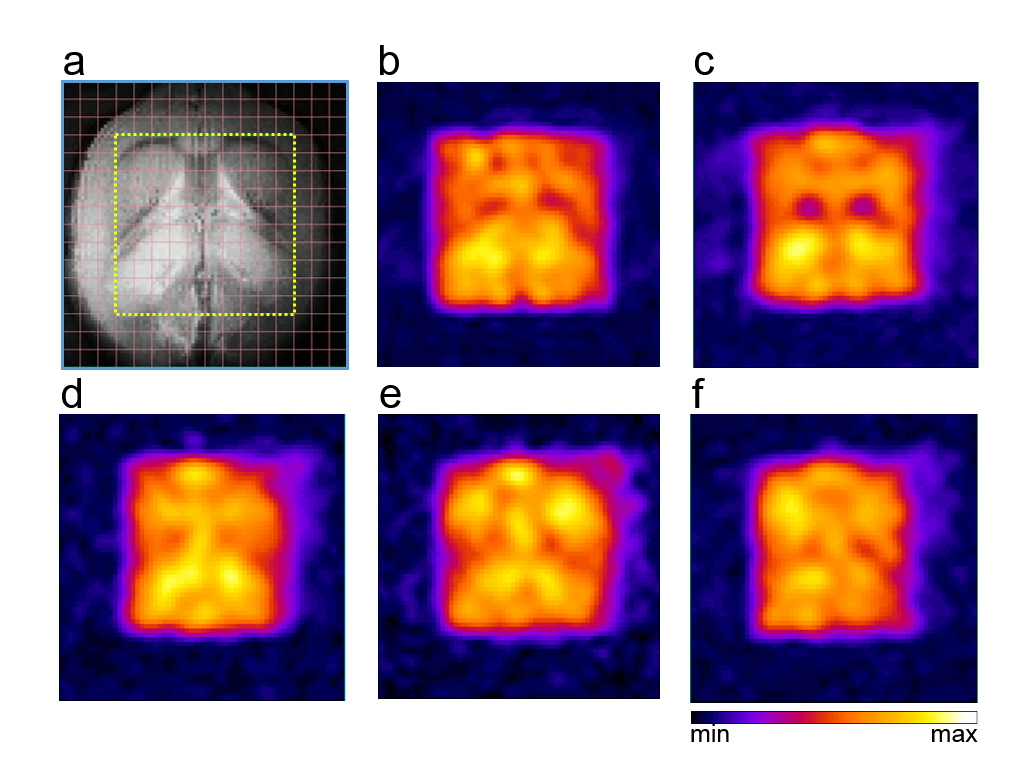
The slice profile of the broad-band HS-AFP refocusing pulses used in the semi-SPECIAL-MRSI is shown in Fig.1. In Fig.2, the non-negligible J-evolution of coupled spins is clearly shown in the PRESS-MRSI spectrum at TE=12.41 ms with respect to the SPECIAL-MRSI spectrum at TE=3.30 ms in the 2.4-2.8 ppm range. Such relative changes in the lineshape of coupled spins are not noticeable in the semi-SPECIAL-MRSI spectrum at TE=4.98 ms. In Fig.3, the metabolite maps obtained by the semi-SPECIAL-MRSI sequence are all quite symmetric in accordance with the anatomic image, with no evident spectral contamination. In Fig.4, the spectra with high SNR and resolution are shown for the voxels selected from the STR and Hip of a rat. The concentrations of mI and tNAA in the Hip are estimated to be higher than those in the STR. The Tau level in the Hip is lower than that in the STR. These findings are in line with the previous results obtained by using single-voxel MRS.6-7Discussion
The pair of broad-band AFP pulses in a semi-SPECIAL-MRSI sequence instead of the single narrow-band pulse in a SPECIAL-MRSI sequence for refocusing is advantageous in terms of CSDE and B1-inhomogeneity at high field. The resulting increase in the minimum TE from 3.30 to 4.98 ms gave rise to only minor changes in the lineshape of coupled spins. The resulting signal loss due to T2 relaxation should also be minor in vivo. In terms of minimum TE attainable, a semi-SPECIAL-MRSI sequence is also advantageous over a semi-LASER-based MRSI sequence at high field,8 in which two pairs of AFP pulses are used for refocusing.Conclusion
A semi-adiabatic SPECIAL-based MRSI is successfully implemented at 9.4T with its performance demonstrated in phantom and in vivo.Acknowledgements
This research was supported by Basic Science Research Program through the NRF of Korea funded by the Ministry of Education, Science and Technology (2013R1A1A2013516), and by the Bio & Medical Technology Development Program of the NRF funded by the Korean government, MSIP (NRF-2014M3A9B6069340).References
1. Mlynárik V, et al. Localized short-echo-time proton MR spectroscopy with full signal-intensity acquisition. MRM. 2006;56(5):965-970.
2. Mekle R, et al. 1H SPECIAL-MRSI at Ultra-Short TE: Improved Metabolite Detection for Multiple Voxels in Human Brain at 3T. In Proceedings of the 19th Annual Meeting of ISMRM, Montréal, Québec, Canada, 2011. Abstract 3422.
3. Xin L, et al. Proton T1 relaxation times of metabolites in human occipital white and gray matter at 7T. MRM. 2013;69(4): 931-936.
4. Heo H, et al. On the Utility of Short Echo Time (TE) Single Voxel 1H–MRS in Non–Invasive Detection of 2–Hydroxyglutarate (2HG); Challenges and Potential Improvement Illustrated with Animal Models Using MRUI and LCModel. PloS one. 2016;11(1): e0147794.
5. Ratiney H, et al. Time-domain quantitation of 1H short echo-time signals: background accommodation. MAGMA. 2004;16(6): 284-296.
6. Tkác I, et al. Developmental and regional changes in the neurochemical profile of the rat brain determined by in vivo 1H NMR spectroscopy. MRM. 2003;50(1): 24-32.
7. Choi I-Y, et al. Metabolism changes during aging in the hippocampus and striatum of glud1 (glutamate dehydrogenase 1) transgenic mice. Neurochem. Res. 2014;39(3):446-455.
8. Kim S, et al. Implementation and Comparison of LASER- and Semi-LASER-based MRSI Pulse Sequences at 9.4T. In Proceedings of the 23th Annual Meeting of ISMRM, Toronto, Ontario, Canada, 2015. Abstract 4708.
Figures