5512
Effects of Iron Content on J-edited 1H MRS Measures of Cortical Glutathione Investigated In Vivo with Quantitative Susceptibility Mapping (QSM)1Radiology, Weill Cornell Medicine, New York, NY, United States, 2Healthcare Policy and Research, Weill Cornell Medicine, New York, NY, United States
Synopsis
As the primary intracellular antioxidant, glutathione (GSH) is involved in free radical reactions in vivo involving paramagnetic iron II/III as catalysts or cofactors, suggesting that findings low tissue GSH by MRS could reflect T2 signal loss due to differences in iron content, rather than a genuine antioxidant deficit. This study estimated brain iron content using QSM to assess whether GSH deficits previously reported in patients with chronic fatigue syndrome (CFS) were genuine or simply a T2 signal loss. No iron content differences were found between patients and controls, supporting a genuine GSH deficit in CFS.
INTRODUCTION
Cortical deficits of glutathione (GSH) – the primary antioxidant in living tissue – have been implicated in most major neurological and neuropsychiatric disorders. One of the primary roles of GSH is as a free radical “scavenger”1 that detoxifies hydrogen peroxide (H2O2) by converting it to water and to the disulfide form of glutathione, GSSG.1 Competing with GSH for H2O2 is the Fenton reaction2, which is catalyzed by iron-II (Fe2+) and converts H2O2 to iron-III (Fe3+) and to the potent hydroxyl radical (•OH), whose production is inhibited by GSH. The clear implication is that levels of GSH measured by MRS could be low, not because of a genuine deficit, but because of T2 signal loss due to interactions with Fe2+/ Fe3+ - two paramagnetic species that could shorten the T2 of GSH. In this study, quantitative susceptibility mapping (QSM)3-5, which is sensitive to tissue iron content, was used to assess the extent to which the GSH signal might be artificially decreased in vivo in two brain regions known to have relatively low and high iron content.
METHODS
Subjects: Participants in this study consisted of (a) 17 patients with chronic fatigue syndrome (CFS) in whom a significant GSH deficit was previously reported in the occipital cortex (OCC)6 and would serve to determine whether that GSH deficit was due to oxidative stress and not to differential iron content, and (b) 14 medically healthy volunteer (HV) subjects. MRS levels of GSH and bulk magnetic susceptibility - henceforth FeC or iron content - by QSM were assessed in the low iron content OCC7 in the two groups, whereas in the iron-rich striatum (STR)7, only FeC using QSM was assessed in the two groups.
1H MRS of GSH: In vivo OCC GSH spectra were recorded in 15 min on a 3T GE MR system from a 2.0x3.0x3.0-cm3 voxel using the J-editing technique (Figure 1) and an 8-channel phased-array head coil, with TE/TR 68/1500ms and 290 interleaved excitations. Levels of GSH were derived by frequency-domain fitting (Figure 1), and then expressed as peak area ratios relative to the unsuppressed intravoxel water (W) signal.
QSM of Iron Content: Multi-echo gradient echo images were acquired using a 3D spoiled-gradient echo sequence. The local tissue field was obtained using a non-linear voxel-wise fit, quality guided field unwrapping and background field removal. QSM was obtained using MEDI3-5. Region of interest (ROI) analysis was performed on the OCC MRS voxel (Figure 2), and in regions enclosing the left and right striatum (Figure 2). QSM values are established to reflect iron FeC8.
RESULTS
Mean OCC GSH/W in CFS patients ([2.0±0.3]x10-3) was 16.7% lower (p<0.002) than in HV subjects (2.4±0.4]x10-3) (Figure 3). On the other hand, comparing relative FeC between the two groups revealed no differences either for the OCC or the STR region (Figures 2&4), although FeC in STR was significantly higher than in OCC for the both groups (Figure 2). Lastly, while GSH levels did not correlate with FeC within each group, there was a trend toward an inverse correlation between OCC GSH and OCC FeC for the pooled sample of participants (r = -0.374, p = 0.11) (Figure 5).
DISCUSSION AND CONCLUSION
To our knowledge, this study is the first to assess the effect of FeC on brain GSH levels in vivo. The absence of group mean FeC differences in either the OCC or the STR indicates that the observed 16.7% GSH deficit in CFS reflected a genuine increase of antioxidant consumption, consistent with increased oxidative stress in the disorder9,10 In addition, the results of this study confirm the higher FeC content of the striatum than the occipital cortex (Figures 2&4), qualitatively supporting QSM measures as reflecting iron content8. Lastly, although this study found no group differences in FeC in either region between, the trend toward an inverse association between FeC and GSH in the OCC across all subjects (Figure 5) suggests that failure to account for group FeC differences where such differences might exist could lead to GSH level differences reflecting a differential iron content to be interpreted as a genuine pathological depletion of cortical antioxidant reserves. Replication of the present results in a larger study seems warranted.
Acknowledgements
No acknowledgement found.References
Meister AM, Anderson ME. Glutathione. Annual review of biochemistry. 1983 Jul;52(1):711-60.
Halliwell B, Gutteridge JMC: Oxygen toxicity, oxygen radicals, transition metals and disease. Biochem J 1984; 219: 1–14.
de Rochefort L, Liu T, Kressler B, Liu J, Spincemaille P, Lebon V et al. Quantitative susceptibility map reconstruction from MR phase data using bayesian regularization: validation and application to brain imaging. Magn Reson Med 2010; 63(1): 194-206.
Liu T, Wisnieff C, Lou M, Chen W, Spincemaille P, Wang Y. Nonlinear formulation of the magnetic field to source relationship for robust quantitative susceptibility mapping. Magn Reson Med 2013; 69(2): 467-76.
Wang Y, Liu T. Quantitative susceptibility mapping (QSM): Decoding MRI data for a tissue magnetic biomarker. Magn Reson Med 2014.
Shungu DC, Weiduschat N, Murrough JW, Mao X, Pillemer S, Dyke JP, Medow MS, Natelson BH, Stewart JM, Mathew SJ. Increased ventricular lactate in chronic fatigue syndrome. III. Relationships to cortical glutathione and clinical symptoms implicate oxidative stress in disorder pathophysiology. NMR in Biomedicine. 2012 Sep 1;25(9):1073-87.
Haacke EM, Cheng NY, House MJ, Liu Q, Neelavalli J, Ogg RJ, Khan A, Ayaz M, Kirsch W, Obenaus A: Imaging iron stores in the brain using magnetic resonance imaging. Magn Reson Imaging 2005; 23:1-25.
Langkammer C, Schweser F, Krebs N, Deistung A, Goessler W, Scheurer E, Sommer K, Reishofer G, Yen K, Fazekas F, Ropele S. Quantitative susceptibility mapping (QSM) as a means to measure brain iron? A post mortem validation study. Neuroimage. 2012 Sep 30;62(3):1593-9.
Kennedy G, Spence VA, McLaren M, Hill A, Underwood C, Belch JJ. Oxidative stress levels are raised in chronic fatigue syndrome and are associated with clinical symptoms. Free Radic Biol Med 2005; 39: 584-589.
Robinson M, Gray SR, Watson MS, Kennedy G, Hill A, Belch JJ, Nimmo MA. Plasma IL-6, its soluble receptors and F-isoprostanes at rest and during exercise in chronic fatigue syndrome. Scand J Med Sci Sports 2009; 13: 1-9
Figures
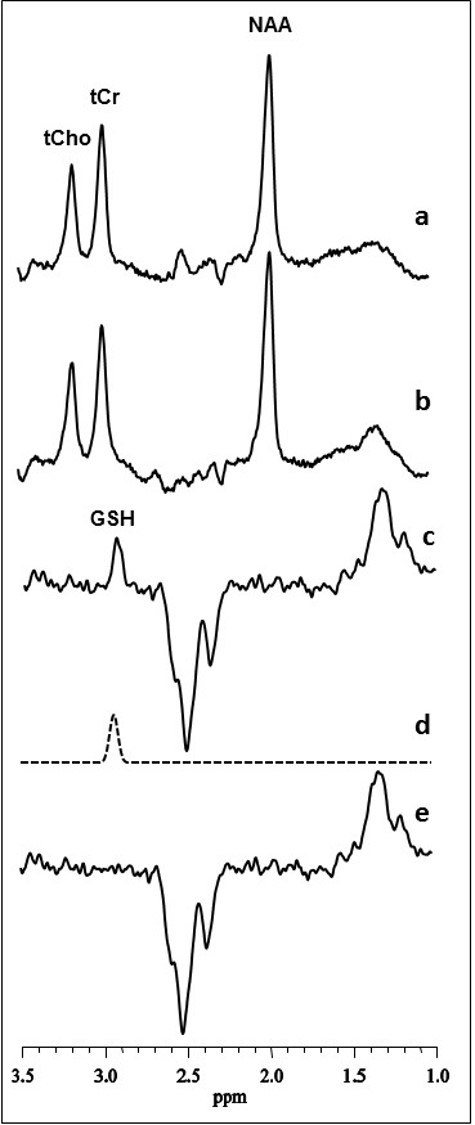
Figure 1: Illustration of brain GSH detection by J-edited difference 1H MRS, followed by frequency-domain fitting of the difference spectrum (c) to obtain GSH peak areas that yield GSH levels.
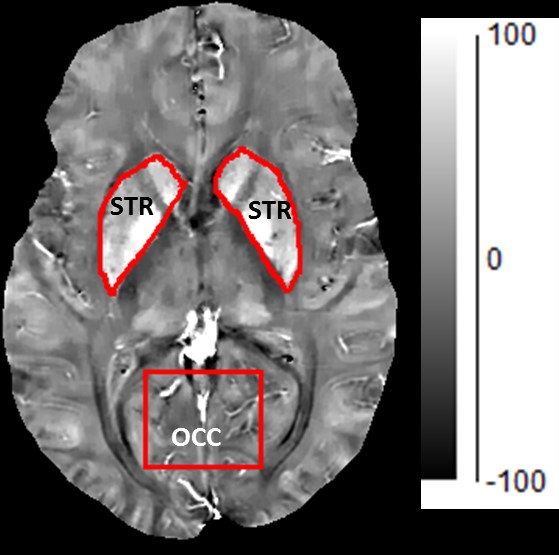
Figure 2: Size and location of the MRS voxel from which both GSH and iron content were assed in the in occipital cortex (OCC). Th striatal region from which iron content by QSM, but not GSH by MRS, was estimated. The higher the pixel intensity, the higher the iron content.
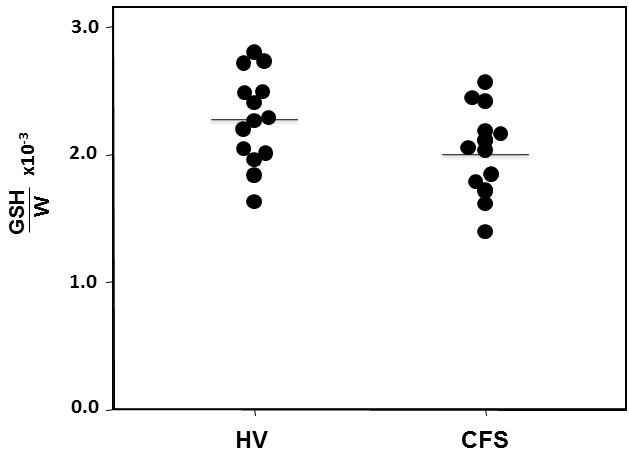
Figure 3: In vivo GSH levels in the occipital cortex of healthy controls and patients with CFS measured by J-edited 1H MRS.
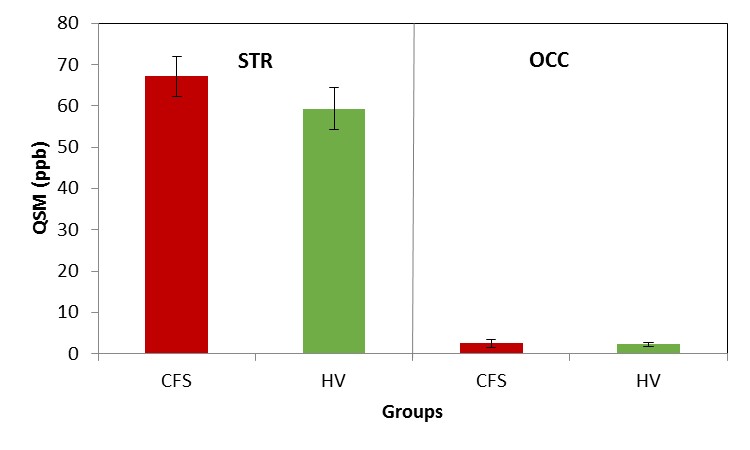
Figure 4: QSM values in parts per billion (ppb) in the striatum (STR), a high iron-content region, and in the occipital cortex (OCC), a low iron-content region, in patients with CFS and healthy volunteer (HV) subjects. Consistent with prior estimates7, iron content was significantly higher in STR than in OCC. However, there were no iron content differences between CFS and HV in either regions.
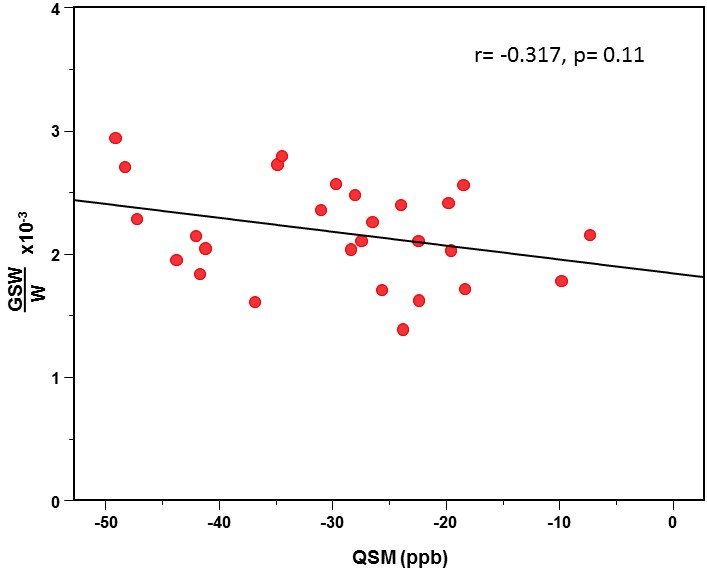
Figure 5: Plot of GSH vs. QSM showing a trend-level inverse correlation.