5503
Integration of Water Referencing with Water Suppression for Absolute Quantification of High-Speed MR Spectroscopic ImagingAkram Etemadi Amin1, Elena Ackley2, Kevin Fotso2, Stephen R Dager3, and Stefan Posse2,4,5
1Physisc and Astronomy, U New Mexico, Albuquerque, NM, United States, 2Neurology, U New Mexico, Albuquerque, NM, United States, 3Radiology, U Washington, Seattle, WA, United States, 4Physics and Astronomy, U New Mexico, Albuquerque, NM, United States, 5Electrical and Computer Engineering, U New Mexico, Albqueruque, NM, United States
Synopsis
We present a new approach with negligible impact on overall scan time that integrates a short water reference acquisition and navigators into the water suppression module, to spatially and spectrally encode the water signal before suppression. We show that this approach enables quantitative 2D and 3D high-speed MR spectroscopic imaging (MRSI) of brain metabolites, for range of pre-localization techniques (slice-selective, slab-selective or PRESS), at short and long TE, and at different slice locations. This method significantly reduces the acquisition time of volumetric MR spectroscopic imaging and is compatible with a wide range of spectroscopic acquisition methods.
Introduction
Current approaches for absolute quantification of metabolites in reference to tissue water require either a separate or an interleaved (partial flip angle) water reference scan (1), which increases scan time. Here we present a new approach with negligible impact on overall scan time that integrates a short water reference acquisition and navigators into the water suppression module, to spatially and spectrally encode the water signal before suppression. We show that this approach enables quantitative 2D and 3D high-speed MR spectroscopic imaging (MRSI) of metabolites in the brains of adults and a child, for range of pre-localization techniques (slice-selective, slab-selective or PRESS), at short and long TE, and at different slice locations.Methods
The modified water suppression module acquires the water signal, which is typically suppressed in proton MR spectroscopy, immediately after RF excitation and integrates an echo-planar spatial-spectral encoding module before signal dephasing with crusher gradients. A binomial slice/slab selective water excitation RF pulse (monopolar, 10 RF pulses) is used for excitation. A navigator with a bipolar readout gradient along the slice direction is acquired after signal excitation to monitor water phase/frequency changes, followed by echo-planar spatial-spectral encoding with conventional phase encoding in the orthogonal direction(s) that is shorter in duration, but otherwise identical to the echo-planar spatial-spectral encoding module for metabolite signals (Figure 1). Four healthy adults (1f,3m) and a 3-month old infant (m) were scanned on clinical 3T Siemens Trio scanners equipped with 12 and 32 channel array coils. Institutionally approved informed consent was obtained. 2D Proton-Echo-Planar-Spectroscopic-Imaging (PEPSI) (2) using either slice-selective or PRESS pre-localization combined with outer volume suppression was performed with TR/TE: 2000/90 ms, spatial matrix: 32x32, voxel size: 1x1x2 cc or 1.5x1.5x2 cc, spectral width: 1087 Hz, digital spectral resolution: 1 Hz (metabolites) and 34 Hz (water), NAV: 1, scan time: 64 s. 3D PEPSI using slab-prelocalization combined with outer volume suppression was performed with TR/TE: 1250/15 ms, spatial matrix (elliptical sampling): 32x32x8, voxel size: 7x7x7 mm, spectral width: 1087 Hz, digital spectral resolution: 1 Hz (metabolites) and 17 Hz (water), NAV: 1, scan time: 2:56 min. All RF pulse waveforms were a 6-sidelobe Hamming filtered sinc. Data were reconstructed online in the image calculation environment (ICE) using ramp sampling correction and even-odd echo separation (2). Water reference data were zero-filled to 1024 points and quantified using LCModel fitting (3) with a line-shape matched basis function. Spectral quantification of metabolites in reference to tissue water was performed using LCModel fitting with simulated basis sets, followed by age-dependent relaxation correction (2).Results
The integration of the water reference acquisition had negligible impact on spectral quality, SNR and water suppression efficiency. Excellent spectral quality was obtained, both in 2D and 3D scans, with slice-averaged Cramer Rao lower bounds of less than 11 % for major singlet resonances (Figures 2-4, Table 1). The SNR in central voxels of the high spatial resolution 3D scan (0.34 cc voxel size) was > 4. Metabolite concentrations measured with this new approach were in the range of results published in previous studies (2,4-7), both at short and long TE, for spin-echo slice selection and for PRESS pre-localization (Table 1). Differences between metabolite concentration measured at short TE using 3D mapping and at long TE using 2D mapping are due to (a) uncorrected differences in chemical shift displacement (between 90o and 180o pulses) related signal attenuation in the 2D scans, and (b) regional differences in relaxation times that were not accounted for in our analysis.Discussion
The integration of the water reference acquisition into the water suppression provides full sensitivity for measuring both metabolites and tissue water in a single acquisition. The short readout of the water reference signal does not impair spectral quantification and water referencing. The spectral bandwidth of the water suppression RF pulse needs to be large enough to encompass all water frequency offsets, at the expense of mapping metabolites close to water. Alternatively, a flip angle correction for off-resonance water signals may be applied. Future work aims at improving quantification by integrating chemical shift displacement correction, partial volume correction, region specific relaxation correction, and navigator-based correction of movement, frequency and phase drifts.Conclusions
Integration of a short water reference acquisition into the water suppression module enables efficient acquisition of both metabolites and tissue water in a single acquisition for the purpose of absolute quantification. This method significantly reduces the acquisition time of volumetric MR spectroscopic imaging and improves reliability of water referencing, which will enhance clinical utility. The approach is compatible with a wide range of spectroscopic acquisition methods.Acknowledgements
This research was in part supported by 1R21EB011606-01 and 1 R01 DA14178-01. We gratefully acknowledge the support of Neva M. Corrigan, Mindy Dixon, Dennis Shaw, Diana South and Chenguang Zhao.References
[1] Maudsley A.A. Domenig, C., Govind, V., Darkazanli, A., Studholme, C., Arheart, K. Bloomer, C. et al. Mapping of brain metabolite distributions by volumetric proton MR spectroscopic imaging (MRSI). NMR Biomed 2009; 61 (3), 548-59. [2] Posse, S., Otazo, R., Caprihan, A. et al. Proton echo-planar spectroscopic imaging of J-coupled resonances in human brain at 3 and 4 Tesla. Magn Reson Med 2007; 58 (2), 236-44. [3] Provencher SW. Automatic quantitation of localized in vivo 1H spectra with LCModel. NMR Biomed 2001;14:260–264. [4] Schubert F, Gallinat J, Seifert F, Rinneberg H. Glutamate concentrations in human brain using single voxel proton magnetic resonance spectroscopy at 3 Tesla. NeuroImage 2004;21:1762–1771. [5] Hurd R, Sailasuta N, Srinivasan R, Vigneron DB, Pelletier D, Nelson SJ. Measurement of brain glutamate using TE-averaged PRESS at 3T. Magn Reson Med 2004;51:435–440. [6] Bartha R, Drost DJ, Menon RS, Williamson PC. Comparison of the quantification precision of human short echo time (1)H spectroscopy at 1.5 and 4.0 Tesla. Magn Reson Med 2000;44:185–192. [7] Tkac I, Gruetter R. Methodology of 1H NMR spectroscopy of the human brain at very high fields. Appl Magn Reson 2005;29:139–157.Figures
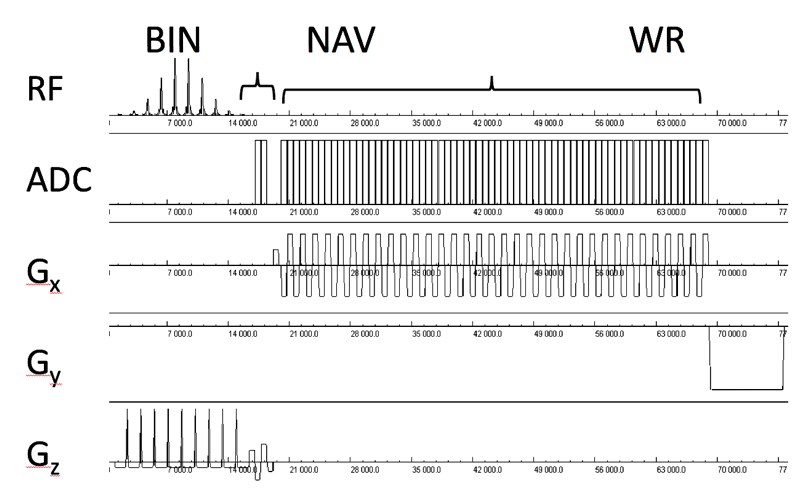
Figure 1: Water suppression module with binomial
spatial-spectral RF pulse (BIN), integrated navigator (NAV) and water reference
(WR) acquisition
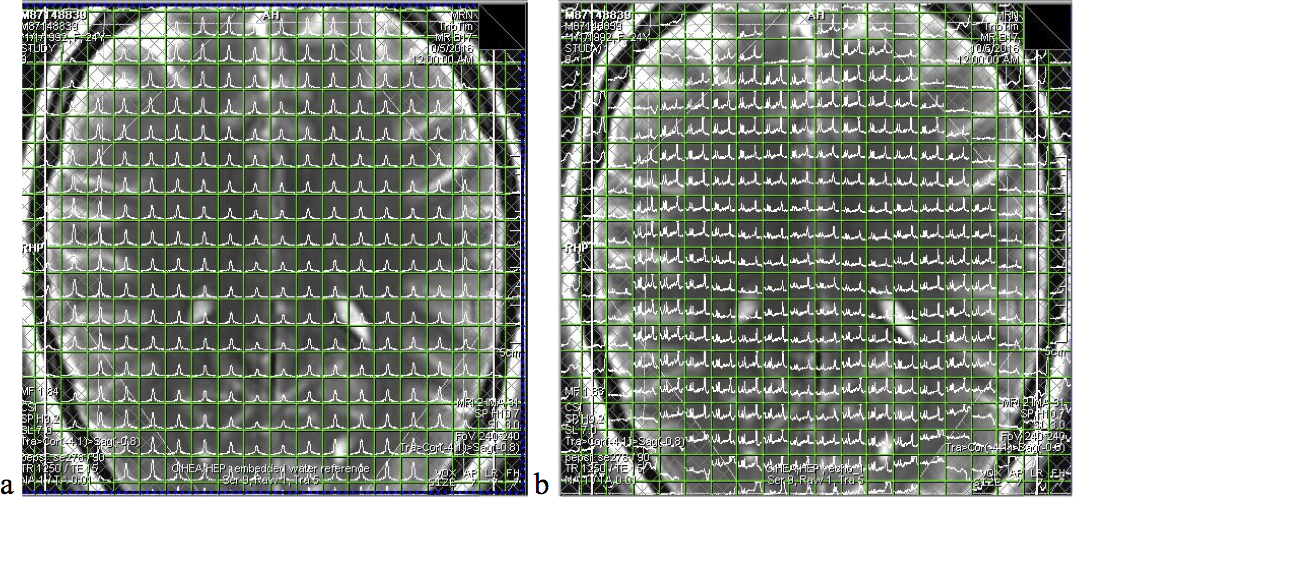
Figure 2: Water (a) and metabolite (b) spectral
arrays reconstructed online in slice 5 of the short TE 3D scan (TR/TE: 1250/15
ms, 7x7x7 mm3 voxel size, scan time: 2:56 min).
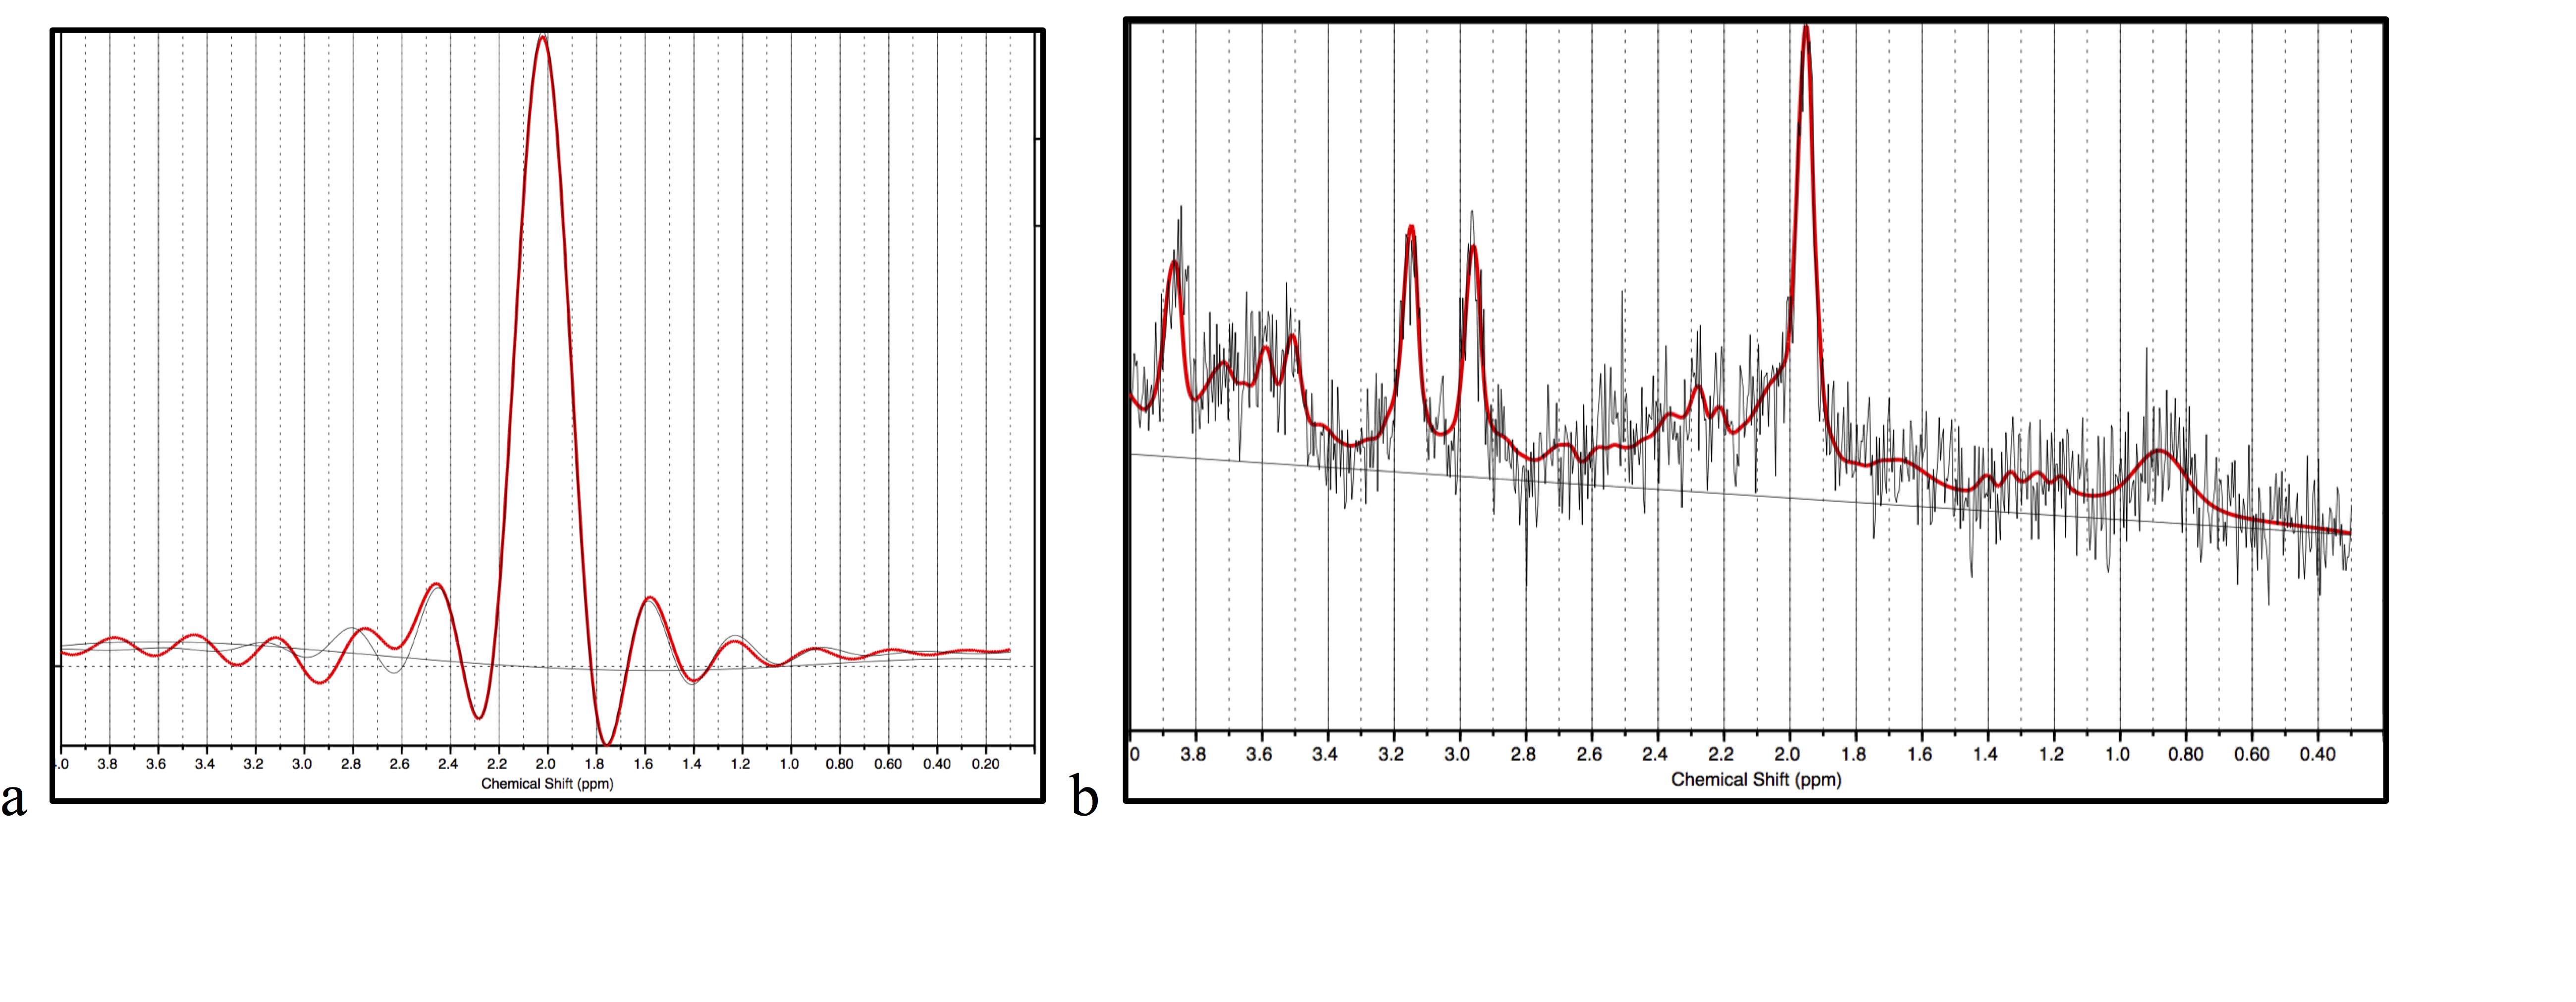
Figure 3: LCModel fit (red) of representative
water (a) and metabolite (b) spectra from a central voxel of the short TE 3D
scan.
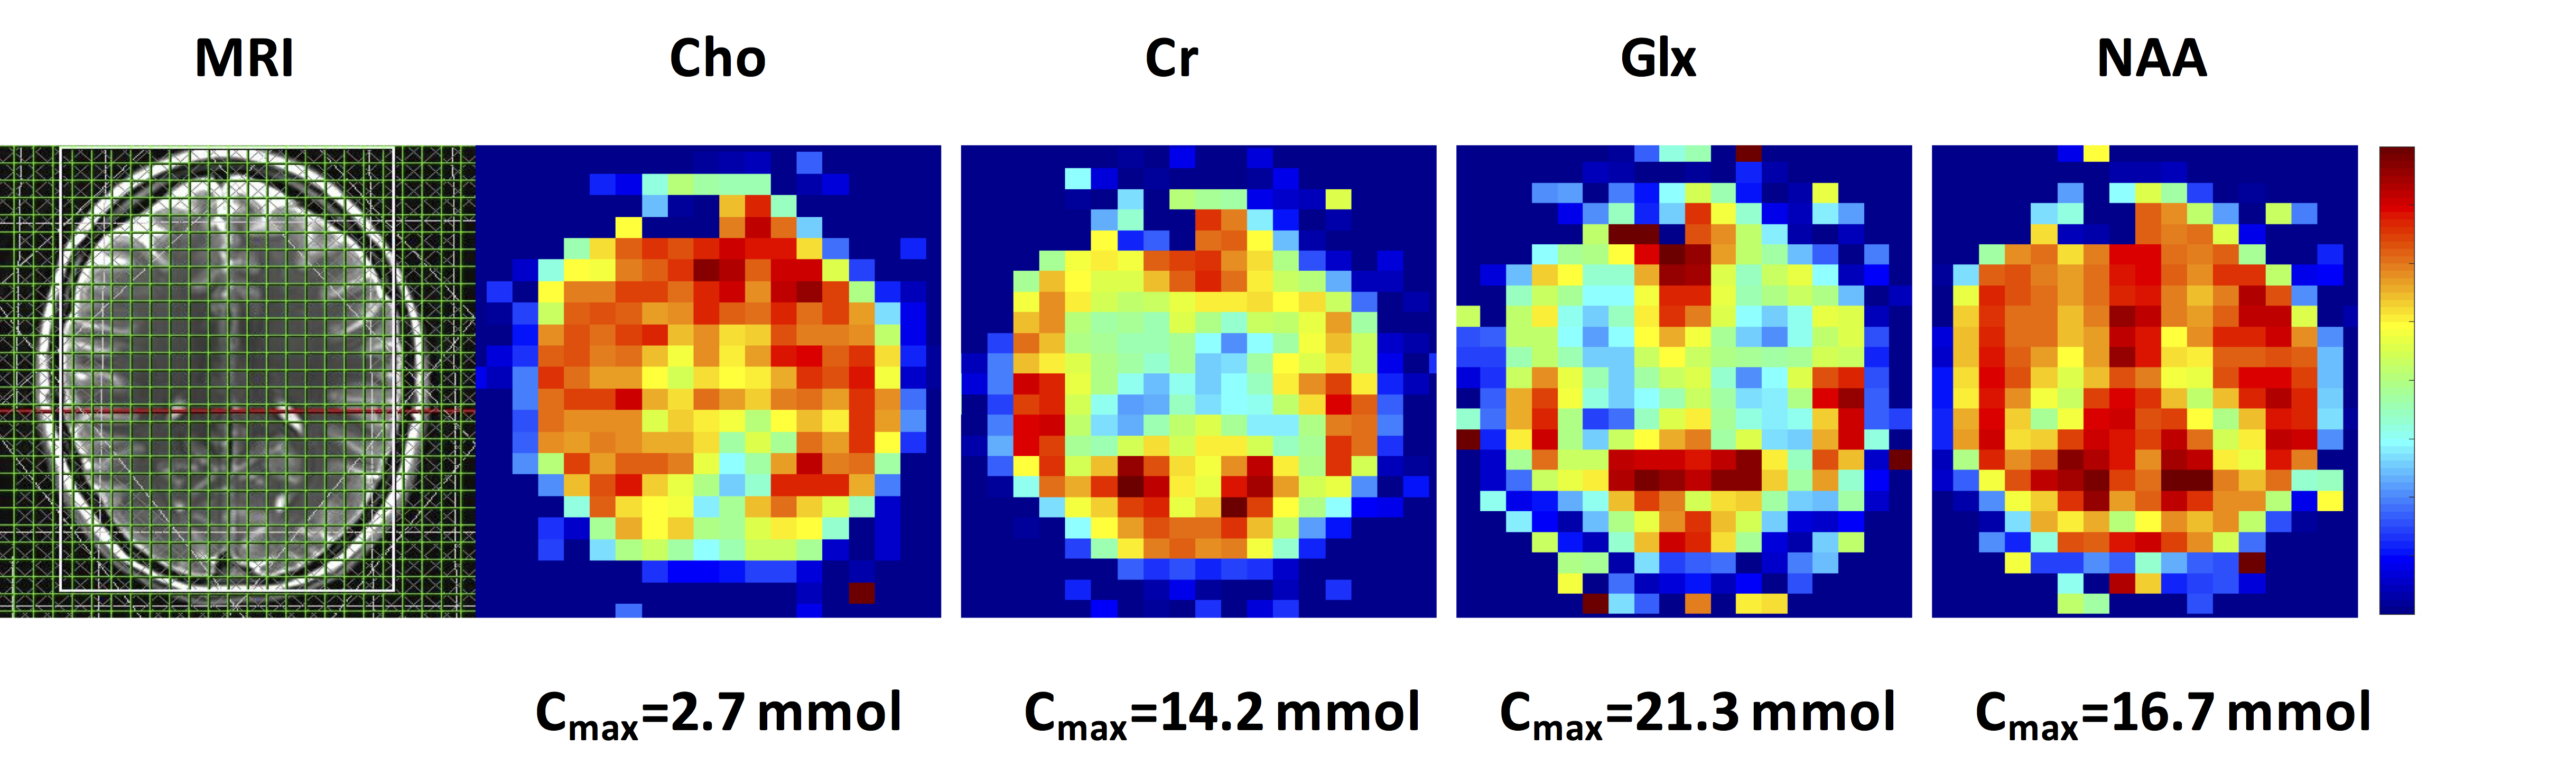
Figure 4: Quantitative metabolite maps from slice
5 of the 3D scan displaying distinct GM/WM contrast and an anterior-posterior concentration
gradient in the Choline map.
Table 1: Slice/slab averaged metabolite
concentrations and Cramer-Rao lower bounds